Texas's 15th congressional district of the United States House of Representatives includes a thin section of the far south of the state of Texas. The district's current Representative is Republican Monica De La Cruz. Elected in 2022, de la Cruz is the first Republican and woman to represent the district.
| Texas's 15th congressional district | |||
|---|---|---|---|
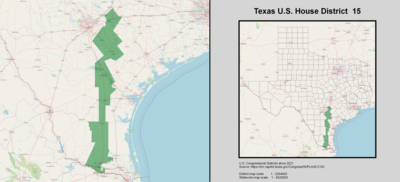 Texas's 15th congressional district - since January 3, 2023. | |||
| Representative |
| ||
| Distribution |
| ||
| Population (2022) | 776,813[2] | ||
| Median household income | $55,382[3] | ||
| Ethnicity |
| ||
| Cook PVI | R+1[4] | ||
Currently, the 15th Congressional District composes of a narrow strip of land running from western Hidalgo County in the Rio Grande Valley northwards to eastern Guadalupe County, to the east of San Antonio. The district includes the entirety of Brooks, Jim Wells, Live Oak, Karnes, and Wilson counties between Hidalgo and Guadalupe counties.
The district has generally given its congressmen very long tenures in Washington; only eight people, seven Democrats and one Republican, have ever represented it. The district's best-known Representative was John Nance Garner, who represented the district from its creation in 1903 until 1933, and was Speaker of the House from 1931 to 1933. He ran with Franklin D. Roosevelt in the 1932 and 1936 presidential campaigns, and was elected Vice President of the United States, serving from 1933 to 1941. The district was one of the first Latino-majority districts in the country, and has been represented by Latino congressmen since 1965.
Notably, this district narrowly voted more Republican in the House elections than the nation as a whole in 2020. Vincente Gonzalez won by 2.9 points while Democrats won the national vote by a combined 3.1 percentage points. It also voted more Republican than the national average while voting Democratic in the 2020 United States presidential election, and the difference between the national vote and the result was wider in the presidential election than the House. Due to redistricting, incumbent Gonzalez in the 2022 election ran in the 34th congressional district. The Republican nominee, former insurance agent Monica de la Cruz defeated the Democratic nominee, businesswoman Michelle Vallejo.
Election results from recent statewide races edit
Results under current lines (since 2023)[5]
| Year | Office | Result |
|---|---|---|
| 2014 | Senate | Cornyn 53 - 47% |
| Governor | Abbott 50 - 50% | |
| 2016 | President | Clinton 55 - 42% |
| 2018 | Senate | O’Rourke 56 - 44% |
| Governor | Valdez 50 - 49% | |
| Lieutenant Governor | Collier 54 - 44% | |
| Attorney General | Nelson 55 - 43% | |
| 2020 | President | Trump 51 - 48% |
| Senate | Cornyn 51 - 46% | |
| 2022 | Governor | Abbott 52 - 46% |
| Lieutenant Governor | Patrick 52 - 45% | |
| Attorney General | Paxton 51 - 47% [6] |
List of members representing the district edit


.jpg)


Election results edit
|
1920 • 1922 • 1924 • 1926 • 1928 • 1930 • 1932 • 1934 • 1936 • 1938 • 1940 • 1942 • 1944 • 1946 • 1948 • 1950 • 1952 • 1954 • 1956 • 1958 • 1960 • 1962 • 1964 • 1966 • 1968 • 1970 • 1972 • 1974 • 1976 • 1978 • 1980 • 1982 • 1984 • 1986 • 1988 • 1990 • 1992 • 1994 • 1996 • 1998 • 2000 • 2002 • 2004 • 2006 (Special) • 2008 • 2010 • 2012 • 2014 • 2016 • 2018 • 2020 • 2022 |
1920 edit
| Party | Candidate | Votes | % | |
|---|---|---|---|---|
| Democratic | John N. Garner (incumbent) | 10,265 | 100.00 | |
| Total votes | 10,265 | 100.0 | ||
| Turnout | {{{votes}}} | |||
| Democratic hold | ||||
1922 edit
| Party | Candidate | Votes | % | |
|---|---|---|---|---|
| Democratic | John N. Garner (incumbent) | 14,366 | 100.00 | |
| Total votes | 14,366 | 100.0 | ||
| Turnout | {{{votes}}} | |||
| Democratic hold | ||||
1924 edit
| Party | Candidate | Votes | % | |
|---|---|---|---|---|
| Democratic | John N. Garner (incumbent) | 22,776 | 100.00 | |
| Total votes | 22,776 | 100.0 | ||
| Turnout | {{{votes}}} | |||
| Democratic hold | ||||
1926 edit
| Party | Candidate | Votes | % | |
|---|---|---|---|---|
| Democratic | John N. Garner (Incumbent) | 13,548 | 82.75 | |
| Republican | Hardie F. Jefferies | 2,823 | 17.25 | |
| Total votes | 16,371 | 100.0 | ||
| Turnout | {{{votes}}} | |||
| Democratic hold | ||||
1928 edit
| Party | Candidate | Votes | % | |
|---|---|---|---|---|
| Democratic | John N. Garner (Incumbent) | 28,417 | 99.99 | |
| Independent | J.L. Burd | 1 | 0.003 | |
| Total votes | 28,418 | 100.0 | ||
| Turnout | {{{votes}}} | |||
| Democratic hold | ||||
1930 edit
| Party | Candidate | Votes | % | |
|---|---|---|---|---|
| Democratic | John N. Garner (Incumbent) | 20,733 | 77.50 | |
| Republican | Carlos G. Watson | 6,016 | 22.50 | |
| Total votes | 26,749 | 100.0 | ||
| Turnout | {{{votes}}} | |||
| Democratic hold | ||||
1932 edit
| Party | Candidate | Votes | % | |
|---|---|---|---|---|
| Democratic | John N. Garner (Incumbent) | 44,318 | 85.75 | |
| Republican | Carlos G. Watson | 7,362 | 14.25 | |
| Total votes | 51,680 | 100.0 | ||
| Turnout | {{{votes}}} | |||
| Democratic hold | ||||
1933 (Special) edit
| Party | Candidate | Votes | % | |
|---|---|---|---|---|
| Democratic | Milton H. West | 13,546 | 91.20 | |
| Republican | Carlos G. Watson | 1,302 | 8.80 | |
| Total votes | 14,848 | 100.0 | ||
| Turnout | {{{votes}}} | |||
| Democratic hold | ||||
1934 edit
| Party | Candidate | Votes | % | |
|---|---|---|---|---|
| Democratic | Milton H. West (Incumbent) | 20,102 | 100.00 | |
| Total votes | 20,102 | 100.0 | ||
| Turnout | {{{votes}}} | |||
| Democratic hold | ||||
1936 edit
| Party | Candidate | Votes | % | |
|---|---|---|---|---|
| Democratic | Milton H. West (Incumbent) | 29,508 | 82.53 | |
| Independent | J.A. Simpson | 6,244 | 17.47 | |
| Total votes | 35,752 | 100.0 | ||
| Turnout | {{{votes}}} | |||
| Democratic hold | ||||
1938 edit
| Party | Candidate | Votes | % | |
|---|---|---|---|---|
| Democratic | Milton H. West (Incumbent) | 18,558 | 99.99 | |
| Other write-in votes | Write-in votes | 2 | 0.010 | |
| Total votes | 18,560 | 100.0 | ||
| Turnout | {{{votes}}} | |||
| Democratic hold | ||||
1940 edit
| Party | Candidate | Votes | % | |
|---|---|---|---|---|
| Democratic | Milton H. West (Incumbent) | 31,800 | 92.36 | |
| Republican | J.A. Simpson | 2,628 | 7.64 | |
| Total votes | 34,428 | 100.0 | ||
| Turnout | {{{votes}}} | |||
| Democratic hold | ||||
1942 edit
| Party | Candidate | Votes | % | |
|---|---|---|---|---|
| Democratic | Milton H. West (Incumbent) | 12,169 | 100.00 | |
| Total votes | 12,169 | 100.0 | ||
| Turnout | {{{votes}}} | |||
| Democratic hold | ||||
1944 edit
| Party | Candidate | Votes | % | |
|---|---|---|---|---|
| Democratic | Milton H. West (Incumbent) | 36,362 | 99.98 | |
| Other write-in votes | Write-in votes | 5 | 0.013 | |
| Total votes | 36,367 | 100.0 | ||
| Turnout | {{{votes}}} | |||
| Democratic hold | ||||
1946 edit
| Party | Candidate | Votes | % | |
|---|---|---|---|---|
| Democratic | Milton H. West (Incumbent) | 14,623 | 99.98 | |
| Other write-in votes | Write-in votes | 3 | 0.020 | |
| Total votes | 14,626 | 100.0 | ||
| Turnout | {{{votes}}} | |||
| Democratic hold | ||||
1948 (Special) edit
| Party | Candidate | Votes | % | |
|---|---|---|---|---|
| Democratic | Lloyd Bentsen | 2,396 | 100.00 | |
| Other write-in votes | Charles McNelly | 1 | 0.00 | |
| Total votes | 2,397 | 100.0 | ||
| Turnout | {{{votes}}} | |||
| Democratic hold | ||||
1948 edit
| Party | Candidate | Votes | % | |
|---|---|---|---|---|
| Democratic | Lloyd Bentsen (Incumbent) | 27,402 | 100.00 | |
| Total votes | 27,402 | 100.0 | ||
| Turnout | {{{votes}}} | |||
| Democratic hold | ||||
1950 edit
| Party | Candidate | Votes | % | |
|---|---|---|---|---|
| Democratic | Lloyd Bentsen (Incumbent) | 18,524 | 100.00 | |
| Total votes | 18,524 | 100.0 | ||
| Turnout | {{{votes}}} | |||
| Democratic hold | ||||
1952 edit
| Party | Candidate | Votes | % | |
|---|---|---|---|---|
| Democratic | Lloyd Bentsen (Incumbent) | 63,767 | 100.00 | |
| Total votes | 63,767 | 100.0 | ||
| Turnout | {{{votes}}} | |||
| Democratic hold | ||||
1954 edit
| Party | Candidate | Votes | % | |
|---|---|---|---|---|
| Democratic | Joe M. Kilgore | 29,113 | 100.00 | |
| Total votes | 29,113 | 100.0 | ||
| Turnout | {{{votes}}} | |||
| Democratic hold | ||||
1956 edit
| Party | Candidate | Votes | % | |
|---|---|---|---|---|
| Democratic | Joe M. Kilgore (Incumbent) | 64,011 | 100.00 | |
| Total votes | 64,011 | 100.0 | ||
| Turnout | {{{votes}}} | |||
| Democratic hold | ||||
1958 edit
| Party | Candidate | Votes | % | |
|---|---|---|---|---|
| Democratic | Joe M. Kilgore (Incumbent) | 28,404 | 100.00 | |
| Total votes | 28,404 | 100.0 | ||
| Turnout | {{{votes}}} | |||
| Democratic hold | ||||
1960 edit
| Party | Candidate | Votes | % | |
|---|---|---|---|---|
| Democratic | Joe M. Kilgore (Incumbent) | 76,421 | 100.00 | |
| Total votes | 76,421 | 100.0 | ||
| Turnout | {{{votes}}} | |||
| Democratic hold | ||||
1962 edit
| Party | Candidate | Votes | % | |
|---|---|---|---|---|
| Democratic | Joe M. Kilgore (Incumbent) | 53,552 | 100.00 | |
| Total votes | 53,552 | 100.0 | ||
| Turnout | {{{votes}}} | |||
| Democratic hold | ||||
1964 edit
| Party | Candidate | Votes | % | |
|---|---|---|---|---|
| Democratic | Kika de la Garza | 66,897 | 69.36 | |
| Republican | Joe B. Coulter | 29,551 | 30.64 | |
| Total votes | 96,448 | 100.0 | ||
| Turnout | {{{votes}}} | |||
| Democratic hold | ||||
1966 edit
| Party | Candidate | Votes | % | |
|---|---|---|---|---|
| Democratic | Kika de la Garza (Incumbent) | 33,129 | 100.00 | |
| Total votes | 33,129 | 100.0 | ||
| Turnout | {{{votes}}} | |||
| Democratic hold | ||||
1968 edit
| Party | Candidate | Votes | % | |
|---|---|---|---|---|
| Democratic | Kika de la Garza (Incumbent) | 57,618 | 100.00 | |
| Total votes | 57,618 | 100.0 | ||
| Turnout | {{{votes}}} | |||
| Democratic hold | ||||
1970 edit
| Party | Candidate | Votes | % | |
|---|---|---|---|---|
| Democratic | Kika de la Garza (Incumbent) | 54,498 | 76.16 | |
| Republican | Ben A. Martinez | 17,049 | 23.82 | |
| Other write-in votes | Write-in votes | 1 | 0.02 | |
| Total votes | 71,548 | 100.0 | ||
| Turnout | {{{votes}}} | |||
| Democratic hold | ||||
1972 edit
| Party | Candidate | Votes | % | |
|---|---|---|---|---|
| Democratic | Kika de la Garza (Incumbent) | 73,994 | 100.00 | |
| Total votes | 73,994 | 100.0 | ||
| Turnout | {{{votes}}} | |||
| Democratic hold | ||||
1974 edit
| Party | Candidate | Votes | % | |
|---|---|---|---|---|
| Democratic | Kika de la Garza (Incumbent) | 42,567 | 100.00 | |
| Total votes | 42,567 | 100.0 | ||
| Turnout | {{{votes}}} | |||
| Democratic hold | ||||
1976 edit
| Party | Candidate | Votes | % | |
|---|---|---|---|---|
| Democratic | Kika de la Garza (Incumbent) | 102,837 | 74.36 | |
| Republican | R.L. (Lendy) McDonald | 35,446 | 25.64 | |
| Total votes | 138,283 | 100.0 | ||
| Turnout | {{{votes}}} | |||
| Democratic hold | ||||
1978 edit
| Party | Candidate | Votes | % | |
|---|---|---|---|---|
| Democratic | Kika de la Garza (Incumbent) | 54,560 | 66.20 | |
| Republican | R.L. (Lendy) McDonald | 27,853 | 33.80 | |
| Total votes | 82,413 | 100.0 | ||
| Turnout | {{{votes}}} | |||
| Democratic hold | ||||
1980 edit
| Party | Candidate | Votes | % | |
|---|---|---|---|---|
| Democratic | Kika de la Garza (Incumbent) | 105,325 | 70.02 | |
| Republican | R.L. (Lendy) McDonald | 45,090 | 29.98 | |
| Total votes | 150,145 | 100.0 | ||
| Turnout | {{{votes}}} | |||
| Democratic hold | ||||
1982 edit
| Party | Candidate | Votes | % | |
|---|---|---|---|---|
| Democratic | Kika de la Garza (Incumbent) | 76,544 | 95.67 | |
| Libertarian | Frank L. Jones III | 3,458 | 4.33 | |
| Total votes | 80,002 | 100.0 | ||
| Turnout | {{{votes}}} | |||
| Democratic hold | ||||
1984 edit
| Party | Candidate | Votes | % | |
|---|---|---|---|---|
| Democratic | Kika de la Garza (Incumbent) | 104,863 | 100.00 | |
| Total votes | 104,863 | 100.0 | ||
| Turnout | {{{votes}}} | |||
| Democratic hold | ||||
1986 edit
| Party | Candidate | Votes | % | |
|---|---|---|---|---|
| Democratic | Kika de la Garza (Incumbent) | 70,077 | 100.00 | |
| Total votes | 70,077 | 100.0 | ||
| Turnout | {{{votes}}} | |||
| Democratic hold | ||||
1988 edit
| Party | Candidate | Votes | % | |
|---|---|---|---|---|
| Democratic | Kika de la Garza (Incumbent) | 93,672 | 93.85 | |
| Libertarian | Gloria Joyce Hendrix | 6,133 | 6.15 | |
| Total votes | 99,805 | 100.0 | ||
| Turnout | {{{votes}}} | |||
| Democratic hold | ||||
1990 edit
| Party | Candidate | Votes | % | |
|---|---|---|---|---|
| Democratic | Kika de la Garza (Incumbent) | 72,461 | 100.00 | |
| Total votes | 138,283 | 100.0 | ||
| Turnout | {{{votes}}} | |||
| Democratic hold | ||||
1992 edit
| Party | Candidate | Votes | % | |
|---|---|---|---|---|
| Democratic | Kika de la Garza (Incumbent) | 86,351 | 60.42 | |
| Republican | Tom Haughey | 56,549 | 39.58 | |
| Total votes | 142,900 | 100.0 | ||
| Turnout | {{{votes}}} | |||
| Democratic hold | ||||
1994 edit
| Party | Candidate | Votes | % | |
|---|---|---|---|---|
| Democratic | Kika de la Garza (Incumbent) | 61,527 | 58.95 | |
| Republican | Tom Haughey | 41,119 | 39.39 | |
| Independent | John c.c. Hamilton | 1,720 | 1.64 | |
| Total votes | 104,366 | 100.0 | ||
| Turnout | {{{votes}}} | |||
| Democratic hold | ||||
1996 edit
| Party | Candidate | Votes | % | |
|---|---|---|---|---|
| Democratic | Rubén Hinojosa | 86,347 | 62.28 | |
| Republican | Tom Haughey | 50,914 | 36.72 | |
| Natural Law | Rob Wofford | 1,333 | 1.00 | |
| Total votes | 138,621 | 100.0 | ||
| Turnout | {{{votes}}} | |||
| Democratic hold | ||||
1998 edit
| Party | Candidate | Votes | % | |
|---|---|---|---|---|
| Democratic | Rubén Hinojosa (Incumbent) | 47,957 | 58.35 | |
| Republican | Tom Haughey | 34,221 | 41.65 | |
| Total votes | 82,178 | 100.0 | ||
| Turnout | {{{votes}}} | |||
| Democratic hold | ||||
2000 edit
| Party | Candidate | Votes | % | |
|---|---|---|---|---|
| Democratic | Rubén Hinojosa (Incumbent) | 106,570 | 88.47 | |
| Libertarian | Frank Jones | 13,167 | 10.93 | |
| Write-in | Israel Cantu | 711 | 0.60 | |
| Total votes | 120,448 | 100.0 | ||
| Turnout | {{{votes}}} | |||
| Democratic hold | ||||
2002 edit
| Party | Candidate | Votes | % | |
|---|---|---|---|---|
| Democratic | Rubén Hinojosa (Incumbent) | 66,311 | 100.0 | |
| Total votes | 66,311 | 100.0 | ||
| Turnout | {{{votes}}} | |||
| Democratic hold | ||||
2004 edit
| Party | Candidate | Votes | % | |
|---|---|---|---|---|
| Democratic | Rubén Hinojosa (Incumbent) | 96,089 | 57.76 | |
| Republican | Michael D. Thamm | 67,917 | 40.82 | |
| Libertarian | William R. Cady | 2,352 | 1.41 | |
| Total votes | 166,358 | 100.0 | ||
| Turnout | {{{votes}}} | |||
| Democratic hold | ||||
2006 (Special) edit
| Party | Candidate | Votes | % | |
|---|---|---|---|---|
| Democratic | Rubén Hinojosa (Incumbent) | 43,236 | 61.77 | |
| Republican | Paul B. Haring | 16,601 | 23.72 | |
| Republican | Eddie Zamora | 10,150 | 14.51 | |
| Total votes | 69,987 | 100.0 | ||
| Turnout | {{{votes}}} | |||
| Democratic hold | ||||
2008 edit
| Party | Candidate | Votes | % | |
|---|---|---|---|---|
| Democratic | Rubén Hinojosa (Incumbent) | 107,578 | 67.28 | |
| Republican | Eddie Zamora | 52,303 | 32.72 | |
| Total votes | 159,881 | 100.0 | ||
| Turnout | {{{votes}}} | |||
| Democratic hold | ||||
2010 edit
| Party | Candidate | Votes | % | |
|---|---|---|---|---|
| Democratic | Rubén Hinojosa (Incumbent) | 53,546 | 55.73 | |
| Republican | Eddie Zamora | 39.964 | 41.59 | |
| Libertarian | Aaron I. Cohn | 2,570 | 2.68 | |
| Total votes | 96,080 | 100.0 | ||
| Turnout | {{{votes}}} | |||
| Democratic hold | ||||
2012 edit
| Party | Candidate | Votes | % | |
|---|---|---|---|---|
| Democratic | Rubén Hinojosa (Incumbent) | 89,296 | 60.88 | |
| Republican | Dale Brueggemann | 54,056 | 36.85 | |
| Libertarian | Ron Finch | 3,309 | 2.27 | |
| Total votes | 146,661 | 100.0 | ||
| Turnout | {{{votes}}} | |||
| Democratic hold | ||||
2014 edit
| Party | Candidate | Votes | % | |
|---|---|---|---|---|
| Democratic | Rubén Hinojosa (Incumbent) | 48,708 | 54.01 | |
| Republican | Eddie Zamora | 39,016 | 43.26 | |
| Libertarian | Johnny Partain | 2,460 | 2.73 | |
| Total votes | 90,184 | 100.0 | ||
| Turnout | {{{votes}}} | |||
| Democratic hold | ||||
2016 edit
| Party | Candidate | Votes | % | |
|---|---|---|---|---|
| Democratic | Vicente Gonzalez | 101,712 | 57.31 | |
| Republican | Tim Westley | 66,877 | 37.68 | |
| Green | Vanessa S. Tijerina | 5,448 | 3.07 | |
| Libertarian | Ross Lynn Leone | 3,442 | 1.94 | |
| Total votes | 177,479 | 100.0 | ||
| Democratic hold | ||||
2018 edit
| Party | Candidate | Votes | % | |
|---|---|---|---|---|
| Democratic | Vicente Gonzalez (incumbent) | 98,333 | 59.07 | |
| Republican | Tim Westley | 63,862 | 38.07 | |
| Libertarian | Anthony Cristo | 2,607 | 1.06 | |
| Total votes | 164,802 | 100.0 | ||
| Democratic hold | ||||
2020 edit
| Party | Candidate | Votes | % | |
|---|---|---|---|---|
| Democratic | Vicente Gonzalez (incumbent) | 115,605 | 50.05 | |
| Republican | Monica De La Cruz | 109,017 | 47.06 | |
| Libertarian | Ross Lynn Leone | 4,295 | 1.09 | |
| Total votes | 228,917 | 100.0 | ||
| Democratic hold | ||||
2022 edit
| Party | Candidate | Votes | % | ||
|---|---|---|---|---|---|
| Republican | Monica De La Cruz | 80,978 | 53.31 | ||
| Democratic | Michelle Vallejo | 68,097 | 44.83 | ||
| Libertarian | Ross Leone | 2,814 | 1.85 | ||
| Total votes | 151,889 | 100.0 | |||
| Republican gain from Democratic | |||||
Historical district boundaries edit


See also edit
References edit
- Specific
- ^ "Congressional Districts Relationship Files (State-based)". U.S. Census Bureau. Archived from the original on April 2, 2013.
- ^ "My Congressional District".
- ^ "My Congressional District".
- ^ "2022 Cook PVI: District Map and List". Cook Political Report. Retrieved January 10, 2023.
- ^ "2022 Cook PVI: District Map and List". Cook Political Report. Retrieved January 23, 2023.
- ^ "TX 2022 Congressional". Dave’s Redistricting App. Retrieved July 15, 2023.
- ^ "District Population Analysis with County Subtotals | CONGRESSIONAL DISTRICTS - PLANC2100" (PDF). Capitol Data Portal. Texas Legislative Council. August 26, 2021. Archived (PDF) from the original on June 27, 2022. Retrieved January 1, 2023.
- ^ "District Population Analysis with County Subtotals | CONGRESSIONAL DISTRICTS - PLANC2193" (PDF). Capitol Data Portal. Texas Legislative Council. October 17, 2021. Archived (PDF) from the original on December 25, 2022. Retrieved January 1, 2023.
- ^ 1920 election results
- ^ 1922 election results
- ^ 1924 election results
- ^ 1926 election results
- ^ 1928 election results
- ^ 1930 election results
- ^ 1932 election results
- ^ 1934 election results
- ^ 1936 election results
- ^ 1938 election results
- ^ 1940 election results
- ^ 1942 election results
- ^ 1944 election results
- ^ 1946 election results
- ^ 1948 election results
- ^ 1950 election results
- ^ 1952 election results
- ^ 1954 election results
- ^ 1956 election results
- ^ 1958 election results
- ^ 1960 election results
- ^ 1962 election results
- ^ 1964 election results
- ^ 1966 election results
- ^ 1968 election results
- ^ 1970 election results
- ^ 1972 election results
- ^ 1974 election results
- ^ 1976 election results
- ^ 1978 election results
- ^ 1980 election results
- ^ 1982 election results
- ^ 1984 election results
- ^ 1986 election results
- ^ 1988 election results
- ^ 1990 election results
- ^ 1992 election results
- ^ 1994 election results
- ^ 1996 election results
- ^ 1998 election results
- ^ 2000 election results
- ^ 2002 election results
- ^ 2004 election results
- ^ 2006 election results
- ^ 2008 election results
- ^ 2010 election results
- ^ 2012 election results
- ^ 2014 election results
- ^ 2016 election results
- General
- Martis, Kenneth C. (1989). The Historical Atlas of Political Parties in the United States Congress. New York: Macmillan Publishing Company.
- Martis, Kenneth C. (1982). The Historical Atlas of United States Congressional Districts. New York: Macmillan Publishing Company.
- Congressional Biographical Directory of the United States 1774–present