
Loves politics, Loves colorizing images, hopes to brighten the place up :)
IGNORE ANYTHING BELOW HERE
| |||||||||||||||||||||||||||||||||||||
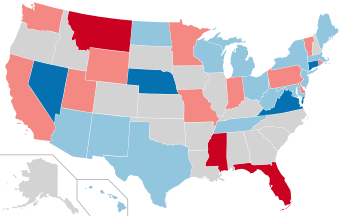
531 members of the Electoral College 266 electoral votes needed to win | |||||||||||||||||||||||||||||||||||||
|---|---|---|---|---|---|---|---|---|---|---|---|---|---|---|---|---|---|---|---|---|---|---|---|---|---|---|---|---|---|---|---|---|---|---|---|---|---|
| Turnout | 52.2%[1] | ||||||||||||||||||||||||||||||||||||
| |||||||||||||||||||||||||||||||||||||
 Presidential election results map. Red denotes states won by MacArthur/McCarthy, blue denotes those won by Fulbright/Barkley, green denotes those won by Wallace/Roosevelt. Numbers indicate the number of electoral votes allotted to each state. | |||||||||||||||||||||||||||||||||||||
| |||||||||||||||||||||||||||||||||||||


.jpg)
| Lafayette's Rebellion | |||||||
|---|---|---|---|---|---|---|---|
| Part of the Atlantic Revolutions | |||||||
 Québécois troops led by Lafayette at the Battle of Quebec City, 1783 | |||||||
| |||||||
| Belligerents | |||||||
|
|
| ||||||
| Commanders and leaders | |||||||
|
|
| ||||||
| Strength | |||||||
| 5,400 soldiers | 2,500 soldiers | ||||||
| Casualties and losses | |||||||
|
46 dead 34 wounded[3] |
130 dead, 500 wounded | ||||||
| |||||||||||||||||||||||||||||||||||||||||||||||||||||||||||||
538 members of the Electoral College 270 electoral votes needed to win | |||||||||||||||||||||||||||||||||||||||||||||||||||||||||||||
|---|---|---|---|---|---|---|---|---|---|---|---|---|---|---|---|---|---|---|---|---|---|---|---|---|---|---|---|---|---|---|---|---|---|---|---|---|---|---|---|---|---|---|---|---|---|---|---|---|---|---|---|---|---|---|---|---|---|---|---|---|---|
| Opinion polls | |||||||||||||||||||||||||||||||||||||||||||||||||||||||||||||
| Turnout | 62.5%[4] | ||||||||||||||||||||||||||||||||||||||||||||||||||||||||||||
| |||||||||||||||||||||||||||||||||||||||||||||||||||||||||||||
 Presidential election results map. Red denotes states won by Nixon/Agnew, blue denotes those won by Johnson/Daley, and orange denotes those won by Wallace/LeMay, including several faithless electors. Green denotes faithless electors for McCarthy/McGovern. Numbers indicate electoral votes cast by each state. | |||||||||||||||||||||||||||||||||||||||||||||||||||||||||||||
| |||||||||||||||||||||||||||||||||||||||||||||||||||||||||||||
.jpg)

_(3x4).jpg)
.jpg)
Candidates for the Republican Nomination edit
| Candidate | Most recent office | Home state | Campaign
Withdrawal date |
Popular vote | Contests won | ||
|---|---|---|---|---|---|---|---|
| John Heinz | 
|
U.S. Senator from Pennsylvania (1977-Present) |
 Pennsylvania |
 Withdrew at Convention |
5,530,981 (58.2%) |
44 AL, AK, AZ, AR, CA, CO, CT, DE, Fl, GA, HI, ID, IL, IN, IA, KS, KY, LA, ME, MD, MA, MI, MN, MS, MO, MT, NE, NV, NH, NM, NY, NC, ND, OH, OR, RI, SC, SD, TN, VT, VA, WA, WI, WY | |
| John B. Anderson | .jpg)
|
44th President of the United States (1991-Present) |
 Illinois |
Won Nomination |
5,530,981 (58.2%) |
44 AL, AK, AZ, AR, CA, CO, CT, DE, Fl, GA, HI, ID, IL, IN, IA, KS, KY, LA, ME, MD, MA, MI, MN, MS, MO, MT, NE, NV, NH, NM, NY, NC, ND, OH, OR, RI, SC, SD, TN, VT, VA, WA, WI, WY | |
| Oliver North | 
|
U.S. Senator from Virginia (1989-Present) |
Virginia |
Withdrew at Convention |
5,530,981 (58.2%) |
44 AL, AK, AZ, AR, CA, CO, CT, DE, Fl, GA, HI, ID, IL, IN, IA, KS, KY, LA, ME, MD, MA, MI, MN, MS, MO, MT, NE, NV, NH, NM, NY, NC, ND, OH, OR, RI, SC, SD, TN, VT, VA, WA, WI, WY | |
| John H. Sununu | .jpg)
|
75th Governor of New Hampshire (1983-Present) |
New Hampshire |
Withdrew at Convention |
5,530,981 (58.2%) |
44 AL, AK, AZ, AR, CA, CO, CT, DE, Fl, GA, HI, ID, IL, IN, IA, KS, KY, LA, ME, MD, MA, MI, MN, MS, MO, MT, NE, NV, NH, NM, NY, NC, ND, OH, OR, RI, SC, SD, TN, VT, VA, WA, WI, WY | |
| Alan Keyes | .jpg)
|
Asst. Secretary of State (1985–1991) |
 Maryland |
(Campaign) |
985,819 (5.1%) |
0 | |
| John McCain | 
|
U.S. Senator from Arizona (1987–Present) |
 Arizona |
(Campaign) |
6,061,332 (31.23%) |
7 AZ, CT, MA, MI, NH, RI, VT | |
| Dan Quayle | 
|
U.S. Senator from Indiana (1981–Present) |
 Indiana |
Withdrew at Convention |
1,938,694 (20.4%) |
3 NJ, PA, WV | |
| Rudy Giuliani | .jpg)
|
United States Attorney for the Southern District of New York (1985-1988) |
.svg) New York |
Withdrew at Convention |
1,938,694 (20.4%) |
3 NJ, PA, WV | |
| Ted Bundy | 
|
U.S. Senator from Washington (1989–Present) |
 Washington |
Withdrew at Convention |
1,938,694 (20.4%) |
3 NJ, PA, WV | |
Candidates for the Progressive Nomination edit
| Candidate | Most recent office | Home state | Campaign
Withdrawal date |
Popular vote | Contests won | ||
|---|---|---|---|---|---|---|---|
| Ralph Nader | .jpg)
|
Progressive Activist from Connecticut |
 Connecticut |
Withdrew at Convention |
5,530,981 (58.2%) |
44 AL, AK, AZ, AR, CA, CO, CT, DE, Fl, GA, HI, ID, IL, IN, IA, KS, KY, LA, ME, MD, MA, MI, MN, MS, MO, MT, NE, NV, NH, NM, NY, NC, ND, OH, OR, RI, SC, SD, TN, VT, VA, WA, WI, WY | |
| George McGovern | 
|
Former U.S. Senator from South Dakota (1963–1987) |
 South Dakota |
Won Nomination |
589,211 (6.2%) |
1 UT | |
| Lyndon LaRouche | .jpg)
|
Political Activist from Illinois |
Illinois |
Withdrew at Convention |
1,444,517 (15.2%) |
3 OK, TX & DC | |
| Bernie Sanders | .jpg)
|
Governor of Vermont (1989–Present) |
 Vermont |
Withdrew: May 18 |
1,938,694 (20.4%) |
3 NJ, PA, WV | |
Candidates for the New Democratic Nomination edit
| Candidate | Most recent office | Home state | Campaign
Withdrawal date |
Popular vote | Contests won | ||
|---|---|---|---|---|---|---|---|
| Al Gore | .jpg)
|
U.S. Senator from Tennessee (1985–Present) |
Tennessee |
Won Nomination |
5,530,981 (58.2%) |
44 AL, AK, AZ, AR, CA, CO, CT, DE, Fl, GA, HI, ID, IL, IN, IA, KS, KY, LA, ME, MD, MA, MI, MN, MS, MO, MT, NE, NV, NH, NM, NY, NC, ND, OH, OR, RI, SC, SD, TN, VT, VA, WA, WI, WY | |
| Ted Wilson | 
|
U.S. Senator from Utah (1989–Present) |
 Utah |
Withdrew: April 16 |
589,211 (6.2%) |
1 UT | |
| Charlie Wilson | 
|
U.S. representative from TX-02 (1973-Present) |
 Texas |
Withdrew at Convention |
1,444,517 (15.2%) |
3 OK, TX & DC | |
| Bob Casey Sr. | Governor of Pennsylvania (1987–Present) |
Pennsylvania |
Withdrew: May 10 |
1,938,694 (20.4%) |
3 NJ, PA, WV | ||
Candidates for the Democratic Nomination edit
| Candidate | Most recent office | Home state | Campaign
Withdrawal date |
Popular vote | Contests won | ||
|---|---|---|---|---|---|---|---|
| Jerry Brown | 
|
U.S. Senator from California (1983–1989) |
 California |
Withdrew at convention |
4,568,894 (34.2%) |
17 AK, CA, CT, HI, NH, NM, NJ, NY, NV, MI, OR, VT, WA & DC, PR, NMA, USV | |
| Gary Hart | .jpg)
|
U.S. Senator from Colorado (1979–Present) |
 Colorado |
Won Nomination |
6,826,622 (51.1%) |
31 AL, AR, AZ, CO, DE, FL, GA, IA, KS, KY, LA, MD, MN, MO, MS, MT, NC, ND, NE, OH, OK, PA, SC, SD, TN, TX, UT, VA, WI, WV & ASAM | |
| Adlai Stevenson III | .jpg)
|
43rd Vice President of the United States (1983-1985) |
Illinois |
Withdrew: March 21 |
1,349,293 (10.1%) |
3 ID, IL, IN | |
| John Kerry | .jpg)
|
U.S. Senator from Massachusetts (1985–Present) |
 Massachusetts |
Withdrew: April 15 |
614,529 (4.6%) |
4 MA, ME, RD & GUAM | |
| |||||||||||||||||||||
| |||||||||||||||||||||
 Results by state house district Stevens: 50–60% 60–70% 70–80% | |||||||||||||||||||||
| |||||||||||||||||||||


| |||||||||||||||||||||||||||||||||||||||||||||||||||||
| |||||||||||||||||||||||||||||||||||||||||||||||||||||
 County results Kennedy: 20–30% 30–40% 40–50% Epstein: 20–30% 30–40% Fulani: 20–30% D'Amato: 20–30% 30–40% Giuliani: 20–30% | |||||||||||||||||||||||||||||||||||||||||||||||||||||
| |||||||||||||||||||||||||||||||||||||||||||||||||||||
.jpg)


| |||||||||||||||||||||
| |||||||||||||||||||||
 Results by County Kerry: 40–50% 50–60% Rappaport: 40–50% | |||||||||||||||||||||
| |||||||||||||||||||||
| |||||||||||||||||
| |||||||||||||||||


Pell: 50–60% 60–70% 70–80% Schneider: 50–60% | |||||||||||||||||
| |||||||||||||||||


| |||||||||||||||||||||
| |||||||||||||||||||||
 County results Durkin: 40–50% 50–60% Smith: 40–50% 50–60% | |||||||||||||||||||||
| |||||||||||||||||||||
.jpg)

| |||||||||||||||||||||
| |||||||||||||||||||||
 County results Cohen: 60–70% 70–80% | |||||||||||||||||||||
| |||||||||||||||||||||
.jpg)

| |||||||||||||||||||||||||||||||||||||
| |||||||||||||||||||||||||||||||||||||
 County results Florio: 40–50% 50–60% 60–70% Bell: 40–50% 50–60% 60–70% | |||||||||||||||||||||||||||||||||||||
| |||||||||||||||||||||||||||||||||||||


| |||||||||||||||||
| |||||||||||||||||
 County results Biden: 100% | |||||||||||||||||
| |||||||||||||||||

| |||||||||||||||||
| Turnout | 25.5% (voting eligible)[5] | ||||||||||||||||
|---|---|---|---|---|---|---|---|---|---|---|---|---|---|---|---|---|---|
| |||||||||||||||||
 County and independent city results Miller: 40–50% 50–60% 60–70% Warner: 40–50% 50–60% 60–70% | |||||||||||||||||
| |||||||||||||||||
.jpg)
| |||||||||||||||||
| |||||||||||||||||
 County results Raese: 50–60% 60–70% See: 50–60% 60–70% 70–80% | |||||||||||||||||
| |||||||||||||||||


| |||||||||||||||||
| |||||||||||||||||
 County results Easley: 50–60% 60–70% 70–80% Helms: 50–60% 60–70% 70–80% | |||||||||||||||||
| |||||||||||||||||


| |||||||||||||||||
| |||||||||||||||||
 County results McConnell: 50–60% 60–70% 70–80% 80–90% Sloane: 50–60% 60–70% 70–80% | |||||||||||||||||
| |||||||||||||||||

| |||||||||||||||||
| |||||||||||||||||
 County results Gore: 50–60% 60–70% 70–80% 80-90% | |||||||||||||||||
| |||||||||||||||||
| |||||||||||||||||||||
| |||||||||||||||||||||
 County results Levin: 40–50% 50–60% 60–70% Schuette: 40–50% 50–60% 60–70% | |||||||||||||||||||||
| |||||||||||||||||||||


| |||||||||||||||||
| Turnout | 54.90% | ||||||||||||||||
|---|---|---|---|---|---|---|---|---|---|---|---|---|---|---|---|---|---|
| |||||||||||||||||
 County results Simon: 50–60% 60–70% 70–80% 80–90% Martin: 50–60% | |||||||||||||||||
| |||||||||||||||||

.jpg)
| |||||||||||||||||||||||||||||||||||||
| |||||||||||||||||||||||||||||||||||||
 County results Mondale: 30–40% 40–50% 50–60% Wellstone: 40–50% 50–60% Boschwitz: 30–40% 40–50% Johnson: 40–50% 50–60% | |||||||||||||||||||||||||||||||||||||
| |||||||||||||||||||||||||||||||||||||


| |||||||||||||||||
| |||||||||||||||||
 County results
Thurmond: 50–60% 60–70% 70–80% Patterson: 50–60% | |||||||||||||||||
| |||||||||||||||||


| |||||||||||||||||
| |||||||||||||||||
 County results Nunn: 100% | |||||||||||||||||
| |||||||||||||||||

| |||||||||||||||||
| |||||||||||||||||
 County results Heflin: 50–60% 60–70% 70–80% Bachus: 50–60% 60–70% | |||||||||||||||||
| |||||||||||||||||
.jpg)

| |||||||||||||||||
| |||||||||||||||||
 County results Cochran: >90% No vote: | |||||||||||||||||
| |||||||||||||||||

| |||||||||||||||||
| |||||||||||||||||
 County results Clark: 50–60% 60–70% Tauke: 50–60% 60–70% 70–80% | |||||||||||||||||
| |||||||||||||||||


| |||||||||||||||||
| |||||||||||||||||
 County results Abdnor: 40-50% 50-60% 60-70% 70-80% Wollman: 40–50% 50–60% | |||||||||||||||||
| |||||||||||||||||


| |||||||||||||||||
| |||||||||||||||||
 County results Chambers: 50–60% 60–70% 70–80% DeCamp: 50-60% 60-70% 70-80% 80-90% | |||||||||||||||||
| |||||||||||||||||

| |||||||||||||||||
| |||||||||||||||||
 County results Kassebaum: 60-70% 70-80% 80-90% | |||||||||||||||||
| |||||||||||||||||

| |||||||||||||||||
| |||||||||||||||||
 Inhofe: 50–60% 60–70% 70–80% Risenhoover: 40–50% 50–60% | |||||||||||||||||
| |||||||||||||||||
.jpg)

| |||||||||||||||||
| |||||||||||||||||
 County results Pryor: 100% | |||||||||||||||||
| |||||||||||||||||
.jpg)
| |||||||||||||||||
| |||||||||||||||||
 Parish results Breaux: 40–50% 50–60% 60–70% 70–80% Rarick: 40–50% 50–60% 60–70% | |||||||||||||||||
| |||||||||||||||||


| |||||||||||||||||||||
| |||||||||||||||||||||
 County results Saiki: 40–50% Akaka: 30–40% 40–50% | |||||||||||||||||||||
| |||||||||||||||||||||


| |||||||||||||||||||||||||||||||||||||||||
| |||||||||||||||||||||||||||||||||||||||||
 County results Gramm: 40–50% 50–60% 60–70% 70–80% 80–90% Tie: 50–60% Parmer: 40–50% 50–60% 60–70% 70–80% | |||||||||||||||||||||||||||||||||||||||||
| |||||||||||||||||||||||||||||||||||||||||


| |||||||||||||||||||||
| |||||||||||||||||||||
 County results Anaya: 40–50% 50–60% 60–70% McMillian: 40–50% 50–60% 70–80% | |||||||||||||||||||||
| |||||||||||||||||||||
.png)


| |||||||||||||||||||||||||||||||||||||
| |||||||||||||||||||||||||||||||||||||
 County results Armstrong: 30–40% 40–50% 50–60% 60–70% Morrissey: 30–40% 40–50% 50–60% Lamm: 30–40% | |||||||||||||||||||||||||||||||||||||
| |||||||||||||||||||||||||||||||||||||


| |||||||||||||||||
| |||||||||||||||||
 County results Baucus: 50–60% 60–70% 70–80% 80–90% Deitchler: 40–50% | |||||||||||||||||
| |||||||||||||||||

| |||||||||||||||||||||
| |||||||||||||||||||||
 County results Simpson: 50–60% 50–60% 60–70% 70–80% | |||||||||||||||||||||
| |||||||||||||||||||||

| |||||||||||||||||
| |||||||||||||||||
 County results Craig: 50–60% 60–70% 70–80% Church: 50–60% | |||||||||||||||||
| |||||||||||||||||
.jpg)
| |||||||||||||||||
| |||||||||||||||||
 County results Hatfield: 40-50% 50-60% 60-70% AuCoin: 40–50% 50–60% | |||||||||||||||||
| |||||||||||||||||
.jpg)

| |||||||||||||||||||||
| |||||||||||||||||||||
 County results Lott: 40–50% 50–60% 60–70% Hinson: 40–50% 50–60% 60–70% Walls: 30–40% 40–50% 50–60% | |||||||||||||||||||||
| |||||||||||||||||||||


Earth First | |
|---|---|
 | |
| Founded | 1987 |
| Headquarters | 2300 S Massachusetts St, Seattle, Washington 98144 |
| Membership (November 1989) | |
| Ideology | Enviromentalism Eco-Socialism Anti-Tech Anarchism Eco-Populism |
| Political position | far-left Anarchist |
| Colors | Green, Blue |
| Seats in the Senate[b] | 0 / 100
|
| Seats in the House[b] | 0 / 435
|
| Governorships[b] | 1 / 50
|
| State Upper House Seats[b] | 2 / 1,972
|
| State Lower House Seats[b] | 1 / 5,411
|
| Seattle City Council | 1 / 9
|
| |||||||||||||||||||||||||||||||||||||||||||
| Turnout | 75.00% | ||||||||||||||||||||||||||||||||||||||||||
|---|---|---|---|---|---|---|---|---|---|---|---|---|---|---|---|---|---|---|---|---|---|---|---|---|---|---|---|---|---|---|---|---|---|---|---|---|---|---|---|---|---|---|---|
| |||||||||||||||||||||||||||||||||||||||||||
 County results Kaczynski: 30–40% 40–50% 50–60% Anderson: 30–40% 40–50% 50–60% Stephans: 40–50% 50-60% | |||||||||||||||||||||||||||||||||||||||||||
| |||||||||||||||||||||||||||||||||||||||||||

| ||
|---|---|---|
|
Early Life
Pre-vice presidency 44th Vice President of the United States 41st President of the United States
Policies
Appointments
Tenure
Presidential campaigns Post-presidency
 |
||
| |||||||||||||||||||||||||||||||||||||||||||||||||||||||||||||||||||||||||||
Needed to win: Majority of votes cast Final (tenth) ballot: 435 votes cast, 218 needed for a majority | |||||||||||||||||||||||||||||||||||||||||||||||||||||||||||||||||||||||||||
|---|---|---|---|---|---|---|---|---|---|---|---|---|---|---|---|---|---|---|---|---|---|---|---|---|---|---|---|---|---|---|---|---|---|---|---|---|---|---|---|---|---|---|---|---|---|---|---|---|---|---|---|---|---|---|---|---|---|---|---|---|---|---|---|---|---|---|---|---|---|---|---|---|---|---|---|
| |||||||||||||||||||||||||||||||||||||||||||||||||||||||||||||||||||||||||||
| |||||||||||||||||||||||||||||||||||||||||||||||||||||||||||||||||||||||||||
.jpg)


| |||||||||||||||||||||||||||||||||||||||||||||||||||||||||||||||||||||||||||||||||||||||||
33 of the 100 seats in the United States Senate 51 seats needed for a majority | |||||||||||||||||||||||||||||||||||||||||||||||||||||||||||||||||||||||||||||||||||||||||
|---|---|---|---|---|---|---|---|---|---|---|---|---|---|---|---|---|---|---|---|---|---|---|---|---|---|---|---|---|---|---|---|---|---|---|---|---|---|---|---|---|---|---|---|---|---|---|---|---|---|---|---|---|---|---|---|---|---|---|---|---|---|---|---|---|---|---|---|---|---|---|---|---|---|---|---|---|---|---|---|---|---|---|---|---|---|---|---|---|---|
| |||||||||||||||||||||||||||||||||||||||||||||||||||||||||||||||||||||||||||||||||||||||||
 Results of the elections: Democratic gain Democratic hold Republican gain Republican hold Conservative gain Conservative hold New Democrat gain New Democrat hold Independent gain No election | |||||||||||||||||||||||||||||||||||||||||||||||||||||||||||||||||||||||||||||||||||||||||
| |||||||||||||||||||||||||||||||||||||||||||||||||||||||||||||||||||||||||||||||||||||||||


| |||||||||||||||||||||||||
| |||||||||||||||||||||||||
 County results Kunin: 40–50% 50–60% Smith: 40-50% | |||||||||||||||||||||||||
| |||||||||||||||||||||||||


| |||||||||||||||||||||||
| |||||||||||||||||||||||
 Parish Results
| |||||||||||||||||||||||
| |||||||||||||||||||||||
| Libyan War | ||||||||
|---|---|---|---|---|---|---|---|---|
| Part of the North African conflict and the War on terror | ||||||||
 Clockwise from top: US troops at Uday and Qusay Hussein's hideout; insurgents in northern Iraq; the toppling of the Saddam Hussein statue in Firdos Square | ||||||||
| ||||||||
| Belligerents | ||||||||
|
Invasion phase (1983) Supported by: |
Invasion phase (1983) |
Invasion phase (1983) Supported by: | ||||||
|
Post-invasion
|
Post-invasion (2003–11)
Supported by: | |||||||
| Commanders and leaders | ||||||||
|
| |||||||
| Strength | ||||||||
|
Invasion forces (2003) 176,000 at peak United States Forces – Iraq (2010–11) 112,000 at activation Security contractors 6,000–7,000 (estimate)[17] Iraqi security forces 805,269 (military and paramilitary: 578,269,[18][page needed] police: 227,000) ≈103,000 (2008)[19] Iraqi Kurdistan ≈400,000 (Kurdish Border Guard: 30,000,[20] Peshmerga 75,000) |
Sunni Insurgents ≈1,000 (2008) Army of the Men of the Naqshbandi Order ≈500–1,000 (2007) | |||||||
| Casualties and losses | ||||||||
|
Iraqi security forces (post-Saddam) Total wounded: 117,961 |
Iraqi combatant dead (invasion period): 7,600–45,000[41][42] Insurgents (post-Saddam) Killed: 26,544+ (2003–11)[43] (4,000 foreign fighters killed by Sep. 2006)[44] Detainees: 12,000 (Iraqi-held, in 2010 only)[45] 119,752 insurgents arrested (2003–2007)[46] Total dead: 34,144–71,544 |
| ||||||
|
* "injured, diseased, or other medical": required medical air transport. UK number includes "aeromed evacuations". ** Total excess deaths include all additional deaths due to increased lawlessness, degraded infrastructure, poorer healthcare, etc. *** Violent deaths only – does not include excess deaths due to increased lawlessness, poorer healthcare, etc. | ||||||||
| Somalian War | |||||||||
|---|---|---|---|---|---|---|---|---|---|
| Part of the War on Terror | |||||||||
| |||||||||
| |||||||||
| Belligerents | |||||||||
| Commanders and leaders | |||||||||
| Strength | |||||||||
|
≈860,000 (1967) |
≈1,420,000 (1968)
| ||||||||
| Casualties and losses | |||||||||
Total military dead/missing: |
333,620 (1960–1974) – 392,364 (total) Total military wounded: ≈1,340,000+[78] (excluding FARK and FANK) Total military captured: ≈1,000,000+ | ||||||||
| |||||||||
.jpg)


_in_the_South_China_Sea_on_12_August_1964_(USN_1107965).jpg)

- ^ "National General Election VEP Turnout Rates, 1789-Present". United States Election Project. CQ Press.
- ^ Bemis, Samuel Flagg (1965). A Diplomatic History of the United States. Holt, Rinehart and Winston. p. 8.
- ^ Newman, Gerald; Brown, Leslie Ellen (13 November 1997). Britain in the Hanoverian Age, 1714-1837: An Encyclopedia. Taylor & Francis. ISBN 9780815303961.
All in all, the war cost Britain 20,000 casualties and 407 ships, primarily merchantmen, in exchange for little commercial or strategic gain.
- ^ "National General Election VEP Turnout Rates, 1789-Present". United States Election Project. CQ Press.
- ^ Dr. Michael McDonald (March 25, 2013). "Turnout 1980-2012". George Mason University. Archived from the original on October 30, 2012. Retrieved April 3, 2013.
- ^ U. S. Senator
- ^ "Montana Voter Turnout". Montana Secretary of State. Retrieved 2022-05-26.
- ^ Elaheh Rostami-Povey, Iran's Influence: A Religious-Political State and Society in Its Region, pp. 130–154, Zed Books Ltd, 2010.
- ^ "Iranian Strategy in Iraq: Politics and 'Other Means'" (PDF). Archived from the original (PDF) on 5 March 2016. Retrieved 12 January 2016.
- ^ President Barack Obama Speaks With VICE News. YouTube. 16 March 2015. Archived from the original on 2021-12-14.
- ^ "Operations By Iran's Military Mastermind – Business Insider". Business Insider. 9 July 2014.
- ^ "The JRTN Movement and Iraq's Next Insurgency | Combating Terrorism Center at West Point". Ctc.usma.edu. Archived from the original on 26 August 2011. Retrieved 2 August 2014.
- ^ "Al-Qaeda's Resurgence in Iraq: A Threat to U.S. Interests". US Department of State. 5 February 2014. Retrieved 26 November 2010.
- ^ "Operations By Iran's Military Mastermind – Business Insider". Business Insider. 9 July 2014.
- ^ "A Timeline of Iraq War, Troop Levels". The Huffington Post.
- ^ https://sgp.fas.org/crs/mideast/RL31763.pdf
- ^ "Deputy Assistant Secretary for International Programs Charlene Lamb's Remarks on Private Contractors in Iraq". US Department of State. 17 July 2009. Retrieved 23 October 2010.
- ^ International Institute for Strategic Studies (3 February 2010). Hackett, James (ed.). The Military Balance 2010. London: Routledge. ISBN 978-1-85743-557-3.
- ^ Rubin, Alissa J.; Nordland, Rod (29 March 2009). "Troops Arrest an Awakening Council Leader in Iraq, Setting Off Fighting". The New York Times. Retrieved 30 March 2010.
- ^ "The Kurdish peshmerga forces will not be integrated into the Iraqi army: Mahmoud Sangawi — Interview". Ekurd.net. 22 January 2010. Archived from the original on 2 April 2019. Retrieved 23 October 2010.
- ^ The Brookings Institution Iraq Index: Tracking Variables of Reconstruction & Security in Post-Saddam Iraq Archived 2 October 2007 at the Wayback Machine 1 October 2007
- ^ Pincus, Walter. "Violence in Iraq Called Increasingly Complex". The Washington Post, 17 November 2006.
- ^ 260 killed in 2003,[1] 15,196 killed from 2004 through 2009 (with the exceptions of May 2004 and March 2009),[2] 67 killed in March 2009,[3] 1,100 killed in 2010,[4] and 1,067 killed in 2011,[5] thus giving a total of 17,690 dead
- ^ "Iraq War" (PDF). US Department of State. Retrieved 18 November 2012.
- ^ The US DoD and the DMDC list 4,505 US fatalities during the Iraq War.[6][7] In addition to these, two service members were also previously confirmed by the DoD to have died while supporting operations in Iraq,[8][9] but have been excluded from the DoD and DMDC list. This brings the total of US fatalities in the Iraq War to 4,507.
- ^ "Fact Sheets | Operations Factsheets | Operations in Iraq: British Fatalities". Ministry of Defence of the United Kingdom. Archived from the original on 11 October 2009. Retrieved 17 October 2009.
- ^ "Operation Iraqi Freedom". iCasualties. Archived from the original on 21 March 2011. Retrieved 24 August 2010.
- ^ "POW and MIA in Iraq and Afghanistan Fast Facts". CNN. Retrieved 5 June 2014.; As of July 2012, seven American private contractors remain unaccounted for. Their names are: Jeffrey Ake, Aban Elias, Abbas Kareem Naama, Neenus Khoshaba, Bob Hamze, Dean Sadek and Hussain al-Zurufi. Healy, Jack, "With Withdrawal Looming, Trails Grow Cold For Americans Missing In Iraq", The New York Times, 22 May 2011, p. 6.
- ^ "Casualty" (PDF). Retrieved 29 June 2016.
- ^ 33 Ukrainians,[10] 31+ Italians,[11][12] 30 Bulgarians,[13][14] 20 Salvadorans,[15] 19 Georgians,[16] Archived 13 May 2011 at the Wayback Machine 18 Estonians,[17] 1421+ Poles,[18][19][20] 15 Spaniards,[21][22] Archived 2 April 2019 at the Wayback Machine [23][24] 10 Romanians,[25] 6 Australians,[26] 5 Albanians, 4 Kazakhs,[27] 3 Filipinos,[28] and 2 Thais,[29][30] for a total of 210+ wounded
- ^ a b Many official US tables at "Military Casualty Information" Archived 3 March 2011 at the Wayback Machine. See latest totals for injury, disease/other medical Archived 2 June 2011 at the Wayback Machine
- ^ "Casualties in Iraq".
- ^ a b iCasualties.org (was lunaville.org). Benicia, California. Patricia Kneisler, et al., "Iraq Coalition Casualties" Archived 21 March 2011 at the Wayback Machine
- ^ a b "Defence Internet Fact Sheets Operations in Iraq: British Casualties" Archived 14 November 2006 at the Wayback Machine. UK Ministry of Defense. Latest combined casualty and fatality tables Archived 4 October 2012 at the Wayback Machine.
- ^ "Archived copy" (PDF). Archived from the original (PDF) on 2 June 2011. Retrieved 7 February 2016.
{{cite web}}: CS1 maint: archived copy as title (link) - ^ a b "Office of Workers' Compensation Programs (OWCP) – Defense Base Act Case Summary by Nation". US Department of Labor. Retrieved 15 December 2011.
- ^ a b T. Christian Miller (23 September 2009). "US Government Private Contract Worker Deaths and Injuries". Projects.propublica.org. Archived from the original on 27 July 2011. Retrieved 23 October 2010.
- ^ 185 in Diyala from June 2007 to December 2007,[31] 4 in assassination of Abu Risha, 25 on 12 November 2007,[32] Archived 14 May 2013 at the Wayback Machine 528 in 2008,[33] Archived 10 December 2016 at the Wayback Machine 27 on 2 January 2009,[34] 13 on 16 November 2009,"Thirteen anti-Qaeda tribe members killed in Iraq - FRANCE 24". Archived from the original on 29 April 2011. Retrieved 14 February 2011. 15 in December 2009,[35] 100+ from April to June 2010,[36] [37] 52 on 18 July 2010,[38] [39] total of 1,002+ dead Archived 18 April 2009 at the Wayback Machine
- ^ Moore, Solomon; Oppel, Richard A. (24 January 2008). "Attacks Imperil U.S.-Backed Militias in Iraq". The New York Times.
- ^ Greg Bruno. "Finding a Place for the 'Sons of Iraq'". Council on Foreign Relations. Archived from the original on 10 December 2016. Retrieved 26 December 2011.
- ^ Conetta, Carl (23 October 2003). "The Wages of War: Iraqi Combatant and Noncombatant Fatalities in the 2003 Conflict — Project on Defense Alternative Research Monograph #8". Project on Defense Alternatives (via Commonwealth Institute). Retrieved 2 September 2010.
- ^ "Jonathan Steele: Body counts". TheGuardian.com. 28 May 2003.
- ^ 597 killed in 2003,[40], 23,984 killed from 2004 through 2009 (with the exceptions of May 2004 and March 2009),[41] 652 killed in May 2004,[42] 45 killed in March 2009,[43] Archived 3 September 2009 at the Wayback Machine 676 killed in 2010,[44] and 590 killed in 2011,[45] thus giving a total of 26,544 dead
- ^ "4,000 fighters killed, 'al-Qaida in Iraq' tape says." The Guardian. 28 September 2006.
- ^ "Amnesty: Iraq holds up to 30,000 detainees without trial". CNN. 13 September 2010. Archived from the original on 23 October 2010. Retrieved 6 January 2011.
- ^ "Insurgent body count documents released." Archived 27 July 2020 at the Wayback Machine Stars and Stripes. 1 October 2007. Number of convictions not specified.
- ^ "Iraq Body Count". Retrieved 27 April 2014.
- ^ "Iraq War Logs: What the numbers reveal". Iraq Body Count. Retrieved 3 December 2010.
- ^ Kim Gamel (23 April 2009). "AP Impact: Secret tally has 87,215 Iraqis dead". Fox News. Retrieved 26 April 2014.
- ^ "Mortality after the 2003 invasion of Iraq: a cross-sectional cluster sample survey" (PDF). Archived from the original (PDF) on 7 September 2015. (242 KB). By Gilbert Burnham, Riyadh Lafta, Shannon Doocy, and Les Roberts. The Lancet, 11 October 2006
- ^ "The Human Cost of the War in Iraq: A Mortality Study, 2002–2006" (PDF). (603 KB). By Gilbert Burnham, Shannon Doocy, Elizabeth Dzeng, Riyadh Lafta, and Les Roberts. A supplement to the October 2006 Lancet study. It is also found here: "Archived copy" (PDF). Archived from the original (PDF) on 28 November 2007. Retrieved 9 May 2012.
{{cite web}}: CS1 maint: archived copy as title (link) [46] - ^ "Iraq Family Health Survey" New England Journal of Medicine 31 January 2008
- ^ "Greenspan admits Iraq was about oil, as deaths put at 1.2m". the Guardian. 16 September 2007. Retrieved 12 July 2020.
- ^ Cite error: The named reference
Hagopianwas invoked but never defined (see the help page). - ^ Hupchick, Dennis P. (2002). The Balkans : from Constantinople to communism. New York: Palgrave. ISBN 978-0-312-29913-2. OCLC 54360177.
- ^ Logevall, Fredrik (1993). "The Swedish-American Conflict over Vietnam". Diplomatic History. 17 (3): 421–445. doi:10.1111/j.1467-7709.1993.tb00589.x. JSTOR 24912244. Retrieved 29 July 2021.
- ^ Moise, Edwin E. (1996). Tonkin Gulf and the Escalation of the Vietnam War. Univ of North Carolina Press. pp. 3–4. ISBN 978-0-8078-2300-2.
- ^ "Chapter Three: 1957–1969 Early Relations between Malaysia and Vietnam" (PDF). University of Malaya Student Repository. p. 72. Retrieved 17 October 2015.
- ^ Tunku Abdul Rahman Putra Al-Haj (Profiles of Malaysia's Foreign Ministers) (PDF). Institute of Diplomacy and Foreign Relations (IDFR), Ministry of Foreign Affairs (Malaysia). 2008. p. 31. ISBN 978-983-2220-26-8. Archived from the original (PDF) on 16 October 2015. Retrieved 17 October 2015.
The Tunku had been personally responsible for Malaya's partisan support of the South Vietnamese regime in its fight against the Vietcong and, in reply to a Parliamentary question on 6 February 1962, he had listed all the used weapons and equipment of the Royal Malaya Police given to Saigon. These included a total of 45,707 single-barrel shotguns, 611 armoured cars and smaller numbers of carbines and pistols. Writing in 1975, he revealed that "we had clandestinely been giving 'aid' to Vietnam since early 1958. Published American archival sources now reveal that the actual Malaysian contributions to the war effort in Vietnam included the following: "over 5,000 Vietnamese officers trained in Malaysia; training of 150 U.S. soldiers in handling Tracker Dogs; a rather impressive list of military equipment and weapons given to Viet-Nam after the end of the Malaysian insurgency (for example, 641 armored personnel carriers, 56,000 shotguns); and a creditable amount of civil assistance (transportation equipment, cholera vaccine, and flood relief)". It is undeniable that the Government's policy of supporting the South Vietnamese regime with arms, equipment and training was regarded by some quarters, especially the Opposition parties, as a form of interfering in the internal affairs of that country and the Tunku's valiant efforts to defend it were not convincing enough, from a purely foreign policy standpoint.
- ^ Guan, Ang Cheng (29 April 2009). "Singapore and the Vietnam war". Journal of Southeast Asian Studies. 40 (2): 353–384. doi:10.1017/S0022463409000186. S2CID 161788670. Retrieved 23 April 2022.
- ^ McKenna, Peter (2 September 2021). "Reconsidering Canada's role in Vietnam". Winnipeg Free Press. Winnipeg. Retrieved 23 April 2022.
- ^ Boyko, John (9 April 2021). "Canada is making the same mistakes in Yemen that it did in Vietnam". The Globe and Mail. Toronto. Retrieved 23 April 2022.
- ^ Young, J. W. (2002). "Britain and 'LBJ's War', 1964-68". Cold War History. 2 (3): 63–92. doi:10.1080/713999965. S2CID 153635200. Retrieved 12 May 2022.
- ^ Varsori, A. (2003). "Britain and US Involvement in the Vietnam War during the Kennedy Administration, 1961-63". Cold War History. 3 (2): 83–112. doi:10.1080/713999980. S2CID 153891042. Retrieved 13 May 2022.
- ^ Blang, Eugenie M. (May 2004). "A Reappraisal of Germany's Vietnam Policy, 1963-1966: Ludwig Erhard's Response to America's War in Vietnam". German Studies Review. 27 (2): 341–360. doi:10.2307/1433086. JSTOR 1433086. Retrieved 23 April 2022.
- ^ Daum, Andreas W.; Gardner, Lloyd C.; Mausbach, Wilfried (14 July 2013). America, the Vietnam War, and the World: Comparative and International Perspectives. Cambridge: Cambridge University Press. pp. 259–278. ISBN 978-0521008761.
- ^ "Name of Technical Sergeant Richard B. Fitzgibbon to be added to the Vietnam Veterans Memorial". Department of Defense (DoD). Archived from the original on 20 October 2013.
- ^ a b Lawrence, A.T. (2009). Crucible Vietnam: Memoir of an Infantry Lieutenant. McFarland. ISBN 978-0-7864-4517-2.
- ^ Olson & Roberts 2008, p. 67.
- ^ "Chapter 5, Origins of the Insurgency in South Vietnam, 1954–1960". The Pentagon Papers (Gravel Edition), Volume 1. Boston: Beacon Press. 1971. Section 3, pp. 314–346. Archived from the original on 19 October 2017. Retrieved 17 August 2008 – via International Relations Department, Mount Holyoke College.
- ^ The Paris Agreement on Vietnam: Twenty-five Years Later (Conference Transcript). Washington, DC: The Nixon Center. April 1998. Archived from the original on 1 September 2019. Retrieved 5 September 2012 – via International Relations Department, Mount Holyoke College.
- ^ Military History Institute of Vietnam 2002, p. 182. "By the end of 1966 the total strength of our armed forces was 690,000 soldiers."
- ^ Doyle, Edward; Lipsman, Samuel; Maitland, Terence (1986). The Vietnam Experience The North. Time Life Education. pp. 45–9. ISBN 978-0-939526-21-5.
- ^ a b Moïse, Edwin (2005). The A to Z of the Vietnam War. The Scarecrow Press. p. 11. ISBN 978-1-4617-1903-8.
- ^ "China admits 320,000 troops fought in Vietnam". Toledo Blade. Reuters. 16 May 1989. Retrieved 24 December 2013.
- ^ Roy, Denny (1998). China's Foreign Relations. Rowman & Littlefield. p. 27. ISBN 978-0-8476-9013-8.
- ^ a b Womack, Brantly (2006). China and Vietnam. p. 179. ISBN 978-0-521-61834-2.
- ^ a b c d e f Tucker, Spencer C (2011). The Encyclopedia of the Vietnam War: A Political, Social, and Military History. ABC-CLIO. ISBN 978-1-85109-960-3.
- ^ "Area Handbook Series Laos". Retrieved 1 November 2019.
- ^ O'Ballance, Edgar (1982). Tracks of the bear: Soviet imprints in the seventies. Presidio. p. 171. ISBN 978-0-89141-133-8.
- ^ Pham Thi Thu Thuy (1 August 2013). "The colorful history of North Korea-Vietnam relations". NK News. Retrieved 3 October 2016.
- ^ "After training in the secret bases in Dragot e Tale of Lezha, we, the 12 scouts, went to Vietnam, where for a year we fou". Memorie.al. 2022-09-07. Retrieved 2023-01-02.
- ^ Le Gro, William (1985). Vietnam from ceasefire to capitulation (PDF). US Army Center of Military History. p. 28. ISBN 978-1-4102-2542-9.
- ^ "The rise of Communism". www.footprinttravelguides.com. Archived from the original on 17 November 2010. Retrieved 31 May 2018.
- ^ "Hmong rebellion in Laos". Members.ozemail.com.au. Retrieved 11 April 2021.
- ^ "Vietnam War Allied Troop Levels 1960–73". Archived from the original on 2 August 2016. Retrieved 2 August 2016., accessed 7 November 2017
- ^ Doyle, Jeff; Grey, Jeffrey; Pierce, Peter (2002). "Australia's Vietnam War – A Select Chronology of Australian Involvement in the Vietnam War" (PDF). Texas A&M University Press.
- ^ a b c d e Hirschman, Charles; Preston, Samuel; Vu, Manh Loi (December 1995). "Vietnamese Casualties During the American War: A New Estimate" (PDF). Population and Development Review. 21 (4): 783. doi:10.2307/2137774. JSTOR 2137774.
- ^ a b c d e Lewy, Guenter (1978). America in Vietnam. Oxford University Press. ISBN 978-0-19-987423-1.
- ^ "Battlefield:Vietnam – Timeline". PBS.
- ^ a b Moyar, Mark. "Triumph Regained: The Vietnam War, 1965-1968." Encounter Books, December 2022. Chapter 17 index: "Communists provided further corroboration of the proximity of their casualty figures to American figures in a postwar disclosure of total losses from 1960 to 1975. During that period, they stated, they lost 849,018 killed plus approximately 232,000 missing and 463,000 wounded. Casualties fluctuated considerably from year to year, but a degree of accuracy can be inferred from the fact that 500,000 was 59 percent of the 849,018 total and that 59 percent of the war's days had passed by the time of Fallaci's conversation with Giap. The killed in action figure comes from "Special Subject 4: The Work of Locating and Recovering the Remains of Martyrs From Now Until 2020 And Later Years," downloaded from the Vietnamese government website datafile on 1 December 2017. The above figures on missing and wounded were calculated using Hanoi's declared casualty ratios for the period of 1945 to 1979, during which time the Communists incurred 1.1 million killed, 300,000 missing, and 600,000 wounded. Ho Khang, ed, Lich Su Khang Chien Chong My, Cuu Nuoc 1954-1975, Tap VIII: Toan Thang (Hanoi: Nha Xuat Ban Chinh Tri Quoc Gia, 2008), 463."
- ^ "Chuyên đề 4 CÔNG TÁC TÌM KIẾM, QUY TẬP HÀI CỐT LIỆT SĨ TỪ NAY ĐẾN NĂM 2020 VÀ NHỮNG NĂM TIẾP THEO". Datafile.chinhsachquandoi.gov.vn. Retrieved 11 April 2021.
- ^ "Công tác tìm kiếm, quy tập hài cốt liệt sĩ từ nay đến năm 2020 và những năn tiếp theo" [The work of searching and collecting the remains of martyrs from now to 2020 and the next] (in Vietnamese). Ministry of Defence, Government of Vietnam. Archived from the original on 17 December 2018. Retrieved 11 June 2018.
- ^ Joseph Babcock (29 April 2019). "Lost Souls: The Search for Vietnam's 300,000 or More MIAs". Pulitzer Centre. Retrieved 28 June 2021.
- ^ Hastings, Max (2018). Vietnam an epic tragedy, 1945–1975. Harper Collins. ISBN 978-0-06-240567-8.
- ^ James F. Dunnigan; Albert A. Nofi (2000). Dirty Little Secrets of the Vietnam War: Military Information You're Not Supposed to Know. Macmillan. ISBN 978-0-312-25282-3.
- ^ "North Korea fought in Vietnam War". BBC News Online. 31 March 2000. Retrieved 18 October 2015.
- ^ Pribbenow, Merle (November 2011). "North Korean Pilots in the Skies over Vietnam" (PDF). Woodrow Wilson International Center for Scholars. p. 1. Retrieved 3 March 2023.
- ^ Thayer, Thomas C. (1985). War Without Fronts: The American Experience in Vietnam. Westview Press. ISBN 978-0-8133-7132-0.
- ^ Clarke, Jeffrey J. (1988). United States Army in Vietnam: Advice and Support: The Final Years, 1965–1973. Center of Military History, United States Army.
The Army of the Republic of Vietnam suffered 254,256 recorded combat deaths between 1960 and 1974, with the highest number of recorded deaths being in 1972, with 39,587 combat deaths
- ^ Rummel, R.J (1997), "Table 6.1A. Vietnam Democide : Estimates, Sources, and Calculations" (GIF), Freedom, Democracy, Peace; Power, Democide, and War, University of Hawaii System
- ^ "The Fall of South Vietnam" (PDF). Rand.org. Retrieved 11 April 2021.
- ^ Vietnam Veterans Memorial Fund (4 May 2021). "2021 NAME ADDITIONS AND STATUS CHANGES ON THE VIETNAM VETERANS MEMORIAL" (Press release).
- ^ National Archives–Vietnam War U.S. Military Fatal Casualties, 15 August 2016, retrieved 29 July 2020
- ^ "Vietnam War U.S. Military Fatal Casualty Statistics: HOSTILE OR NON-HOSTILE DEATH INDICATOR." U.S. National Archives. 29 April 2008. Accessed 13 July 2019.
- ^ America's Wars (PDF) (Report). Department of Veterans Affairs. May 2010. Archived from the original (PDF) on 24 January 2014.
- ^ Anne Leland; Mari–Jana "M-J" Oboroceanu (26 February 2010). American War and Military Operations: Casualties: Lists and Statistics (PDF) (Report). Congressional Research Service.
- ^ Aaron Ulrich (editor); Edward FeuerHerd (producer and director) (2005, 2006). Heart of Darkness: The Vietnam War Chronicles 1945–1975 (Box set, Color, Dolby, DVD-Video, Full Screen, NTSC, Dolby, Vision Software) (Documentary). Koch Vision. Event occurs at 321 minutes. ISBN 1-4172-2920-9.
- ^ Kueter, Dale (2007). Vietnam Sons: For Some, the War Never Ended. AuthorHouse. ISBN 978-1-4259-6931-8.
- ^ T. Lomperis, From People's War to People's Rule (1996)
- ^ "Australian casualties in the Vietnam War, 1962–72". Australian War Memorial. Retrieved 29 June 2013.
- ^ "Overview of the war in Vietnam". New Zealand and the Vietnam War. 16 July 1965. Archived from the original on 26 July 2013. Retrieved 29 June 2013.
- ^ "America Wasn't the Only Foreign Power in the Vietnam War". 2 October 2013. Retrieved 10 June 2017.
- ^ "Vietnam Reds Said to Hold 17 From Taiwan as Spies". The New York Times. 1964.
- ^ Larsen, Stanley (1975). Vietnam Studies Allied Participation in Vietnam (PDF). Department of the Army. ISBN 978-1-5176-2724-9.
- ^ "Asian Allies in Vietnam" (PDF). Embassy of South Vietnam. March 1970. Retrieved 18 October 2015.
- ^ Shenon, Philip (23 April 1995). "20 Years After Victory, Vietnamese Communists Ponder How to Celebrate". The New York Times. Retrieved 24 February 2011.
The Vietnamese government officially claimed a rough estimate of 2 million civilian deaths, but it did not divide these deaths between those of North and South Vietnam.
- ^ a b c Obermeyer, Ziad; Murray, Christopher J L; Gakidou, Emmanuela (23 April 2008). "Fifty years of violent war deaths from Vietnam to Bosnia: analysis of data from the world health survey programme". British Medical Journal. 336 (7659): 1482–1486. doi:10.1136/bmj.a137. PMC 2440905. PMID 18566045.
From 1955 to 2002, data from the surveys indicated an estimated 5.4 million violent war deaths ... 3.8 million in Vietnam
- ^ Heuveline, Patrick (2001). "The Demographic Analysis of Mortality Crises: The Case of Cambodia, 1970–1979". Forced Migration and Mortality. National Academies Press. pp. 102–104, 120, 124. ISBN 978-0-309-07334-9.
As best as can now be estimated, over two million Cambodians died during the 1970s because of the political events of the decade, the vast majority of them during the mere four years of the 'Khmer Rouge' regime. ... Subsequent reevaluations of the demographic data situated the death toll for the [civil war] in the order of 300,000 or less.
- ^ Banister, Judith; Johnson, E. Paige (1993). Genocide and Democracy in Cambodia: The Khmer Rouge, the United Nations and the International Community. Yale University Southeast Asia Studies. p. 97. ISBN 978-0-938692-49-2.
An estimated 275,000 excess deaths. We have modeled the highest mortality that we can justify for the early 1970s.
- ^ Sliwinski, Marek (1995). Le Génocide Khmer Rouge: Une Analyse Démographique [The Khmer Rouge genocide: A demographic analysis]. L'Harmattan. pp. 42–43, 48. ISBN 978-2-7384-3525-5.
- ^ Nixon's official state of residence was New York because he moved there to practice law after his defeat in the 1962 California gubernatorial election. During his first term as president, Nixon re-established his residency in California. Consequently, most reliable reference books, including the January 6, 1969, edition of the Congressional Record, list his home state as New York.
- ^ a b c d e Includes members of the Democratic Party in New York elected on the WFP ballot line via electoral fusion.
- ^ disbanded in 2003
Cite error: There are <ref group=A> tags on this page, but the references will not show without a {{reflist|group=A}} template (see the help page).