Particulates or atmospheric particulate matter (see below for other names) are microscopic particles of solid or liquid matter suspended in the air. The term aerosol commonly refers to the particulate/air mixture, as opposed to the particulate matter alone.[1] Sources of particulate matter can be natural or anthropogenic.[2] They have impacts on climate and precipitation that adversely affect human health, in ways additional to direct inhalation.

Types of atmospheric particles include suspended particulate matter; thoracic and respirable particles;[3] inhalable coarse particles, designated PM10, which are coarse particles with a diameter of 10 micrometers (μm) or less; fine particles, designated PM2.5, with a diameter of 2.5 μm or less;[4] ultrafine particles, with a diameter of 100 nm or less; and soot.
Airborne particulate matter is a Group 1 carcinogen.[5] Particulates are the most harmful form (other than ultra-fines) of air pollution[6] as they can penetrate deep into the lungs and brain from blood streams, causing health problems such as heart disease, lung disease, and premature death.[7] There is no safe level of particulates. A 2013 study concluded that "particulate matter air pollution contributes to lung cancer incidence in Europe".[8] Worldwide, exposure to PM2.5 contributed to 4.1 million deaths from heart disease, stroke, lung cancer, chronic lung disease, and respiratory infections in 2016.[9] Overall, ambient particulate matter is one of the leading risk factor for premature death globally.[10]
Sources edit

Human activities generate significant amounts of particulates. For example:
- Burning of fossil fuels (e.g., aircraft),[11][12][13] joss paper,[14][15][16] waste,[17] firecrackers[18] and biomass including wood[19] and crop residue.
- Construction[20][21][22][23] (activities of building rehabilitation/ refurbishment or demolition, renovation,[24] roadworks, diesel exhausts of the heavy equipments used, emission from the production of building materials,[25][26][27][28] etc.).
- Dusty materials that are not cleaned up or properly covered (e.g., in construction sites, landfills and ceramics production facilities; ashes left from burning).[29][30][31]
- Metalworking (e.g., welding).[32]
- Woodworking.[33][34]
- Glass reprocessing.
- Industries.[4]
- Agricultural activities (e.g., ploughing and soil tilling).[35]
- Power plants.[36]
- Waste incineration.[37][38]
- Road dust from tyre and road wear[39] and road dust from unpaved road.[40]
- Wet cooling towers in cooling systems.
- Various industrial processes such as mining,[41][42] smelting[43] and oil refining.[44]
- Disasters[45] (both natural or caused by humans, e.g., wildfires, earthquakes, wars,[46][47] and September 11 attacks, etc.).
- Microplastics (gaining attention as a type of airborne PM).[48][49]
Human-made (anthropogenic) aerosols account for about 10 percent of the total mass of aerosols in the atmosphere as estimated in 2010. The remaining 90 percent comes from natural sources such as volcanoes, dust storms, forest and grassland fires, living vegetation and sea spray, emitting particulates such as volcanic ash, desert dust, soot and sea salt.[50]
Domestic combustion and wood smoke edit
In the United Kingdom domestic combustion is the largest single source of PM2.5 and PM10 annually, with domestic wood burning in both closed stoves and open fires responsible for 38% of PM2.5 in 2019.[51][52][53] To tackle the problem some new laws were introduced since 2021. In some towns and cities in New South Wales wood smoke may be responsible for 60% of fine particle air pollution in the winter.[54]
There are a few ways to reduce wood smoke, e.g., buying the right wood heater and maintaining it well,[55] choosing the right firewood[56] and burning it the right way.[57] There are also regulations in some countries where people can report smoke pollution to the local council. [58]
Composition edit
Red/orange: desert (mineral) dust
Blue: sea salt
Green: smoke
White: sulfate particles[59][60]
The composition and toxicity of aerosols, including particles, depends on their source and atmospheric chemistry and varies widely. Wind-blown mineral dust[61] tends to be made of mineral oxides and other material blown from the Earth's crust; this particulate is light-absorbing.[62] Sea salt[63] is considered the second-largest contributor in the global aerosol budget, and consists mainly of sodium chloride originated from sea spray; other constituents of atmospheric sea salt reflect the composition of sea water, and thus include magnesium, sulfate, calcium, potassium, and others. In addition, sea spray aerosols may contain organic compounds like fatty acids and sugars, which influence their chemistry.[64]
Some secondary particles derive from the oxidation of primary gases such as sulfur and nitrogen oxides into sulfuric acid (liquid) and nitric acid (gaseous) or from biogenic emissions. The precursors for these aerosols—i.e. the gases from which they originate—may have an anthropogenic origin (from biomass and fossil fuel combustion) as well as a natural biogenic origin. In the presence of ammonia, secondary aerosols often take the form of ammonium salts; i.e. ammonium sulfate and ammonium nitrate (both can be dry or in aqueous solution); in the absence of ammonia, secondary compounds take an acidic form as sulfuric acid (liquid aerosol droplets) and nitric acid (atmospheric gas), all of which probably contribute to the health effects of particulates.[65]
Secondary sulfate and nitrate aerosols are strong light-scatterers.[66] This is mainly because the presence of sulfate and nitrate causes the aerosols to increase to a size that scatters light effectively.
Organic matter (OM) found in aerosols can be either primary or secondary, the latter part deriving from the oxidation of volatile organic compounds (VOCs); organic material in the atmosphere may either be biogenic or anthropogenic. Organic matter influences the atmospheric radiation field by both scattering and absorption. Some aerosols are predicted to include strongly light-absorbing material and are thought to yield large positive radiative forcing. Some secondary organic aerosols (SOAs) resulting from combustion products of internal combustion engines, have been identified as a danger to health.[67] Particulate toxicity has been found to vary by region and source contribution which affects the particles chemical composition.
The chemical composition of the aerosol directly affects how it interacts with solar radiation. The chemical constituents within the aerosol change the overall refractive index. The refractive index will determine how much light is scattered and absorbed.
The composition of particulate matter that generally causes visual effects, haze, consists of sulfur dioxide, nitrogen oxides, carbon monoxide, mineral dust, and organic matter. The particles are hygroscopic due to the presence of sulfur, and SO2 is converted to sulfate when high humidity and low temperatures are present. This causes reduced visibility and red-orange-yellow colors.[68]
Size distribution edit
Human-produced aerosols such as particle pollution tend to have a smaller radius than aerosol particles of natural origin (such as windblown dust). The false-color maps in the map of distribution of aerosol particles on the right show where there are natural aerosols, human pollution, or a mixture of both, monthly.
Smaller aerosols in the North edit
The size distribution time series shows that in the planet's most southerly latitudes, nearly all the aerosols are large, but in the high northern latitudes, smaller aerosols are very abundant. Most of the Southern Hemisphere is covered by the ocean, where the largest source of aerosols is natural sea salt from dried sea spray. Because the land is concentrated in the Northern Hemisphere, the amount of small aerosols from fires and human activities is greater there than in the Southern Hemisphere. Overland, patches of large-radius aerosols appear over deserts and arid regions, most prominently, the Sahara Desert in North Africa and the Arabian Peninsula, where dust storms are common. Places where human-triggered or natural fire activity is common (land-clearing fires in the Amazon from August–October, for example, or lightning-triggered fires in the forests of northern Canada in Northern Hemisphere summer) are dominated by smaller aerosols. Human-produced (fossil fuel) pollution is largely responsible for the areas of small aerosols over developed areas such as the eastern United States and Europe, especially in their summer.[69][better source needed]
Satellite measurements of aerosols, called aerosol optical thickness, are based on the fact that the particles change the way the atmosphere reflects and absorbs visible and infrared light. As shown in this page, an optical thickness of less than 0.1 (palest yellow) indicates a crystal clear sky with maximum visibility, whereas a value of 1 (reddish-brown) indicates very hazy conditions.[better source needed]
Deposition processes edit
In general, the smaller and lighter a particle is, the longer it will stay in the air. Larger particles (greater than 10 micrometers in diameter) tend to settle to the ground by gravity in a matter of hours. The smallest particles (less than 1 micrometer) can stay in the atmosphere for weeks and are mostly removed by precipitation. There are evidence that aerosols can "travel across the ocean". For example, in September 2017 wildfires burning across the western United States and Canada, and the smoke was found to have arrived over the United Kingdom and northern France in three days, as shown by satellite images.[70] Diesel particulate matter is highest near the source of emission.[71] Any information regarding DPM and the atmosphere, flora, height, and distance from major sources is useful to determine health effects.
Control edit
Technologies edit
Particulate matter emissions are highly regulated in most industrialized countries. Due to environmental concerns, most industries are required to operate some kind of dust collection system.[72] These systems include inertial collectors (cyclonic separators), fabric filter collectors (baghouses), electrostatic filters used in facemasks,[73] wet scrubbers, and electrostatic precipitators.
Cyclonic separators are useful for removing large, coarse particles and are often employed as a first step or "pre-cleaner" to other more efficient collectors. Well-designed cyclonic separators can be very efficient in removing even fine particulates,[74] and may be operated continuously without requiring frequent shutdowns for maintenance.[citation needed]
Fabric filters or baghouses are the most commonly employed in general industry.[75] They work by forcing dust-laden air through a bag-shaped fabric filter leaving the particulate to collect on the outer surface of the bag and allowing the now clean air to pass through to either be exhausted into the atmosphere or in some cases recirculated into the facility. Common fabrics include polyester and fiberglass and common fabric coatings include PTFE (commonly known as Teflon). The excess dust buildup is then cleaned from the bags and removed from the collector.
Wet scrubbers pass the dirty air through a scrubbing solution (usually a mixture of water and other compounds) allowing the particulate to attach to the liquid molecules.[84] Electrostatic precipitators electrically charge the dirty air as it passes through. The now charged air then passes through large electrostatic plates which attract the charged particle in the airstream collecting them and leaving the now clean air to be exhausted or recirculated.[85]
Measures edit
For general building construction, some places that have acknowledged the possible health risks of construction dust for decades legally require the relevant contractor to adopt effective dust control measures, although inspections, fines and imprisonments are rare in recent years (for example, two prosecutions with a total fines of HKD$6000 in Hong Kong in the year 2021).[86][87]
Some of the mandatory dust control measures include[88][83][89][90] load, unload, handle, transfer, store or dispose of cement or dry pulverized fuel ash in a completely enclosed system or facility, and fit any vent or exhaust with an effective fabric filter or equivalent air pollution control system or equipment, enclose the scaffolding of the building with dust screens, use impervious sheeting to enclose both material hoist and debris chute, wet debris with water before it is dumped into a debris chute, have water sprayed on the facade surface before and during grinding work, use grinder equipped with vacuum cleaner for facade grinding work, spray water continuously on the surface for any pneumatic or power-driven drilling, cutting, polishing or other mechanical breaking operation that causes dust emission, unless there is the operation of an effective dust extraction and filtering device, provide hoarding of not less than 2.4 m in height along the whole length of the site boundary, have hard paving on open area and wash every vehicle that leaves the construction sites. Use of automatic sprinkler equipment, automatic carwash equipment and installation of video surveillance system for the pollution control facilities and retain the videos for one month for future inspections.
Besides removing particulates from the source of pollution, they may also be cleaned in the open air (e.g. smog tower, moss wall, and water truck),[91] while other control measures employ the use of barriers.[92]
Measurement edit
Particulates have been measured in increasingly sophisticated ways since air pollution was first systematically studied in the early 20th century. The earliest methods included relatively crude Ringelmann charts, which were grey-shaded cards against which emissions from smokestacks could be visually compared, and deposit gauges, which collected the soot deposited in a particular location so it could be weighed. Automated, modern methods of measuring particulates include optical photodetectors, tapered element oscillating microbalances, and Aethalometers.[93] Besides measuring the total mass of particles per unit volume of air (particle mass concentration), sometimes it is more useful to measure the total number of particles per unit volume of air (particle number concentration). This can be done by using a condensation particle counter (CPC).[94][95]
To measure the atomic composition of particulate samples, techniques such as X-ray spectrometry can be used.[96]
Climate effects edit
_-_global_warming.svg)
Atmospheric aerosols affect the climate of the Earth by changing the amount of incoming solar radiation and outgoing terrestrial longwave radiation retained in the Earth's system. This occurs through several distinct mechanisms which are split into direct, indirect[98][99] and semi-direct aerosol effects. The aerosol climate effects are the biggest source of uncertainty in future climate predictions.[100] The Intergovernmental Panel on Climate Change (IPCC), Third Assessment Report, says:[101]
While the radiative forcing due to greenhouse gases may be determined to a reasonably high degree of accuracy... the uncertainties relating to aerosol radiative forcings remain large, and rely to a large extent on the estimates from global modeling studies that are difficult to verify at the present time.
Aerosol radiative edit

Direct edit

The direct aerosol effect consists of any direct interaction of radiation with atmospheric aerosols, such as absorption or scattering. It affects both short and longwave radiation to produce a net negative radiative forcing.[102] The magnitude of the resultant radiative forcing due to the direct effect of an aerosol is dependent on the albedo of the underlying surface, as this affects the net amount of radiation absorbed or scattered to space. For example, if a highly scattering aerosol is above a surface of low albedo it has a greater radiative forcing than if it was above a surface of high albedo. The converse is true of absorbing aerosol, with the greatest radiative forcing arising from a highly absorbing aerosol over a surface of high albedo.[98] The direct aerosol effect is a first-order effect and is therefore classified as a radiative forcing by the IPCC.[100] The interaction of an aerosol with radiation is quantified by the single-scattering albedo (SSA), the ratio of scattering alone to scattering plus absorption (extinction) of radiation by a particle. The SSA tends to unity if scattering dominates, with relatively little absorption, and decreases as absorption increases, becoming zero for infinite absorption. For example, the sea-salt aerosol has an SSA of 1, as a sea-salt particle only scatters, whereas soot has an SSA of 0.23, showing that it is a major atmospheric aerosol absorber.[citation needed]
Indirect edit
The Indirect aerosol effect consists of any change to the Earth's radiative budget due to the modification of clouds by atmospheric aerosols and consists of several distinct effects. Cloud droplets form onto pre-existing aerosol particles, known as cloud condensation nuclei (CCN). Droplets condensing around human-produced aerosols such as found in particulate pollution tend to be smaller and more numerous than those forming around aerosol particles of natural origin (such as windblown dust).[50]
For any given meteorological conditions, an increase in CCN leads to an increase in the number of cloud droplets. This leads to more scattering of shortwave radiation i.e. an increase in the albedo of the cloud, known as the cloud albedo effect, First indirect effect or Twomey effect.[99] Evidence supporting the cloud albedo effect has been observed from the effects of ship exhaust plumes[103] and biomass burning[104] on cloud albedo compared to ambient clouds. The Cloud albedo aerosol effect is a first order effect and therefore classified as a radiative forcing by the IPCC.[100]
An increase in cloud droplet number due to the introduction of aerosol acts to reduce the cloud droplet size, as the same amount of water is divided into more droplets. This has the effect of suppressing precipitation, increasing the cloud lifetime, known as the cloud lifetime aerosol effect, second indirect effect or Albrecht effect.[100] This has been observed as the suppression of drizzle in ship exhaust plume compared to ambient clouds,[105] and inhibited precipitation in biomass burning plumes.[106] This cloud lifetime effect is classified as a climate feedback (rather than a radiative forcing) by the IPCC due to the interdependence between it and the hydrological cycle.[100] However, it has previously been classified as a negative radiative forcing.[107]
Semi-direct edit
The Semi-direct effect concerns any radiative effect caused by absorbing atmospheric aerosol such as soot, apart from direct scattering and absorption, which is classified as the direct effect. It encompasses many individual mechanisms, and in general is more poorly defined and understood than the direct and indirect aerosol effects. For instance, if absorbing aerosols are present in a layer aloft in the atmosphere, they can heat surrounding air which inhibits the condensation of water vapour, resulting in less cloud formation.[108] Additionally, heating a layer of the atmosphere relative to the surface results in a more stable atmosphere due to the inhibition of atmospheric convection. This inhibits the convective uplift of moisture,[109] which in turn reduces cloud formation. The heating of the atmosphere aloft also leads to a cooling of the surface, resulting in less evaporation of surface water. The effects described here all lead to a reduction in cloud cover i.e. an increase in planetary albedo. The semi-direct effect classified as a climate feedback) by the IPCC due to the interdependence between it and the hydrological cycle.[100] However, it has previously been classified as a negative radiative forcing.[107]
Specific aerosol roles edit
Sulfate edit
Sulfate aerosols are mostly inorganic sulfur compounds like (SO42-),HSO4- and H2SO4-,[110] which are mainly produced when sulfur dioxide reacts with water vapor to form gaseous sulfuric acid and various salts (often through an oxidation reaction in the clouds), which are then thought to experience hygroscopic growth and coagulation and then shrink through evaporation.[111][112] Some of them are biogenic (typically produced via atmospheric chemical reactions with dimethyl sulfide from mostly marine plankton[113]) or geological via volcanoes or weather-driven from wildfires and other natural combustion events,[112] but in the recent decades anthropogenic sulfate aerosols produced through combustion of fossil fuels with a high sulfur content, primarily coal and certain less-refined fuels, like aviation and bunker fuel, had dominated.[114] By 1990, global human-caused emissions of sulfur into the atmosphere became "at least as large" as all natural emissions of sulfur-containing compounds combined, and were at least 10 times more numerous than the natural aerosols in the most polluted regions of Europe and North America,[115] where they accounted for 25% or more of all air pollution.[116] This led to acid rain,[117][118] and also contributed to heart and lung conditions [116] and even the risk of preterm birth and low birth weight.[119] Sulfate pollution also has a complex relationship with NOx pollution and ozone, reducing the also harmful ground-level ozone, yet capable of damaging the stratospheric ozone layer as well.[120]

Once the problem became clear, the efforts to remove this pollution through flue-gas desulfurization measures and other pollution controls were largely successful,[121] reducing their prevalence by 53% and causing healthcare savings valued at $50 billion annually in the United States alone.[122][116][123] Yet, around the same time, research had shown that sulfate aerosols were affecting both the visible light received by the Earth and its surface temperature,[124] and as the so-called global dimming) began to reverse in the 1990s in line with the reduced anthropogenic sulfate pollution,[125][126][127] climate change accelerated.[128] As of 2021, state-of-the-art CMIP6 models estimate that total cooling from the currently present aerosols is between 0.1 °C (0.18 °F) to 0.7 °C (1.3 °F);[129] the IPCC Sixth Assessment Report uses the best estimate of 0.5 °C (0.90 °F),[130] with the uncertainty mainly caused by contradictory research on the impacts of aerosols of clouds.[131][132][133][134][135][136] Some are certain that they cool the planet, though, and this led to solar geoengineering proposals known as stratospheric aerosol injection, which seeks to replicate and enhance the cooling from sulfate pollution while minimizing the negative effects on health through deploying in the stratosphere, where only a fraction of the current sulfur pollution would be needed to avoid multiple degrees of warming,[137] but the assessment of costs and benefits remains incomplete,[138] even with hundreds of studies into the subject completed by the early 2020s.[139]
Black carbon edit
Black carbon (BC), or carbon black, or elemental carbon (EC), often called soot, is composed of pure carbon clusters, skeleton balls and fullerenes, and is one of the most important absorbing aerosol species in the atmosphere. It should be distinguished from organic carbon (OC): clustered or aggregated organic molecules on their own or permeating an EC buckyball. Black carbon from fossil fuels is estimated by the IPCC in the Fourth Assessment Report of the IPCC, 4AR, to contribute a global mean radiative forcing of +0.2 W/m2 (was +0.1 W/m2 in the Second Assessment Report of the IPCC, SAR), with a range +0.1 to +0.4 W/m2. A study published in 2013 however, states that "the best estimate for the industrial-era (1750 to 2005) direct radiative forcing of atmospheric black carbon is +0.71 W/m2 with 90% uncertainty bounds of (+0.08, +1.27) W/m2" with "total direct forcing by all-black carbon sources, without subtracting the preindustrial background, is estimated as +0.88 (+0.17, +1.48) W/m2".[140]
Instances edit
Volcanoes are a large natural source of aerosol and have been linked to changes in the Earth's climate often with consequences for the human population. Eruptions linked to changes in climate include the 1600 eruption of Huaynaputina which was linked to the Russian famine of 1601–1603,[141][142][143] leading to the deaths of two million, and the 1991 eruption of Mount Pinatubo which caused a global cooling of approximately 0.5 °C lasting several years.[144][145] Research tracking the effect of light-scattering aerosols in the stratosphere during 2000 and 2010 and comparing its pattern to volcanic activity show a close correlation. Simulations of the effect of anthropogenic particles showed little influence at present levels.[146][147]
Aerosols are also thought to affect weather and climate on a regional scale. The failure of the Indian monsoon has been linked to the suppression of evaporation of water from the Indian Ocean due to the semi-direct effect of anthropogenic aerosol.[148]
Recent studies of the Sahel drought[149] and major increases since 1967 in rainfall in Australia over the Northern Territory, Kimberley, Pilbara and around the Nullarbor Plain have led some scientists to conclude that the aerosol haze over South and East Asia has been steadily shifting tropical rainfall in both hemispheres southward.[148][150]
Health effects edit

Size, shape, and solubility matter edit
Size edit
Particle size is the main determinant of where in the respiratory tract it will come to rest when inhaled. Larger particles are generally filtered in the nose and throat via cilia and mucus, but particulate matter smaller than about 10 micrometers can settle in the bronchi and lungs and cause health problems. The 10-micrometer size does not represent a strict boundary between respirable and non-respirable particles but has been agreed upon for monitoring of airborne PM by most regulatory agencies. Because of their small size, particles on the order of 10 micrometers or less (coarse particulate matter, PM10) can penetrate the deepest part of the lungs such as the bronchioles or alveoli.[151] When asthmatics are exposed to these conditions it can trigger bronchoconstriction.[152]
Similarly, fine particulate matter (PM2.5) tends to penetrate into the gas exchange regions of the lung (alveoli), and very small particles (ultrafine particulate matter PM0.1) may pass through the lungs to affect other organs. Penetration of particles is not wholly dependent on their size; shape and chemical composition also play a part. To avoid this complication, simple nomenclature is used to indicate the different degrees of relative penetration of a PM particle into the cardiovascular system. Inhalable particles penetrate no further than the bronchi as they are filtered out by the cilia. Thoracic particles can penetrate right into terminal bronchioles whereas PM0.1, which can penetrate to alveoli, the gas exchange area, and hence the circulatory system, are termed respirable particles.[citation needed]
In analogy, the inhalable dust fraction is the fraction of dust entering the nose and mouth which may be deposited anywhere in the respiratory tract. The thoracic fraction is the fraction that enters the thorax and is deposited within the lung's airways. The respirable fraction is what is deposited in the gas exchange regions (alveoli).[153]
The smallest particles, nanoparticles, which are less than 180 nanometers in size, may be even more damaging to the cardiovascular system.[154][155] Nanoparticles can pass through cell membranes and migrate into other organs, including the brain. Particles emitted from modern diesel engines (commonly referred to as Diesel Particulate Matter, or DPM) are typically in the size range of 100 nanometers (0.1 micrometers). These soot particles also carry carcinogens like benzopyrenes adsorbed on their surface.
Particulate mass is not a proper measure of the health hazard. A particle of 10 μm diameter has approximately the same mass as 1 million particles of 100 nm diameter, but is much less hazardous, as it is unlikely to enter the alveoli. Legislative limits for engine emissions based on mass are therefore not protective. Proposals for new regulations exist in some countries,[which?] with suggestions to limit the particle surface area or the particle count (numerical quantity) / particle number concentration (PNC) instead.[156][157]
Solubility edit
The site and extent of absorption of inhaled gases and vapors are determined by their solubility in water. Absorption is also dependent upon air flow rates and the partial pressure of the gases in the inspired air. The fate of a specific contaminant is dependent upon the form in which it exists (aerosol or particulate). Inhalation also depends upon the breathing rate of the subject.[158]
Shape edit
Another complexity not entirely documented is how the shape of PM can affect health, except for the needle-like shape of asbestos fibres which can lodge in the lungs. Geometrically angular shapes have more surface area than rounder shapes, which in turn affects the binding capacity of the particle to other, possibly more dangerous substances.[citation needed] The table below lists the colours and shapes of some common atmospheric particulates:[159]
| Type of particulate | Color | Shape |
|---|---|---|
| Portland cement | Gray | Irregular |
| Smolder smoke | White | Spherical |
| Soot | Black | Fractal aggregate |
| Water droplets | White | Spherical |
| Loess | Yellow Brown | Irregular |
| Lokon volcanic ash | Dark Brown | Irregular |
| Sahara sand (Libya) | Brown | Irregular |
-
 Scanning electron microscopy of glass powder originated from glass bottles
 -
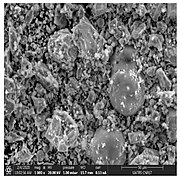 Scanning electron microscopy of cement
 -
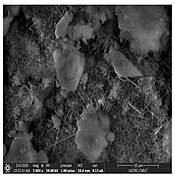 Scanning electron microscopy of mortar glass powder (10%) which seems to have fibre-like structure
 -
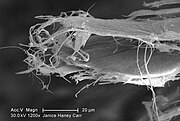 Scanning electron microscopy of white asbestos with needle-like shape fibre


Composition, quantity, and duration are important edit
This section needs expansion. You can help by adding to it. (February 2023) |

Composition of particles can vary greatly depending on their sources and how they are produced. For example, dust emitted from the burning of living and dead vegetation would be different from those emitted from the burning of joss paper or construction wastes. Particles emitted from fuel combustion are not the same as those emitted from waste combustion. The particulate matter generated from the fire of a recycling yard[160] or a ship full of scrap metal[161][162] may contain more toxic substances than other types of burning.
Different types of building refurbishment activities produce different kinds of dust too. The composition of PM generated from cutting or mixing concrete made with Portland Cement would be different from those generated from cutting or mixing concrete made with different types of slag (e.g. GGBFS, EAF slag[163]), fly ash or even EAF dust (EAFD),[164] while EFAD, slag and fly ash are likely to be more toxic as they contain heavy metals. Besides slag cement that is sold and used as an environmental friendly product,[165][166][167] fake (adulterated) cement, where different types of slag, fly ash or other unknown substances are added, is also very common in some places[168][169] due to the much lower production cost.[170] To address to the quality[171] and toxicity problems, some places are starting to ban the use of EAF slag in cement used in buildings.[172] Composition of welding fumes varies a lot as well and it depends on the metals in the material being welded, the composition of the coatings, electrode, etc., and hence a lot of health problems (e.g., lead poisoning, metal Fume Fever, cancers, nausea, irritation, kidney and liver damage, central nervous system problems, asthma, pneumonia, etc.) can be resulted from the different types of toxic emissions.[173]
Studies have found that blood lead levels of people in China are highly correlated to ambient PM2.5 concentration as well as top soil lead content, indicating that air and soil (e.g., by the inhalation of resuspended soil particles, consuming of contaminated crops or water, etc.) are important sources of lead exposure.[174][175]
Besides composition, quantity and duration of exposure are also important, since they would affect the triggering and severity of a disease. Particles that get into indoor would directly affect indoor air quality. Possible secondary contamination, similar to third-hand smoke, is also of concern.[176][177]
In a nutshell, while background concentration is important, only "improvement in air quality" or "decrease in ambient concentration of PM" do not necessarily mean better health. The health impact mainly depends on the toxicity (or source[178]) of the particulate matter a person is exposed to, the amount he is exposed to and for how long, and also the size, shape, and solubility of the PM.
Since construction and refurbishment projects are prominent sources of particulate matter, it implicates that such projects, which are very common in some places,[179][180] should be avoided in health facilities that already commenced and under operation as far as possible. For inevitable projects, better plannings and mitigation measures regarding PM emission should be introduced. Use of power tools, heavy equipments, diesel fuels and potentially toxic building materials (e.g. concrete, metals, solder, paint, etc.) should be strictly monitored to ensure that patients who are there seeking for disease treatments or chances to survive are not adversely affected.
Health problems edit
This section needs to be updated. (July 2023) |


The effects of inhaling particulate matter that have been widely studied in humans and animals include COVID-19,[181][182][183][184][185] asthma, lung cancer, respiratory diseases like silicosis, [186] [187] cardiovascular disease, premature delivery, birth defects, low birth weight, developmental disorders,[188][189][190][191] neurodegenerative disorders[192][193] mental disorders,[194][195][196] and premature death. Outdoor fine particulates with diameter less than 2.5 microns accounts for 4.2 million annual deaths worldwide, and more than 103 million disability-adjusted life-years lost, making it the fifth leading risk factor for death. Air pollution has also been linked to a range of other psychosocial problems.[195] Particulates may cause tissue damage by entering organs directly, or indirectly by systemic inflammation. Adverse effects may occur even at exposure levels lower than published air quality standards deemed safe.[197][198]
Anthropogenic fine particulates as main hazard edit
Increased levels of fine particles in the air as a result of anthropogenic particulate air pollution "is consistently and independently related to the most serious effects, including lung cancer[8] and other cardiopulmonary mortality".[199] The association between a large number of deaths[200] and other health problems and particulate pollution was first demonstrated in the early 1970s[201] and has been reproduced many times since. PM pollution is estimated to cause 22,000–52,000 deaths per year in the United States (from 2000)[202] contributed to ~370,000 premature deaths in Europe during 2005.[203] and 3.22 million deaths globally in 2010 per the global burden of disease collaboration.[204] A study by the European Environment Agency estimates that 307,000 people have died prematurely in 2019 due to fine particle pollution in the 27 EU member states.[205]
A study in 2000 conducted in the U.S. explored how fine particulate matter may be more harmful than coarse particulate matter. The study was based on six different cities. They found that deaths and hospital visits that were caused by particulate matter in the air were primarily due to fine particulate matter.[206] Similarly, a 1987 study of American air pollution data found that fine particles and sulfates, as opposed to coarser particles, most consistently and significantly correlated to total annual mortality rates in standard metropolitan statistical areas.[207]
A study published in 2022 in GeoHealth concluded that eliminating energy-related fossil fuel emissions in the United States would prevent 46,900–59,400 premature deaths each year and provide $537–$678 billion in benefits from avoided PM2.5-related illness and death.[208]
Infertility, pregnancy, fetuses and birth defects edit
Higher rates of infertility have been correlated with exposure to particulates.[209] Maternal PM2.5 exposure during pregnancy is also associated with high blood pressure in children.[210]
Inhalation of PM2.5 – PM10 is associated with elevated risk of adverse pregnancy outcomes, such as low birth weight.[211] Exposure to PM2.5 has been associated with greater reductions in birth weight than exposure to PM10.[212] PM exposure can cause inflammation, oxidative stress, endocrine disruption, and impaired oxygen transport access to the placenta,[213] all of which are mechanisms for heightening the risk of low birth weight.[214] Overall epidemiologic and toxicological evidence suggests that a causal relationship exists between long-term exposures to PM2.5 and developmental outcomes (i.e. low birth weight).[212] Studies investigating the significance of trimester-specific exposure have proven to be inconclusive,[215] and results of international studies have been inconsistent in drawing associations of prenatal particulate matter exposure and low birth weight.[212] As perinatal outcomes have been associated with lifelong health[216][217] and exposure to particulate matter is widespread, this issue is of critical public health importance.
Cardiovascular and respiratory disease edit
PM2.5 leads to high plaque deposits in arteries, causing vascular inflammation and atherosclerosis – a hardening of the arteries that reduces elasticity, which can lead to heart attacks and other cardiovascular problems.[218] A 2014 meta analysis reported that long term exposure to particulate matter is linked to coronary events. The study included 11 cohorts participating in the European Study of Cohorts for Air Pollution Effects (ESCAPE) with 100,166 participants, followed for an average of 11.5 years. An increase in estimated annual exposure to PM 2.5 of just 5 μg/m3 was linked with a 13% increased risk of heart attacks.[219] Not only affecting human cells and tissues, PM also impacts bacteria which cause disease in humans.[220] Biofilm formation, antibiotic tolerance, and colonisation of both Staphylococcus aureus and Streptococcus pneumoniae was altered by black carbon exposure.
The largest US study on acute health effects of coarse particle pollution between 2.5 and 10 micrometers in diameter was published 2008 and found an association with hospital admissions for cardiovascular diseases but no evidence of an association with the number of hospital admissions for respiratory diseases.[221] After taking into account fine particle levels (PM2.5 and less), the association with coarse particles remained but was no longer statistically significant, which means the effect is due to the subsection of fine particles.
The Mongolian government agency recorded a 45% increase in the rate of respiratory illness in the past five years (reported in 2011).[222] Bronchial asthma, chronic obstructive pulmonary disease, and interstitial pneumonia were the most common ailments treated by area hospitals. Levels of premature death, chronic bronchitis, and cardiovascular disease are increasing at a rapid rate.[68]
Cognitive hazards and mental health edit
The effects of air pollution and particulate matter on cognitive performance has become an active area of research.[223]
Air pollution may increase the risk of developmental disorders (e.g., autism),[188][189][190][191] neurodegenerative disorders,[192][193] mental disorders,[194][195][196] and suicide,[194][196][224] although studies on the link between depression and some air pollutants are not consistent.[225] At least one study has identified "the abundant presence in the human brain of magnetite nanoparticles that match precisely the high-temperature magnetite nanospheres, formed by combustion and/or friction-derived heating, which are prolific in urban, airborne particulate matter (PM)."[226]
Particulates also appear to have a role in the pathogenesis of Alzheimer's disease and premature brain aging. There is increasing evidence to suggest a correlation between PM2.5 exposure and the prevalence of neurodegenerative diseases such as Alzheimer's. Several epidemiological studies have suggested a link between PM2.5 exposure and cognitive decline, particularly in the development of neurodegenerative diseases such as Alzheimer's.
Using geospatial analytical techniques, "NIEHS-funded researchers were able to confirm a strong association between cases of Parkinson's disease and fine particulate matter (known as PM2.5) across the U.S. In the study, regions of the country with a high rate of Parkinson's disease were associated generally with higher levels of PM2.5, of which sources include motor vehicles, wildfires, and power plants."[227] While the exact mechanisms behind the link between PM2.5 exposure and cognitive decline are not fully understood, research suggests that the fine particles may be able to enter the brain through the olfactory nerve and cause inflammation and oxidative stress, which can damage brain cells and contribute to the development of neurodegenerative diseases.[228]
Increased death edit
The World Health Organization (WHO) estimated in 2005 that "... fine particulate air pollution (PM(2.5)), causes about 3% of mortality from cardiopulmonary disease, about 5% of mortality from cancer of the trachea, bronchus, and lung, and about 1% of mortality from acute respiratory infections in children under 5 years, worldwide."[229] A 2011 study concluded that traffic exhaust is the single most serious preventable cause of heart attack in the general public, the cause of 7.4% of all attacks.[230]
Particulate matter studies in Bangkok, Thailand from 2008 indicated a 1.9% increased risk of dying from cardiovascular disease, and 1.0% risk of all disease for every 10 micrograms per cubic meter. Levels averaged 65 in 1996, 68 in 2002, and 52 in 2004. Decreasing levels may be attributed to conversions of diesel to natural gas combustion as well as improved regulations.[231]
Racial disparities edit
There have been many studies linking race to increased proximity to particulate matter, and thus susceptibility to adverse health effects of long term exposure. A U.S. study showed that "the proportions of Black residents in a tract was linked to higher asthma rates".[232] Many scholars link this disproportionality to racial housing segregation and their respective inequalities in "toxic exposures".[232] This reality is made worse by the finding that "health care occurs in the context of broader historic and contemporary social and economic inequality and persistent racial and ethnic discrimination in many sectors of American life".[233] Residential proximity to particulate emitting facilities increases exposure to PM 2.5 which is linked to increased morbidity and mortality rates.[234] Multiple studies confirm the burden of PM emissions is higher among non-White and poverty ridden populations,[234] though some say that income does not drive these differences.[235] This correlation between race and housing related health repercussions stems from a longstanding environmental justice problem linked to the practice of historic redlining. An example of these factors contextualized is an area of Southeastern Louisiana, colloquially dubbed 'Cancer Alley' for its high concentration of cancer related deaths due to neighboring chemical plants.[236] Cancer Alley being a majority African American community, with the neighborhood nearest to the plant being 90% Black,[236] perpetuates the scientific narrative that Black populations are located disproportionately closer to areas of high PM output than White populations. A 2020 article relates the long-term health effects of living in high PM concentrations to increased risk, spread, and mortality rates from the SARS-CoV-2 or COVID-19, and faults a history of racism for this outcome.[236]
Wildfire smoke risk edit
In regions where wildfires are persistent the risk of particulate exposure increased. Smoke from wildfires may impact sensitive groups such as the elderly, children, pregnant women, and people with lung, and cardiovascular disease.[237] It was found that in the 2008 wildfire season in California, the particulate matter was much more toxic to human lungs, as increased neutrophil infiltrate, cell influx and edema was observed versus particulate matter from ambient air.[238] Furthermore, particulate matter from wildfires have been linked to be a triggering factor of acute coronary events such as ischemic heart disease.[239] Wildfires also have been associated with increased emergency department visits due to particulate matter exposure, as well as an increased risk of asthma related events.[240][241] A link between PM2.5 from wildfires and increased risk of hospitalizations for cardiopulmonary diseases has been discovered.[242] Evidence also suggest wildfire smoke reduces mental performance.[243]
Energy industry knowledge and response to adverse health effects edit

Major energy companies understood at least since the 1960s that use of their products causes widespread adverse health effects and death but continued aggressive political lobbying in the United States and elsewhere against clean air regulation and launched major corporate propaganda campaigns to sow doubt regarding the causative link between the burning of fossil fuels and major risks to human life. Internal company memoranda reveal that energy industry scientists and executives knew that air pollutants created by fossil fuels lodge deep in human lung tissue, and cause birth defects in children of oil industry workers. The industry memos acknowledge that automobiles "are by far the greatest sources of air pollution" and also that air pollution causes adverse health effects and lodges toxins, including carcinogens, "deep into the lungs which would otherwise be removed in the throat".[245]
In response to mounting public concern, the industry eventually created the Global Climate Coalition, an industry lobby group, to derail governments' attempts to regulate air pollution and to create confusion in the public mind about the necessity of such regulation. Similar lobbying and corporate public relations efforts were undertaken by the American Petroleum Institute, a trade association of the oil and gas industry, and the climate change denier private think tank, The Heartland Institute. "The response from fossil-fuel interests has been from the same playbook – first they know, then they scheme, then they deny and then they delay. They've fallen back on delay, subtle forms of propaganda and the undermining of regulation," said Geoffrey Supran, a Harvard University researcher of the history of fossil-fuel companies and climate change. These efforts have been compared, by policy analysts such as Carroll Muffett of the Center for International Environmental Law, to the tobacco industry strategy of lobbying and corporate propaganda campaigns to create doubt regarding the causal connection between cigarette smoking and cancer and to forestall its regulation. In addition, industry-funded advocates, when appointed to senior government positions in the United States, have revised scientific findings showing the deadly effects of air pollution and have rolled back its regulation.[245][246][247]
Effects on vegetation edit
This section needs expansion. You can help by adding to it. (February 2024) |
Particulate matter can clog stomatal openings of plants and interfere with photosynthesis functions.[248] In this manner, high particulate matter concentrations in the atmosphere can lead to growth stunting or mortality in some plant species.[citation needed]
Regulation edit
Most governments have created regulations both for the emissions allowed from certain types of pollution sources (motor vehicles, industrial emissions etc.) and for the ambient concentration of particulates. The IARC and WHO designate particulates a Group 1 carcinogen. Particulates are the deadliest form of air pollution due to their ability to penetrate deep into the lungs and blood streams unfiltered, causing respiratory diseases, heart attacks, and premature death.[7] In 2013, the ESCAPE study involving 312,944 people in nine European countries revealed that there was no safe level of particulates and that for every increase of 10 μg/m3 in PM10, the lung cancer rate rose 22%. For PM2.5 there was a 36% increase in lung cancer per 10 μg/m3.[8] In a 2014 meta-analysis of 18 studies globally including the ESCAPE data, for every increase of 10 μg/m3 in PM2.5, the lung cancer rate rose 9%.[249]
Limits / standards set by governments edit
| Country/ Region | PM2.5 (μg/m3) | PM10 (μg/m3) | No. of exceedances allowed per year | ||
|---|---|---|---|---|---|
| Yearly avg. | Daily avg. (24-hour) | Yearly avg. | Daily avg (24-hour) | ||
| Australia [250] | 8 | 25 | 25 | 50 | None |
| China [251] | 35 | 75 | 70 | 150 | None |
| European Union [252][a][b] | 25 | None | 40 | 50 | PM2.5: None; PM10: 35 |
| Hong Kong [253][c] | 35 | 75 | 50 | 100 | PM2.5: 9; PM10: 9 |
| Japan [254][255][d][e] | 15 | 35 | None | 100 | None |
| South Korea [256][257][f][g] | 15 | 35 | 50 | 100 | None |
| Taiwan [258][259] | 15 | 35 | 50 | 100 | None |
| United States [260] | 12[h] | 35[i] | None[j] | 150[k] | PM2.5: Not applicable;[l] PM10: 1 |
| World Health Organization [262][263] | 5 | 15 | 15 | 45 | |
Canada edit
In Canada the standard for particulate matter is set nationally by the federal-provincial Canadian Council of Ministers of the Environment (CCME). Jurisdictions (provinces and territories) may set more stringent standards. The CCME standard for particulate matter 2.5 (PM2.5) as of 2015 is 28 μg/m3 (calculated using the 3-year average of the annual 98th percentile of the daily 24-hr average concentrations) and 10 μg/m3 (3-year average of annual mean). PM2.5 standards will increase in stringency in 2020.[264]
European Union edit
The European Union has established the European emission standards, which include limits for particulates in the air:[252]
| European Air Quality Index | Good | Fair | Moderate | Poor | Very poor | Extremely poor |
|---|---|---|---|---|---|---|
| Particles less than 2.5μm (PM2,5) | 0–10 μg/m3 | 10–20 μg/m3 | 20–25 μg/m3 | 25–50 μg/m3 | 50–75 μg/m3 | 75–800 μg/m3 |
| Particles less than 10μm (PM10) | 0–20 μg/m3 | 20–40 μg/m3 | 40–50 μg/m3 | 50–100 μg/m3 | 100–150 μg/m3 | 150–1200 μg/m3 |
United Kingdom edit
To mitigate the problem of wood burning, starting from May 2021, traditional house coal (bituminous coal) and wet wood, two of the most polluting fuels, can no longer be sold. Wood sold in volumes of less than 2m3 must be certified as 'Ready to Burn', which means it has a moisture content of 20% or less. Manufactured solid fuels must also be certified as 'Ready to Burn' to ensure they meet sulphur and smoke emission limits.[265] Starting from January 2022, all new wood burning stoves have to meet new EcoDesign standards (Ecodesign stoves produce 450 times more toxic air pollution than gas central heating. Older stoves, which are now banned from sale, produce 3,700 times more).[266]
In 2023, the amount of smoke that burners in "smoke control areas" - most England's towns and cities - can emit per hour is reduced from 5g to 3g. Violation will result in an on-the-spot fine of up to £300. Those who do not comply may even get a criminal record.[267]
United States edit

The United States Environmental Protection Agency (EPA) has set standards for PM10 and PM2.5 concentrations.[260] (See National Ambient Air Quality Standards.)
California edit
This section needs to be updated. (September 2016) |

In October 2008, the Department of Toxic Substances Control (DTSC), within the California Environmental Protection Agency, announced its intent to request information regarding analytical test methods, fate and transport in the environment, and other relevant information from manufacturers of carbon nanotubes.[268] DTSC is exercising its authority under the California Health and Safety Code, Chapter 699, sections 57018–57020.[269] These sections were added as a result of the adoption of Assembly Bill AB 289 (2006).[269] They are intended to make information on the fate and transport, detection and analysis, and other information on chemicals more available. The law places the responsibility to provide this information to the department on those who manufacture or import the chemicals.
On 22 January 2009, a formal information request letter[270] was sent to manufacturers who produce or import carbon nanotubes in California, or who may export carbon nanotubes into the State.[271] This letter constitutes the first formal implementation of the authorities placed into statute by AB 289 and is directed to manufacturers of carbon nanotubes, both industry, and academia within the State, and to manufacturers outside California who export carbon nanotubes to California. This request for information must be met by the manufacturers within one year. DTSC is waiting for the upcoming 22 January 2010 deadline for responses to the data call-in.
The California Nano Industry Network and DTSC hosted a full-day symposium on 16 November 2009 in Sacramento, California. This symposium provided an opportunity to hear from nanotechnology industry experts and discuss future regulatory considerations in California.[272]
DTSC is expanding the Specific Chemical Information Call-in to members of the nanometal oxides, the latest information can be found on their website.[273]
Colorado edit

Key points in the Colorado Plan include reducing emission levels and solutions by sector. Agriculture, transportation, green electricity, and renewable energy research are the main concepts and goals in this plan. Political programs such as mandatory vehicle emissions testing and the prohibition of smoking indoors are actions taken by local government to create public awareness and participation in cleaner air. The location of Denver next to the Rocky Mountains and wide expanse of plains makes the metro area of Colorado's capital city a likely place for smog and visible air pollution.[citation needed]
Affected areas edit

To analyse the air pollution trend, 480 cities around the world (Ukraine excluded) was mapped by air experts[274] to calculate the average PM2.5 level of the first nine months of 2019 against that of 2022.[275] Average levels of PM2.5 were measured using aqicn.org's World Air Quality Index data, and a formula developed by AirNow was used to convert the PM2.5 figure into micrograms per cubic meter of air (μg/m3) values.
Among the 70 capital cities investigated, Baghdad, Iraq is the worst performing one, with PM2.5 levels going up +31.6 μg/m3. Ulan Bator (Ulaanbaatar), the capital city of Mongolia, is performing the best, with PM2.5 levels dropping by -23.4 μg/m3. Previously it was as one of the most polluted capital cities in the world. An air quality improvement plan in 2017 appears to be showing positive results.
Out of the 480 cities, Dammam in Saudi Arabia is performing the worst with PM2.5 levels going up +111.1 μg/m3. The city is a significant center for the Saudi oil industry and home to both the largest airport in the world and the largest port in the Persian Gulf. It is currently the most polluted city surveyed.
In Europe, the worst performing cities are located in Spain. They are Salamanca and Palma, with PM2.5 levels increase by +5.1 μg/m3 and +3.7 μg/m3 respectively. The best performing city is Skopje, the capital city of North Macedonia, with PM2.5 levels dropping by -12.4 μg/m3. It was once the most polluted capital city in Europe and still has a long way to go to achieve clean air.
In the U.S., Salt Lake City, Utah and Miami, Florida are the two cities with the highest PM2.5 level increases (+1.8 μg/m3). Salt Lake City suffers from a weather event known as 'inversion'. Located in a valley, cooler, polluted air is trapped close to ground level under the warmer air above when inversion occurs. On the other hand, Omaha, Nebraska is performing the best and has a decrease of -1.1 μg/m3 in PM2.5 levels.
The cleanest city in this report is Zürich, Switzerland with PM2.5 levels of just 0.5 μg/m3, placed first in both 2019 and 2022. The second cleanest city is Perth, with 1.7 μg/m3 and PM2.5 levels dropping by -6.2 μg/m3 since 2019. Of the top ten cleanest cities, five are from Australia. They are Hobart, Wollongong, Launceston, Sydney and Perth. Honolulu is the only U.S. city in the top ten list, ranking tenth with levels of 4 μg/m3, with a tiny increase since 2019.
Almost all of the top ten most polluted cities are in the Middle East and Asia. The worst is Dammam in Saudi Arabia with a PM2.5 level of 155 μg/m3. Lahore in Pakistan is the second worst with 98.1 μg/m3. The third is Dubai, home to the world's tallest building. In the bottom ten are three cities from India, Muzaffarnagar, Delhi and New Delhi. Here is a list of the 30 most polluted cities by PM2.5, Jan to Sep 2022:[274]
| City | Country / Region | 1st 9 months average PM2.5 (μg/m3) | |
|---|---|---|---|
| 2022 | 2019 | ||
| Dammam | 155 | 43.9 | |
| Lahore | 98.1 | 64.6 | |
| Dubai | 97.7 | 47.5 | |
| Baghdad | 60.5 | 29 | |
| Dhaka | 55.3 | 48.7 | |
| Muzaffarnagar | 53.9 | 60.5 | |
| Delhi | 51.6 | 59.8 | |
| Oaxaca | 51.1 | 13.5 | |
| New Delhi | 50.1 | 54.2 | |
| Manama | 48 | 43.4 | |
| Patna | 47.9 | 53.5 | |
| Peshawar | 47 | 46.7 | |
| Ghāziābād | 46.6 | 56.9 | |
| Lucknow | 46.4 | 54.1 | |
| Hawalli | 46.2 | 40.4 | |
| Hapur | 45.7 | 53.3 | |
| Chandigarh | 44.9 | 39.7 | |
| Jaipur | 43.5 | 40.6 | |
| Kampala | 42.9 | 48.3 | |
| Khorramshahr | 42 | 30 | |
| Pokhara | 41.8 | 18.2 | |
| Abu Dhabi | 40.2 | 44.7 | |
| Xi'an | 36.6 | 40 | |
| Xuchang | 36.4 | 41.4 | |
| Xinxiang | 36.3 | 46.4 | |
| Anyang | 36.1 | 45.9 | |
| Shijiazhuang | 36 | 44.9 | |
| Taiyuan | 35.9 | 39.2 | |
| East London | 35.9 | 7.1 | |
| Gandhinagar | 35.5 | 42.9 | |
There are limits to the above survey. For example, not every city in the world is covered, and that the number of monitoring stations for each city would not be the same. The data is for reference only.
Australia edit
PM10 pollution in coal mining areas in Australia such as the Latrobe Valley in Victoria and the Hunter Region in New South Wales significantly increased during 2004 to 2014. Although the increase did not significantly add to non-attainment statistics the rate of increase has risen each year during 2010 to 2014.[276]
China edit
Some cities in Northern China and South Asia have had concentrations above 200 μg/m3.[277] The PM levels in Chinese cities were extreme between 2010 - 2014, reaching an all-time high in Beijing on 12 January 2013, of 993 μg/m3,[68] but has been improving thanks to clean air actions.[278][279]
To monitor the air quality of south China, the U.S. Consulate Guangzhou set a PM2.5 and PM10 monitor on Shamian Island in Guangzhou and displays readings on its official website and social platforms.[280]
Europe edit
This section needs expansion. You can help by adding to it. (February 2024) |

Italy edit

South Korea edit
As of 2017, South Korea has the worst air pollution among the developed nations in the OECD (Organization for Economic Cooperation and Development).[281] According to a study conducted by NASA and NIER, 52% of PM2.5 measured in Olympic Park, Seoul in May and June 2016 came from local emissions. The rest was trans-boundary pollution coming from China's Shandong Province (22%), North Korea (9%), Beijing (7%), Shanghai (5%), and a combined 5% from China's Liaoning Province, Japan and the West Sea.[282] In December 2017, the environmental ministers from South Korea and China signed the China-Korea Environmental Cooperation Plan (2018–22), a five-year plan to jointly solve issues in the air, water, soil and waste. An environmental cooperation centre was also launched in 2018 to aid cooperation.[283]
Thailand edit
Air quality of Thailand is getting worse in 2023, which is described as a "post-COVID back-to-normal situation". In addition to the capital Bangkok, air quality in Chiang Mai, a popular tourist destination, is also deteriorating. Chiang Mai was listed as the most polluted city in a live ranking by a Swiss air quality company on 27 March 2023. The ranking includes data from about 100 world cities for which measured PM2.5 data is available.[284][285]
Ulaanbaatar edit
Mongolia's capital city Ulaanbaatar has an annual average mean temperature of about 0 °C, making it the world's coldest capital city. About 40% of the population lives in apartments, 80% of which are supplied with central heating systems from three combined heat and power plants. In 2007, the power plants consumed almost 3.4 million tons of coal. The pollution control technology is in poor condition. [citation needed]
The other 60% of the population reside in shantytowns (Ger districts), which have developed due to the country's new market economy and the very cold winter seasons. The poor in these districts cook and heat their wood houses with indoor stoves fueled by wood or coal. The resulting air pollution is characterized by raised sulfur dioxide and nitrogen oxide levels and very high concentrations of airborne particles and particulate matter (PM).[68] Annual seasonal average particulate matter concentrations have been recorded as high as 279 μg/m3 (micrograms per cubic meter).[citation needed] The World Health Organization's recommended annual mean PM10 level is 20 μg/m3,[286] which means that Ulaanbaatar's PM10 annual mean levels are 14 times higher than recommended.[citation needed]
During the winter months, in particular, the air pollution obscures the air, affecting the visibility in the city to such an extent that airplanes on some occasions are prevented from landing at the airport.[287]
In addition to stack emissions, another source unaccounted for in the emission inventory is fly ash from ash ponds, the final disposal place for fly ash that has been collected in settling tanks. Ash ponds are continually eroded by wind during the winter.[288]
United States edit
-
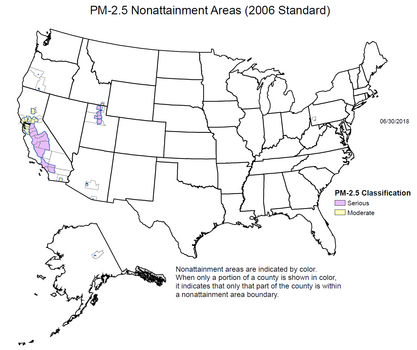 U.S. counties violating national PM2.5 standards, June 2018
 -
 U.S. counties violating national PM10 standards, June 2018


From the "State of Air 2022" report compiled by the American Lung Association using data from the U.S. Environmental Protection Agency from 2018 to 2020,[289] California cities are the most polluted cities (by PM2.5) in the U.S. while the East Coast is cleaner.
However, another study has come up with a very different conclusion. According to Forbes, a travel insurance comparison site InsureMyTrip conducted a survey of 50 U.S. cities in 2020 and ranked them by cleanliness with criteria like hand sanitizer demand, cleanliness of restaurants, quantity of recycling collectors, satisfaction of garbage disposal, electric vehicle market share and pollution.[290] On their top ten cleanest cities list, seven are from California, including Long Beach (No. 1), San Diego (No. 2), Sacramento (No. 3), San Jose (No. 6), Oakland (No. 7), Bakersfield (No. 9), and San Francisco (No. 10). The discrepancies maybe due to the differences in data choice, calculation methods, definitions of "cleanliness" and a large variation of air quality across the same state, etc. This again shows that one need to be very careful when drawing conclusions from the many air quality rankings available on the internet.
In mid-2023, air quality in eastern U.S. lowered significantly as particulates from Canada's wildfires blew down. According to NASA, some of the fires were ignited by lightning.[291][13]
See also edit
- Air filter
- Air quality index | Air quality law
- ASTDR
- Bioaerosol
- Carbon black
- CCN (Cloud condensation nuclei)
- Chip formation
- Cleanroom
- Contamination control
- Criteria air contaminants
- Dust
- Exposure assessment | Exposure science
- Fertilizer | Pesticides
- Fog | Pea soup fog
- Fugitive dust
- Heavy industry
- List of least polluted cities by particulate matter concentration
- List of most polluted cities by particulate matter concentration
- Metal swarf | Sawdust
- NIEHS
- Non-exhaust emissions
- Occupational dust exposure
- Respirator
- Recycling
- Scrubber
- Suspended solids
Health effects:
- Health effects of coal ash
- Health effects of pesticides
- Health impact of asbestos
- Health impacts of sawdust
Health-related:
Other names edit
- atmospheric aerosol particles
- particulate matter (PM)
- suspended particulate matter (SPM)
Notes edit
- ^ PM10 limit since 1 January 2005
- ^ PM2.5 limit since 1 January 2015
- ^ Since 1 January 2014
- ^ PM10 referred to as Suspended Particulate Matter
- ^ PM2.5 limit since 21 September 2009
- ^ PM10 limit since 4 December 2006
- ^ PM2.5 limit since 27 March 2018
- ^ annual limit since 2012
- ^ daily limit since 2007
- ^ annual limit removed in 2006
- ^ daily limit since 1987[261]
- ^ 3-year average of annual 98th percentile
References edit
- ^ Seinfeld J, Pandis S (1998). Atmospheric Chemistry and Physics: From Air Pollution to Climate Change (2nd ed.). Hoboken, New Jersey: John Wiley & Sons. p. 97. ISBN 978-0-471-17816-3.
- ^ Plainiotis S, Pericleous KA, Fisher BE, Shier L (January 2010). "Application of Lagrangian particle dispersion models to air quality assessment in the Trans-Manche region of Nord-Pas-de-Calais (France) and Kent (Great Britain)" (PDF). International Journal of Environment and Pollution. 40 (1/2/3): 160–74. doi:10.1504/IJEP.2010.030891.
- ^ Brown JS, Gordon T, Price O, Asgharian B (April 2013). "Thoracic and respirable particle definitions for human health risk assessment". Particle and Fibre Toxicology. 10: 12. doi:10.1186/1743-8977-10-12. PMC 3640939. PMID 23575443.
- ^ a b US EPA, OAR (19 April 2016). "Particulate Matter (PM) Basics". US EPA. Retrieved 5 October 2019.
- ^ "EHP – Outdoor Particulate Matter Exposure and Lung Cancer: A Systematic Review and Meta-Analysis". ehp.niehs.nih.gov. Archived from the original on 29 May 2016. Retrieved 29 December 2016.
- ^ Wasley, Andrew; Heal, Alexandra; Harvey, Fiona; Lainio, Mie (13 June 2019). "Revealed: UK government failing to tackle rise of serious air pollutant". The Guardian.
- ^ a b US EPA, OAR (26 April 2016). "Health and Environmental Effects of Particulate Matter (PM)". US EPA. Retrieved 5 October 2019.
- ^ a b c Raaschou-Nielsen, Ole; Andersen, Zorana J; Beelen, Rob; Samoli, Evangelia; Stafoggia, Massimo; Weinmayr, Gudrun; et al. (August 2013). "Air pollution and lung cancer incidence in 17 European cohorts: prospective analyses from the European Study of Cohorts for Air Pollution Effects (ESCAPE)". The Lancet Oncology. 14 (9): 813–822. doi:10.1016/S1470-2045(13)70279-1. PMID 23849838.
- ^ "STATE OF GLOBAL AIR/2018 A SPECIAL REPORT ON GLOBAL EXPOSURE TO AIR POLLUTION AND ITS DISEASE BURDEN" (PDF). Health Effects Institute. 2018.
- ^ "The Weight of Numbers: Air Pollution and PM2.5". Undark. Retrieved 6 September 2018.
- ^ Omidvarborna; et al. (2015). "Recent studies on soot modeling for diesel combustion". Renewable and Sustainable Energy Reviews. 48: 635–647. doi:10.1016/j.rser.2015.04.019.
- ^ "Air quality, EASA Eco".
- ^ a b Lee, Giyoon; Ahn, Jinho; Park, Seung-Myung; Moon, Jonghan; Park, Rokjin; Sim, Min Sub; Choi, Hanna; Park, Jinsoo; Ahn, Joon-Young (17 September 2023). "Sulfur isotope-based source apportionment and control mechanisms of PM2.5 sulfate in Seoul, South Korea during winter and early spring (2017–2020)". Science of the Total Environment. 905. Bibcode:2023ScTEn.905p7112L. doi:10.1016/j.scitotenv.2023.167112. PMID 37717778. S2CID 262046328.
- ^ Lin C, Huang RJ, Duan J, Zhong H, Xu W, Wu Y, Zhang R (April 2022). "Large contribution from worship activities to the atmospheric soot particles in northwest China". Environ Pollut. 299: 118907. Bibcode:2022EPoll.29918907L. doi:10.1016/j.envpol.2022.118907. PMID 35091017. S2CID 246355499.
- ^ Giang, Lam Van; Thanh, Tran; Hien, Truong Thanh; Tan, Lam Van; Thi Bich Phuong, Tran; Huu Loc, Ho (2021). "Heavy metals emissions from joss paper burning rituals and the air quality around a specific incinerator". Materials Today: Proceedings. 38: 2751–2757. doi:10.1016/j.matpr.2020.08.686. S2CID 226353498.
- ^ Shen H, Tsai CM, Yuan CS, Jen YH, Ie IR (January 2017). "How incense and joss paper burning during the worship activities influences ambient mercury concentrations in indoor and outdoor environments of an Asian temple?". Chemosphere. 167: 530–540. Bibcode:2017Chmsp.167..530S. doi:10.1016/j.chemosphere.2016.09.159. PMID 27764746.
- ^ Ramadan, Bimastyaji Surya; Rosmalina, Raden Tina; Syafrudin; Munawir; Khair, Hafizhul; Rachman, Indriyani; Matsumoto, Toru (2023). "Potential Risks of Open Waste Burning at the Household Level: A Case Study of Semarang, Indonesia". Aerosol and Air Quality Research. 23 (5). Taiwan Association for Aerosol Research: 220412. doi:10.4209/aaqr.220412. ISSN 1680-8584. S2CID 257202752.
- ^ Shah R, Limaye S, Ujagare D, Madas S, Salvi S (2019). "Personal exposures to particulate matter <2.5 μm in mass median aerodynamic diameter (PM2.5) pollution during the burning of six most commonly used firecrackers in India". Lung India. 36 (4): 324–329. doi:10.4103/lungindia.lungindia_440_18. PMC 6625239. PMID 31290418.
- ^ Roy, Rajarshi; Schooff, Brian; Li, Xiaolong; Montgomery, Scott; Tuttle, Jacob; Wendt, Jost O. L.; Dickson, Kingsley; Iverson, Brian; Fry, Andrew (1 May 2023). "Ash aerosol particle size distribution, composition, and deposition behavior while co-firing coal and steam-exploded biomass in a 1.5 MWth combustor". Fuel Processing Technology. 243: 107674. doi:10.1016/j.fuproc.2023.107674. S2CID 256529257.
- ^ Azarmi, Farhad; Kumar, Prashant (2016). "Ambient exposure to coarse and fine particle emissions from building demolition". Atmospheric Environment. 137: 62–79. Bibcode:2016AtmEn.137...62A. doi:10.1016/j.atmosenv.2016.04.029.
- ^ "Emissions of air pollutants in the UK – Particulate matter (PM10 and PM2.5)".
- ^ "Building works responsible for 18% of UK large particle pollution".
- ^ "Delhi's deadly dust: how construction sites are choking the city".
- ^ "Particulate matter emissions from activities of building refurbishment".
- ^ "SF Concrete Plant That Was Focus of NBC Bay Area Investigative Report, Ordered to Shut Down". 11 March 2022.
- ^ Scoop, pollution at Yau Tong Cement batching plant. HK: TVB.
- ^ Orirental Daily News once again revealed that the Yau Tong Concrete Plant violated regulations and emitted a large amount of smoke and dust, up to 40 meters. HK: Oriental Daily News.
- ^ Kholodov A, Zakharenko A, Drozd V, Chernyshev V, Kirichenko K, Seryodkin I, Karabtsov A, Olesik S, Khvost E, Vakhnyuk I, Chaika V, Stratidakis A, Vinceti M, Sarigiannis D, Hayes AW, Tsatsakis A, Golokhvast K (February 2020). "Identification of cement in atmospheric particulate matter using the hybrid method of laser diffraction analysis and Raman spectroscopy". Heliyon. 6 (2): e03299. Bibcode:2020Heliy...603299K. doi:10.1016/j.heliyon.2020.e03299. PMC 7042420. PMID 32128461.
- ^ "Cut down construction dust" (PDF).
- ^ "Proper Covering of Dusty Material on Dump Trucks". www.epd.gov.hk.
- ^ "Dusty Material - an overview | ScienceDirect Topics". www.sciencedirect.com.
- ^ Kim JY, Chen JC, Boyce PD, Christiani DC (March 2005). "Exposure to welding fumes is associated with acute systemic inflammatory responses". Occup Environ Med. 62 (3): 157–63. doi:10.1136/oem.2004.014795. PMC 1740976. PMID 15723880.
- ^ Bruschweiler ED, Danuser B, Huynh CK, Wild P, Schupfer P, Vernez D, Boiteux P, Hopf NB (2012). "Generation of polycyclic aromatic hydrocarbons (PAHs) during woodworking operations". Front Oncol. 2: 148. doi:10.3389/fonc.2012.00148. PMC 3475003. PMID 23087908.
- ^ "Woodworking health topics - Inhaling wood dust".
- ^ "Dust advice for businesses - EPA Victoria".
- ^ Henneman L, Choirat C, Dedoussi I, Dominici F, Roberts J, Zigler C (November 2023). "Mortality risk from United States coal electricity generation". Science. 382 (6673): 941–946. Bibcode:2023Sci...382..941H. doi:10.1126/science.adf4915. PMC 10870829. PMID 37995235.
- ^ Lin Y, Zou J, Yang W, Li CQ (March 2018). "A Review of Recent Advances in Research on PM2.5in China". Int J Environ Res Public Health. 15 (3): 438. doi:10.3390/ijerph15030438. PMC 5876983. PMID 29498704.
- ^ Sharma R, Sharma M, Sharma R, Sharma V (2013). "The impact of incinerators on human health and environment". Rev Environ Health. 28 (1): 67–72. doi:10.1515/reveh-2012-0035. PMID 23612530. S2CID 21271240.
- ^ Non-exhaust Particulate Emissions from Road Transport. OECD. 2020. doi:10.1787/4a4dc6ca-en. ISBN 978-92-64-88885-2. S2CID 136987659.
- ^ Khan RK, Strand MA (2018). "Road dust and its effect on human health: a literature review". Epidemiol Health. 40: e2018013. doi:10.4178/epih.e2018013. PMC 5968206. PMID 29642653.
- ^ Fan, Long; Liu, Shimin (2021). "Respirable nano-particulate generations and their pathogenesis in mining workplaces: a review". International Journal of Coal Science & Technology. 8 (2): 179–198. doi:10.1007/s40789-021-00412-w. S2CID 233890096.
- ^ Petavratzi, E.; Kingman, S.; Lowndes, I. (2005). "Particulates from mining operations: A review of sources, effects and regulations". Minerals Engineering. 18 (12): 1183–1199. Bibcode:2005MiEng..18.1183P. doi:10.1016/j.mineng.2005.06.017.
- ^ Jeong H, Choi JY, Ra K (March 2021). "Potentially toxic elements pollution in road deposited sediments around the active smelting industry of Korea". Sci Rep. 11 (1): 7238. doi:10.1038/s41598-021-86698-x. PMC 8012626. PMID 33790361.
- ^ McLaughlin, Tim (6 January 2022). "Harmful soot unchecked as Big Oil battles EPA over testing". Reuters.
- ^ Chandrappa, R.; Chandra Kulshrestha, U. (2016). "Air Pollution and Disasters". Sustainable Air Pollution Management. Environmental Science and Engineering. pp. 325–343. doi:10.1007/978-3-319-21596-9_8. ISBN 978-3-319-21595-2. PMC 7121041.
- ^ "Sand, Dust and Particulates Public Health".
- ^ Zalakeviciute, Rasa; Mejia, Danilo; Alvarez, Hermel; Bermeo, Xavier; Bonilla-Bedoya, Santiago; Rybarczyk, Yves; Lamb, Brian (2022). "WarImpact on Air Quality in Ukraine". Sustainability. 14 (21): 13832. doi:10.3390/su142113832.
- ^ Xie Y, Li Y, Feng Y, Cheng W, Wang Y (April 2022). "Inhalable microplastics prevails in air: Exploring the size detection limit". Environ Int. 162: 107151. Bibcode:2022EnInt.16207151X. doi:10.1016/j.envint.2022.107151. PMID 35228011.
- ^ Liu C, Li J, Zhang Y, Wang L, Deng J, Gao Y, Yu L, Zhang J, Sun H (July 2019). "Widespread distribution of PET and PC microplastics in dust in urban China and their estimated human exposure". Environ Int. 128: 116–124. Bibcode:2019EnInt.128..116L. doi:10.1016/j.envint.2019.04.024. PMID 31039519.
- ^ a b Hardin M, Kahn R (2 November 2010). "Aerosols and Climate Change".
- ^ "Emissions of air pollutants". 22 February 2023.
- ^ Hawkes N (May 2015). "Air pollution in UK: the public health problem that won't go away". BMJ. 350: h2757. doi:10.1136/bmj.h2757. PMID 26001592. S2CID 40717317.
- ^ Carrington, Damian (16 February 2021). "Wood burning at home now biggest cause of UK particle pollution". The Guardian. Retrieved 13 February 2022.
- ^ "Wood burning heaters and your health - Fact sheets".
- ^ "How to choose and maintain a wood heater - EPA Victoria".
- ^ "How to choose the right wood for your wood heater - EPA Victoria".
- ^ "How to light and maintain your wood heater fire - EPA Victoria".
- ^ "Smoke and the law - EPA Victoria".
- ^ "Simulating the Transport of Aerosols with GEOS-5, GMAO".
- ^ "GMAO - Global Modeling and Assimilation Office Research Site". gmao.gsfc.nasa.gov.
- ^ "Primary and Secondary Sources of Aerosols: Soil dust". Climate Change 2001: Working Group 1. UNEP. 2001. Archived from the original on 28 February 2008. Retrieved 6 February 2008.
- ^ Perraud V, Bruns EA, Ezell MJ, Johnson SN, Yu Y, Alexander ML, et al. (February 2012). "Nonequilibrium atmospheric secondary organic aerosol formation and growth". Proceedings of the National Academy of Sciences of the United States of America. 109 (8): 2836–41. Bibcode:2012PNAS..109.2836P. doi:10.1073/pnas.1119909109. PMC 3286997. PMID 22308444.
- ^ "Primary and Secondary Sources of Aerosols: Sea salt". Climate Change 2001: Working Group 1. UNEP. 2001. Archived from the original on 28 February 2008. Retrieved 6 February 2008.
- ^ Schiffer, J. M.; Mael, L. E.; Prather, K. A.; Amaro, R. E.; Grassian, V. H. (2018). "Sea Spray Aerosol: Where Marine Biology Meets Atmospheric Chemistry". ACS Central Science. 4 (12): 1617–1623. doi:10.1021/acscentsci.8b00674. PMC 6311946. PMID 30648145.
- ^ Int Panis LL (2008). "The Effect of Changing Background Emissions on External Cost Estimates for Secondary Particulates". Open Environmental Sciences. 2: 47–53. doi:10.2174/1876325100802010047.
- ^ "Primary and Secondary Sources of Aerosols: Primary biogenic aerosols". Climate Change 2001: Working Group 1. UNEP. 2001. Archived from the original on 28 February 2008. Retrieved 6 February 2008.
- ^ Barringer, Felicity (18 February 2012). "Scientists Find New Dangers in Tiny but Pervasive Particles in Air Pollution". The New York Times. Retrieved 19 February 2012.
- ^ a b c d "Mongolia: Air Pollution in Ulaanbaatar – Initial Assessment of Current Situations and Effects of Abatement Measures" (PDF). The World Bank. 2010. Archived from the original (PDF) on 19 September 2016.
- ^ a b "Aerosol Size, Earth Observatory". NASA. 31 August 2016.
 This article incorporates text from this source, which is in the public domain.
- ^ "An American Aerosol in Paris". 15 September 2017.
- ^ Goswami A, Barman J, Rajput K, Lakhlani HN (2013). "Behaviour Study of Particulate Matter and Chemical Composition with Different Combustion Strategies". SAE Technical Paper Series. Vol. 1. doi:10.4271/2013-01-2741. Retrieved 17 June 2016.
- ^ "Effect Of Particulate Matter On Plants Climate, Ecosystem and Human Health" (PDF). www.ijates.com. April 2014. Retrieved 3 February 2016.
- ^ "What are PM2.5 filters and why are they effective?". Puraka Masks.
- ^ Chen, J.; Jiang, Z. A.; Chen, J. (2018). "Effect of Inlet Air Volumetric Flow Rate on the Performance of a Two-Stage Cyclone Separator". ACS Omega. 3 (10): 13219–13226. doi:10.1021/acsomega.8b02043. PMC 6644756. PMID 31458040.
- ^ Dominick DalSanto (February 2011). "The Encyclopedia of Dust Collection".
- ^ "Integrated Building Rehabilitation Assistance Scheme".
- ^ "Operation Building Bright 2.0".
- ^ "DEVB - Press Releases: Operation Building Bright launched (with photos, 2009)".
- ^ "Hong Kong watchdog arrests 49 suspects in housing renovation scam involving contracts worth HK$500 million". 6 January 2023.
- ^ "大廈外牆維修,你地會搬走嗎?" [Will you move out because there is building exterior wall repair work?] (in Chinese).
- ^ "買樓難題:大廈維修,住得難頂嗎?" [The problem of buying a house: Is it difficult to live in a building under rehabilitation?] (in Chinese).
- ^ "Operation Building Bright improves living environment of residents (with photos/video)".
- ^ a b "Hong Kong eLegislation, AIR POLLUTION CONTROL (CONSTRUCTION DUST) REGULATION (Cap.311 section 43) 16 June 1997, L.N. 304 of 1997".
- ^ "Monitoring by Control Technique - Wet Scrubber For Particulate Matter". 25 May 2016.
- ^ "Monitoring by Control Technique - Electrostatic Precipitators". 24 May 2016.
- ^ "Enforcement Activities and Statistics under the Air Pollution Control Ordinance and the Ozone Layer Protection Ordinance 2021".
- ^ "Construction contractor fined for carrying out building demolition work in Shek O without appropriate dust control measures".
- ^ "Pollution Problems & Practical Solutions".
- ^ "Delhi Govt To Impose Fines On Violation Of Anti-Dust Norms". 6 October 2022.
- ^ "Management Regulations for Construction Project Air Pollution Control Facilities".
- ^ "Revised GRAP to deal with adverse air quality scenario".
- ^ "Achievements in environmental pollution control on construction activities, 2004".
- ^ "Particulate Matter in the United Kingdom Summary" (PDF). Air Quality Expert Group. Defra. 2005. Retrieved 28 June 2023.
- ^ "Condensation particle counters". Center for Atmospheric Science. University of Manchester. Retrieved 5 July 2023.
- ^ Department for Environment, Food and Rural Affairs (Defra) webmaster@defra gsi gov uk. "Particle Numbers and Concentrations Network- Defra, UK". uk-air.defra.gov.uk.
- ^ Gilfrich, J; Burkhalter, P; Birks, L (1973). "X-ray spectrometry for particulate air pollution—a quantitative comparison of techniques". Anal Chem. 45 (12): 2002–9. doi:10.1021/ac60334a033. PMID 4762375.
- ^ Forster, Piers M.; Smith, Christopher J.; Walsh, Tristram; Lamb, William F.; et al. (2023). "Indicators of Global Climate Change 2022: annual update of large-scale indicators of the state of the climate system and human influence" (PDF). Earth System Science Data. 15 (6). Copernicus Programme: 2295–2327. Bibcode:2023ESSD...15.2295F. doi:10.5194/essd-15-2295-2023. Fig. 2(a).
- ^ a b Haywood, James; Boucher, Olivier (November 2000). "Estimates of the direct and indirect radiative forcing due to tropospheric aerosols: A review". Reviews of Geophysics. 38 (4): 513–543. Bibcode:2000RvGeo..38..513H. doi:10.1029/1999RG000078. S2CID 129107853.
- ^ a b Twomey S (1977). "The influence of pollution on the shortwave albedo of clouds". Journal of the Atmospheric Sciences. 34 (7): 1149–1152. Bibcode:1977JAtS...34.1149T. doi:10.1175/1520-0469(1977)034<1149:TIOPOT>2.0.CO;2.
- ^ a b c d e f Forster P, Ramaswamy V, Artaxo P, Berntsen T, Betts R, Fahey DW, Haywood J, et al. (October 2007). "Contribution of Working Group I to the Fourth Assessment Report of the Intergovernmental Panel on Climate Change in Climate Change 2007: The Physical Science Basis". In Solomon S, Qin D, Manning M, Chen Z, Marquis M, Averyt KB, Tignor M, Miller HL (eds.). Changes in Atmospheric Constituents and in Radiative Forcing. Cambridge, United Kingdom and New York, NY, US: Cambridge University Press. pp. 129–234.
- ^ "6.7.8 Discussion of Uncertainties". IPCC Third Assessment Report – Climate Change 2001. Archived from the original on 28 February 2002. Retrieved 14 July 2012.
- ^ Charlson RJ, Schwartz SE, Hales JM, Cess RD, Coakley JA, Hansen JE, Hofmann DJ (January 1992). "Climate forcing by anthropogenic aerosols". Science. 255 (5043): 423–30. Bibcode:1992Sci...255..423C. doi:10.1126/science.255.5043.423. PMID 17842894. S2CID 26740611.
- ^ Ackerman AS, Toon OB, Taylor JP, Johnson DW, Hobbs PV, Ferek RJ (2000). "Effects of Aerosols on Cloud Albedo: Evaluation of Twomey's Parameterization of Cloud Susceptibility Using Measurements of Ship Tracks". Journal of the Atmospheric Sciences. 57 (16): 2684–2695. Bibcode:2000JAtS...57.2684A. doi:10.1175/1520-0469(2000)057<2684:EOAOCA>2.0.CO;2.
- ^ Kaufman YJ, Fraser RS (1997). "The Effect of Smoke Particles on Clouds and Climate Forcing". Science. 277 (5332): 1636–1639. doi:10.1126/science.277.5332.1636.
- ^ Ferek RJ, Garrett T, Hobbs PV, Strader S, Johnson D, Taylor JP, Nielsen K, Ackerman AS, Kogan Y, Liu Q, Albrecht BA, et al. (2000). "Drizzle Suppression in Ship Tracks". Journal of the Atmospheric Sciences. 57 (16): 2707–2728. Bibcode:2000JAtS...57.2707F. doi:10.1175/1520-0469(2000)057<2707:DSIST>2.0.CO;2. hdl:10945/46780. S2CID 40273867.
- ^ Rosenfeld D (1999). "TRMM observed first direct evidence of smoke from forest fires inhibiting rainfall". Geophysical Research Letters. 26 (20): 3105–3108. Bibcode:1999GeoRL..26.3105R. doi:10.1029/1999GL006066.
- ^ a b Hansen J, Sato M, Ruedy R (1997). "Radiative forcing and climate response". Journal of Geophysical Research. 102 (D6): 6831–6864. Bibcode:1997JGR...102.6831H. doi:10.1029/96JD03436.
- ^ Ackerman AS, Toon OB, Stevens DE, Heymsfield AJ, Ramanathan V, Welton EJ (May 2000). "Reduction of tropical cloudiness by soot". Science. 288 (5468): 1042–7. Bibcode:2000Sci...288.1042A. doi:10.1126/science.288.5468.1042. PMID 10807573.
- ^ Koren I, Kaufman YJ, Remer LA, Martins JV (February 2004). "Measurement of the effect of Amazon smoke on inhibition of cloud formation". Science. 303 (5662): 1342–5. Bibcode:2004Sci...303.1342K. doi:10.1126/science.1089424. PMID 14988557. S2CID 37347993.
- ^ Riva, Matthieu; Chen, Yuzhi; Zhang, Yue; Lei, Ziying; Olson, Nicole E.; Boyer, Hallie C.; Narayan, Shweta; Yee, Lindsay D.; Green, Hilary S.; Cui, Tianqu; Zhang, Zhenfa; Baumann, Karsten; Fort, Mike; Edgerton, Eric; Budisulistiorini, Sri H. (6 August 2019). "Increasing Isoprene Epoxydiol-to-Inorganic Sulfate Aerosol Ratio Results in Extensive Conversion of Inorganic Sulfate to Organosulfur Forms: Implications for Aerosol Physicochemical Properties". Environmental Science & Technology. 53 (15): 8682–8694. Bibcode:2019EnST...53.8682R. doi:10.1021/acs.est.9b01019. ISSN 0013-936X. PMC 6823602. PMID 31335134.
- ^ Seinfeld, John H.; Pandis, Spyros N (1998). Atmospheric Chemistry and Physics — From Air Pollution to Climate Change. John Wiley and Sons, Inc. ISBN 978-0-471-17816-3
- ^ a b Legras, Bernard; Duchamp, Clair; Sellitto, Pasquale; Podglajen, Aurélien; Carboni, Elisa; Siddans, Richard; Grooß, Jens-Uwe; Khaykin, Sergey; Ploeger, Felix (23 November 2022). "The evolution and dynamics of the Hunga Tonga plume in the stratosphere". Atmospheric Chemistry and Physics. 22 (22): 14957–14970. doi:10.5194/acp-22-14957-2022. S2CID 253875202.
- ^ Charlson, Robert J.; Wigley, Tom M. L. (1994). "Sulfate Aerosol and Climatic Change". Scientific American. 270 (2): 48–57. Bibcode:1994SciAm.270b..48C. doi:10.1038/scientificamerican0294-48. ISSN 0036-8733. JSTOR 24942590.
- ^ Allen, Bob (6 April 2015). "Atmospheric Aerosols: What Are They, and Why Are They So Important?". NASA. Retrieved 17 April 2023.
- ^ IPCC, 1990: Chapter 1: Greenhouse Gases and Aerosols [R.T. Watson, H. Rodhe, H. Oeschger and U. Siegenthaler]. In: Climate Change: The IPCC Scientific Assessment [J.T.Houghton, G.J.Jenkins and J.J.Ephraums (eds.)]. Cambridge University Press, Cambridge, United Kingdom and New York, NY, USA, pp. 31–34,
- ^ a b c Effects of Acid Rain – Human Health Archived January 18, 2008, at the Wayback Machine. Epa.gov (June 2, 2006). Retrieved on 2013-02-09.
- ^ "Effects of Acid Rain - Surface Waters and Aquatic Animals". US EPA. Archived from the original on 14 May 2009.
- ^ Likens, G. E.; Driscoll, C. T.; Buso, D. C. (1996). "Long-Term Effects of Acid Rain: Response and Recovery of a Forest Ecosystem" (PDF). Science. 272 (5259): 244. Bibcode:1996Sci...272..244L. doi:10.1126/science.272.5259.244. S2CID 178546205. Archived (PDF) from the original on 24 December 2012. Retrieved 9 February 2013.
- ^ Wang, X.; Ding, H.; Ryan, L.; Xu, X. (1 May 1997). "Association between air pollution and low birth weight: a community-based study". Environmental Health Perspectives. 105 (5): 514–20. doi:10.1289/ehp.97105514. ISSN 0091-6765. PMC 1469882. PMID 9222137. S2CID 2707126.
- ^ Tie, X.; et al. (2003). "Effect of sulfate aerosol on tropospheric NOx and ozone budgets: Model simulations and TOPSE evidence". J. Geophys. Res. 108 (D4): 8364. Bibcode:2003JGRD..108.8364T. doi:10.1029/2001JD001508.
- ^ Clean Air Act Reduces Acid Rain In Eastern United States Archived August 8, 2018, at the Wayback Machine, ScienceDaily, September 28, 1998
- ^ "Air Emissions Trends – Continued Progress Through 2005". U.S. Environmental Protection Agency. 8 July 2014. Archived from the original on 17 March 2007. Retrieved 17 March 2007.
- ^ Moses, Elizabeth; Cardenas, Beatriz; Seddon, Jessica (25 February 2020). "The Most Successful Air Pollution Treaty You've Never Heard Of".
- ^ Stanhill, G.; S. Cohen (2001). "Global dimming: a review of the evidence for a widespread and significant reduction in global radiation with discussion of its probable causes and possible agricultural consequences". Agricultural and Forest Meteorology. 107 (4): 255–278. Bibcode:2001AgFM..107..255S. doi:10.1016/S0168-1923(00)00241-0.
- ^ Cohen, Shabtai; Stanhill, Gerald (1 January 2021), Letcher, Trevor M. (ed.), "Chapter 32 – Changes in the Sun's radiation: the role of widespread surface solar radiation trends in climate change: dimming and brightening", Climate Change (Third Edition), Elsevier, pp. 687–709, doi:10.1016/b978-0-12-821575-3.00032-3, ISBN 978-0-12-821575-3, S2CID 234180702, retrieved 26 April 2023
- ^ "Global 'Sunscreen' Has Likely Thinned, Report NASA Scientists". NASA. 15 March 2007.
- ^ "A bright sun today? It's down to the atmosphere". The Guardian. 2017. Archived from the original on 20 May 2017. Retrieved 19 May 2017.
- ^ Seneviratne, S.I.; Zhang, X.; Adnan, M.; Badi, W.; Dereczynski, C.; Di Luca, A.; Ghosh, S.; Iskandar, I.; Kossin, J.; Lewis, S.; Otto, F.; Pinto, I.; Satoh, M.; Vicente-Serrano, S. M.; Wehner, M.; Zhou, B. (2021). Masson-Delmotte, V.; Zhai, P.; Piran, A.; Connors, S.L.; Péan, C.; Berger, S.; Caud, N.; Chen, Y.; Goldfarb, L. (eds.). "Weather and Climate Extreme Events in a Changing Climate" (PDF). Climate Change 2021: The Physical Science Basis. Contribution of Working Group I to the Sixth Assessment Report of the Intergovernmental Panel on Climate Change. 2021: 1238. Bibcode:2021AGUFM.U13B..05K. doi:10.1017/9781009157896.007.
- ^ Gillett, Nathan P.; Kirchmeier-Young, Megan; Ribes, Aurélien; Shiogama, Hideo; Hegerl, Gabriele C.; Knutti, Reto; Gastineau, Guillaume; John, Jasmin G.; Li, Lijuan; Nazarenko, Larissa; Rosenbloom, Nan; Seland, Øyvind; Wu, Tongwen; Yukimoto, Seiji; Ziehn, Tilo (18 January 2021). "Constraining human contributions to observed warming since the pre-industrial period" (PDF). Nature Climate Change. 11 (3): 207–212. Bibcode:2021NatCC..11..207G. doi:10.1038/s41558-020-00965-9. S2CID 231670652.
- ^ IPCC, 2021: Summary for Policymakers. In: Climate Change 2021: The Physical Science Basis. Contribution of Working Group I to the Sixth Assessment Report of the Intergovernmental Panel on Climate Change [Masson-Delmotte, V., P. Zhai, A. Pirani, S.L. Connors, C. Péan, S. Berger, N. Caud, Y. Chen, L. Goldfarb, M.I. Gomis, M. Huang, K. Leitzell, E. Lonnoy, J.B.R. Matthews, T.K. Maycock, T. Waterfield, O. Yelekçi, R. Yu, and B. Zhou (eds.)]. Cambridge University Press, Cambridge, United Kingdom and New York, NY, USA, pp. 3–32, doi:10.1017/9781009157896.001.
- ^ Andrew, Tawana (27 September 2019). "Behind the Forecast: How clouds affect temperatures". Science Behind the Forecast. LOUISVILLE, Ky. (WAVE). Retrieved 4 January 2023.
- ^ McCoy, Daniel T.; Field, Paul; Gordon, Hamish; Elsaesser, Gregory S.; Grosvenor, Daniel P. (6 April 2020). "Untangling causality in midlatitude aerosol–cloud adjustments". Atmospheric Chemistry and Physics. 20 (7): 4085–4103. Bibcode:2020ACP....20.4085M. doi:10.5194/acp-20-4085-2020.
- ^ Rosenfeld, Daniel; Zhu, Yannian; Wang, Minghuai; Zheng, Youtong; Goren, Tom; Yu, Shaocai (2019). "Aerosol-driven droplet concentrations dominate coverage and water of oceanic low level clouds" (PDF). Science. 363 (6427): eaav0566. doi:10.1126/science.aav0566. PMID 30655446. S2CID 58612273.
- ^ Glassmeier, Franziska; Hoffmann, Fabian; Johnson, Jill S.; Yamaguchi, Takanobu; Carslaw, Ken S.; Feingold, Graham (29 January 2021). "Aerosol-cloud-climate cooling overestimated by ship-track data". Science. 371 (6528): 485–489. Bibcode:2021Sci...371..485G. doi:10.1126/science.abd3980. PMID 33510021.
- ^ Manshausen, Peter; Watson-Parris, Duncan; Christensen, Matthew W.; Jalkanen, Jukka-Pekka; Stier, Philip Stier (7 March 2018). "Invisible ship tracks show large cloud sensitivity to aerosol". Nature. 610 (7930): 101–106. doi:10.1038/s41586-022-05122-0. PMC 9534750. PMID 36198778.
- ^ Jongebloed, U. A.; Schauer, A. J.; Cole-Dai, J.; Larrick, C. G.; Wood, R.; Fischer, T. P.; Carn, S. A.; Salimi, S.; Edouard, S. R.; Zhai, S.; Geng, L.; Alexander, B. (2 January 2023). "Underestimated Passive Volcanic Sulfur Degassing Implies Overestimated Anthropogenic Aerosol Forcing". Geophysical Research Letters. 50 (1): e2022GL102061. Bibcode:2023GeoRL..5002061J. doi:10.1029/2022GL102061. S2CID 255571342.
- ^ Visioni, Daniele; Slessarev, Eric; MacMartin, Douglas G; Mahowald, Natalie M; Goodale, Christine L; Xia, Lili (1 September 2020). "What goes up must come down: impacts of deposition in a sulfate geoengineering scenario". Environmental Research Letters. 15 (9): 094063. Bibcode:2020ERL....15i4063V. doi:10.1088/1748-9326/ab94eb. ISSN 1748-9326.
- ^ Andrew Charlton-Perez & Eleanor Highwood. "Costs and benefits of geo-engineering in the Stratosphere" (PDF). Archived from the original (PDF) on 14 January 2017. Retrieved 17 February 2009.
- ^ Trisos, Christopher H.; Geden, Oliver; Seneviratne, Sonia I.; Sugiyama, Masahiro; van Aalst, Maarten; Bala, Govindasamy; Mach, Katharine J.; Ginzburg, Veronika; de Coninck, Heleen; Patt, Anthony (2021). "Cross-Working Group Box SRM: Solar Radiation Modification" (PDF). Climate Change 2021: The Physical Science Basis. Contribution of Working Group I to the Sixth Assessment Report of the Intergovernmental Panel on Climate Change. 2021: 1238. Bibcode:2021AGUFM.U13B..05K. doi:10.1017/9781009157896.007.
- ^ Bond, T. C. (2013). "Bounding the role of black carbon in the climate system: A scientific assessment". Journal of Geophysical Research: Atmospheres. 118 (11): 5380–5552. Bibcode:2013JGRD..118.5380B. doi:10.1002/jgrd.50171.
- ^ "1600 Eruption Caused Global Disruption" Archived 15 February 2011 at the Wayback Machine, Geology Times, 25 April 2008, accessed 13 November 2010
- ^ Andrea Thompson, "Volcano in 1600 caused global disruption", NBC News, 5 May 2008, accessed 13 November 2010
- ^ "The 1600 eruption of Huaynaputina in Peru caused global disruption" Archived 28 April 2010 at the Wayback Machine, Science Centric
- ^ McCormick, M. Patrick; Thomason, Larry W.; Trepte, Charles R. (February 1995). "Atmospheric effects of the Mt Pinatubo eruption". Nature. 373 (6513): 399–404. Bibcode:1995Natur.373..399M. doi:10.1038/373399a0. S2CID 46437912.
- ^ Stowe LL, Carey RM, Pellegrino PP (1992). "Monitoring the Mt. Pinatubo aerosol layer with NOAA/11 AVHRR data". Geophysical Research Letters (Submitted manuscript). 19 (2): 159–162. Bibcode:1992GeoRL..19..159S. doi:10.1029/91GL02958.
- ^ Perkins, Sid (4 March 2013). "Earth Not So Hot Thanks to Volcanoes". Science. doi:10.1126/article.26322 (inactive 31 January 2024).
{{cite journal}}: CS1 maint: DOI inactive as of January 2024 (link) - ^ Neely III RR, Toon OB, Solomon S, Vernier JP, Alvarez C, English JM, Rosenlof KH, Mills MJ, Bardeen CG, Daniel JS, Thayer JP (2013). "Recent anthropogenic increases in SO2 from Asia have minimal impact on stratospheric aerosol". Geophysical Research Letters. 40 (5): 999–1004. Bibcode:2013GeoRL..40..999N. doi:10.1002/grl.50263. hdl:1721.1/85851. S2CID 54922537.
moderate volcanic eruptions, rather than anthropogenic influences, are the primary source of the observed increases in stratospheric aerosol.
- ^ a b Chung CE, Ramanathan V (2006). "Weakening of North Indian SST Gradients and the Monsoon Rainfall in India and the Sahel". Journal of Climate. 19 (10): 2036–2045. Bibcode:2006JCli...19.2036C. doi:10.1175/JCLI3820.1. S2CID 10435613.
- ^ "Pollutants and Their Effect on the Water and Radiation Budgets". Archived from the original on 16 December 2008.
- ^ "Australian rainfall and Asian aerosols" (PDF). Archived from the original (PDF) on 16 June 2012.
- ^ Region 4: Laboratory and Field Operations – PM 2.5 (2008).PM 2.5 Objectives and History. U.S. Environmental Protection Agency.
- ^ Balmes, John R.; Fine, Jonathan M.; Sheppard, Dean (November 1987). "Symptomatic Bronchoconstriction after Short-Term Inhalation of Sulfur Dioxide". American Review of Respiratory Disease. 136 (5): 1117–1121. doi:10.1164/ajrccm/136.5.1117. PMID 3674573.
- ^ Nieuwenhuijsen, M.J. (2003). Exposure Assessment in Occupational and Environmental Epidemiology. London: Oxford University Press.[page needed]
- ^ "Pollution Particles Lead to Higher Heart Attack Risk". Bloomberg L.P. 17 January 2008. Archived from the original on 29 June 2011.
The pollutants, abundant in urban areas, are less than 0.18 micrometers in size and cause four times more artery buildup than particles four times larger, said Jesus Araujo, director of environmental cardiology at University of California, Los Angeles.
- ^ Araujo, Jesus A.; et al. (17 January 2008). "Ambient Particulate Pollutants in the Ultrafine Range Promote Early Atherosclerosis and Systemic Oxidative Stress". Circulation Research. 102 (5): 589–596. doi:10.1161/CIRCRESAHA.107.164970. PMC 3014059. PMID 18202315.
- ^ Hennig, Frauke; Quass, Ulrich; Hellack, Bryan; Küpper, Miriam; Kuhlbusch, Thomas A. J.; Stafoggia, Massimo; Hoffmann, Barbara (February 2018). "Ultrafine and Fine Particle Number and Surface Area Concentrations and Daily Cause-Specific Mortality in the Ruhr Area, Germany, 2009–2014". Environmental Health Perspectives. 126 (2): 027008. doi:10.1289/EHP2054. ISSN 0091-6765. PMC 6066351. PMID 29467106.
- ^ De Jesus, Alma Lorelei; et al. (2019). "Ultrafine particles and PM2.5 in the air of cities around the world: Are they representative of each other?". Environment International. 129: 118–135. doi:10.1016/j.envint.2019.05.021. PMID 31125731. S2CID 164216753.
- ^ Lippmann, M., Cohen, B.S., Schlesinger, R.S. (2003). Environmental Health Science. New York: Oxford University Press.[page needed]
- ^ "Scattering Matrix for Typical Urban Anthropogenic Origin Cement Dust and Discrimination of Representative Atmospheric Particulates".
- ^ "The dangers of a scrap yard fire in your community". 10 October 2022.
- ^ "Cargo boat fire put out in Hong Kong's Victoria Harbour after burning for 15 hours and sending fumes across city". 3 June 2021.
- ^ "Stench from burning metal-waste ship blows across HK".
- ^ "Electric Arc Furnace (EAF) Slag". 3 June 2021.
- ^ Nair, Abhilash T.; Mathew, Aneesh; a r, Archana; Akbar, M Abdul (2022). "Use of hazardous electric arc furnace dust in the construction industry: A cleaner production approach". Journal of Cleaner Production. 377: 134282. doi:10.1016/j.jclepro.2022.134282. S2CID 252553231.
- ^ "Sustainability".
- ^ "Hong Kong Housing Authority Sustainability Report 2012/13" (PDF). Archived from the original (PDF) on 28 June 2023.
- ^ "Hong Kong Housing Authority - Environmental Report 2020/21". Archived from the original on 28 June 2023.
- ^ "Cement industry news from Global Cement". Archived from the original on 3 December 2022.
- ^ "黑水泥厂"围城" 打假队一年揪出13家" [City "besieged" with dishonest cement factories, anti-counterfeiting teams found 13 of them in one year] (in Chinese).
- ^ "Growing Importance of Slag Cement in the Global Cement Industry". 6 July 2022.
- ^ "房市新制大調查 爐渣屋掰 2021年起禁用爐渣" [A look into the property market new regulations. No more slag house. Slag will be banned from 2021] (in Chinese). 10 December 2020.
- ^ "新版預售屋契約禁用「煉鋼爐碴」 建商違規將挨罰" [The new version of the pre-sale house contract prohibits "steelmaking furnace slag" and builders will be fined for violations] (in Chinese). 8 May 2019.
- ^ "Welding - Fumes And Gases, OSH Answers". 10 February 2023.
- ^ Li Y, Chen J, Bu S, Wang S, Geng X, Guan G, Zhao Q, Ao L, Qu W, Zheng Y, Jin Y, Tang J (May 2021). "Blood lead levels and their associated risk factors in Chinese adults from 1980 to 2018". Ecotoxicol Environ Saf. 218: 112294. Bibcode:2021EcoES.21812294L. doi:10.1016/j.ecoenv.2021.112294. PMID 33984660.
- ^ Han Z, Guo X, Zhang B, Liao J, Nie L (June 2018). "Blood lead levels of children in urban and suburban areas in China (1997-2015): Temporal and spatial variations and influencing factors". Sci Total Environ. 625: 1659–1666. Bibcode:2018ScTEn.625.1659H. doi:10.1016/j.scitotenv.2017.12.315. PMID 29996461. S2CID 51617692.
- ^ Ren, J.; Tang, M.; Novoselac, A. (2022). "Experimental study to quantify airborne particle deposition onto and resuspension from clothing using a fluorescent-tracking method". Building and Environment. 209: 108580. Bibcode:2022BuEnv.20908580R. doi:10.1016/j.buildenv.2021.108580. PMC 8620412. PMID 34848915.
- ^ "地盤工滿身泥衣鞋入茶餐廳 網民批成身水泥累慘清潔工:做死阿姐". 香港01 (in Chinese). 20 July 2023. Retrieved 14 August 2023.
- ^ Ostro, B.; Tobias, A.; Querol, X.; Alastuey, A.; Amato, F.; Pey, J.; Pérez, N.; Sunyer, J. (2011). "The effects of particulate matter sources on daily mortality: a case-crossover study of Barcelona, Spain". Environmental Health Perspectives. 119 (12): 1781–1787. doi:10.1289/ehp.1103618. PMC 3261985. PMID 21846610.
- ^ "10-year Hospital Development Plan".
- ^ "Architectural Services Department - Capital Projects Under Construction".
- ^ Renard, J. B.; Surcin, J.; Annesi-Maesano, I.; Delaunay, G.; Poincelet, E.; Dixsaut, G. (2022). "Relation between PM2.5 pollution and Covid-19 mortality in Western Europe for the 2020–2022 period". The Science of the Total Environment. 848: 157579. Bibcode:2022ScTEn.848o7579R. doi:10.1016/j.scitotenv.2022.157579. PMC 9310379. PMID 35901896.
- ^ Perone, Gaetano (2022). "Assessing the impact of long-term exposure to nine outdoor air pollutants on COVID-19 spatial spread and related mortality in 107 Italian provinces". Scientific Reports. 12 (1): 13317. Bibcode:2022NatSR..1213317P. doi:10.1038/s41598-022-17215-x. PMC 9349267. PMID 35922645.
- ^ Kiser, Daniel; Elhanan, Gai; Metcalf, William J.; Schnieder, Brendan; Grzymski, Joseph J. (2021). "SARS-CoV-2 test positivity rate in Reno, Nevada: Association with PM2.5 during the 2020 wildfire smoke events in the western United States". Journal of Exposure Science & Environmental Epidemiology. 31 (5): 797–803. doi:10.1038/s41370-021-00366-w. PMC 8276229. PMID 34257389.
- ^ Solimini, Angelo; Filipponi, F.; Fegatelli, D. Alunni; Caputo, B.; De Marco, C. M.; Spagnoli, A.; Vestri, A. R. (2021). "A global association between Covid-19 cases and airborne particulate matter at regional level". Scientific Reports. 11 (1): 6256. doi:10.1038/s41598-021-85751-z. PMC 7973572. PMID 33737616.
- ^ "With metals and maybe even coronavirus, wildfire smoke is more dangerous than you think". Los Angeles Times. 22 July 2021.
- ^ "Silicosis, OSH Answers Fact Sheets". 13 June 2023.
- ^ Preventing Silicosis and Deaths From Sandblasting (Report). Centers for Disease Control and Prevention. 1992. doi:10.26616/NIOSHPUB92102.
- ^ a b Flores-Pajot, Marie-Claire; Ofner, Marianna; Do, Minh T.; Lavigne, Eric; Villeneuve, Paul J. (November 2016). "Childhood autism spectrum disorders and exposure to nitrogen dioxide, and particulate matter air pollution: A review and meta-analysis". Environmental Research. 151: 763–776. Bibcode:2016ER....151..763F. doi:10.1016/j.envres.2016.07.030. PMID 27609410.
- ^ a b Chun, HeeKyoung; Leung, Cheryl; Wen, Shi Wu; McDonald, Judy; Shin, Hwashin H. (January 2020). "Maternal exposure to air pollution and risk of autism in children: A systematic review and meta-analysis". Environmental Pollution. 256: 113307. Bibcode:2020EPoll.25613307C. doi:10.1016/j.envpol.2019.113307. PMID 31733973.
- ^ a b Lam, Juleen; Sutton, Patrice; Kalkbrenner, Amy; Windham, Gayle; Halladay, Alycia; Koustas, Erica; Lawler, Cindy; Davidson, Lisette; Daniels, Natalyn; Newschaffer, Craig; Woodruff, Tracey (21 September 2016). "A Systematic Review and Meta-Analysis of Multiple Airborne Pollutants and Autism Spectrum Disorder". PLOS ONE. 11 (9): e0161851. Bibcode:2016PLoSO..1161851L. doi:10.1371/journal.pone.0161851. PMC 5031428. PMID 27653281.
- ^ a b Weisskopf, Marc G.; Kioumourtzoglou, Marianthi-Anna; Roberts, Andrea L. (December 2015). "Air Pollution and Autism Spectrum Disorders: Causal or Confounded?". Current Environmental Health Reports. 2 (4): 430–439. doi:10.1007/s40572-015-0073-9. PMC 4737505. PMID 26399256.
- ^ a b Fu, Pengfei; Yung, Ken Kin Lam (15 September 2020). "Air Pollution and Alzheimer's Disease: A Systematic Review and Meta-Analysis". Journal of Alzheimer's Disease. 77 (2): 701–714. doi:10.3233/JAD-200483. PMID 32741830. S2CID 220942039.
- ^ a b Tsai, Tsung-Lin; Lin, Yu-Ting; Hwang, Bing-Fang; Nakayama, Shoji F.; Tsai, Chon-Haw; Sun, Xian-Liang; Ma, Chaochen; Jung, Chau-Ren (October 2019). "Fine particulate matter is a potential determinant of Alzheimer's disease: A systemic review and meta-analysis". Environmental Research. 177: 108638. Bibcode:2019ER....17708638T. doi:10.1016/j.envres.2019.108638. PMID 31421449. S2CID 201057595.
- ^ a b c Braithwaite, Isobel; Zhang, Shuo; Kirkbride, James B.; Osborn, David P. J.; Hayes, Joseph F. (December 2019). "Air Pollution (Particulate Matter) Exposure and Associations with Depression, Anxiety, Bipolar, Psychosis and Suicide Risk: A Systematic Review and Meta-Analysis". Environmental Health Perspectives. 127 (12): 126002. doi:10.1289/EHP4595. PMC 6957283. PMID 31850801.
- ^ a b c Lu, Jackson G (April 2020). "Air pollution: A systematic review of its psychological, economic, and social effects". Current Opinion in Psychology. 32: 52–65. doi:10.1016/j.copsyc.2019.06.024. PMID 31557706. S2CID 199147061.
- ^ a b c Liu, Qisijing; Wang, Wanzhou; Gu, Xuelin; Deng, Furong; Wang, Xueqin; Lin, Hualiang; Guo, Xinbiao; Wu, Shaowei (February 2021). "Association between particulate matter air pollution and risk of depression and suicide: a systematic review and meta-analysis". Environmental Science and Pollution Research. 28 (8): 9029–9049. Bibcode:2021ESPR...28.9029L. doi:10.1007/s11356-021-12357-3. PMID 33481201. S2CID 231677095.
- ^ Schraufnagel, Dean E.; Balmes, John R.; Cowl, Clayton T.; De Matteis, Sara; Jung, Soon-Hee; Mortimer, Kevin; Perez-Padilla, Rogelio; Rice, Mary B.; Riojas-Rodriguez, Horacio; Sood, Akshay; Thurston, George D.; To, Teresa; Vanker, Anessa; Wuebbles, Donald J. (February 2019). "Air Pollution and Noncommunicable Diseases". Chest. 155 (2): 409–416. doi:10.1016/j.chest.2018.10.042. PMC 6904855. PMID 30419235.
- ^ Carrington, Damian; McMullan, Lydia; Blight, Garry; Roberts, Simon; Hulley-Jones, Frank (17 May 2019). "Revealed: air pollution may be damaging 'every organ in the body'". The Guardian.
- ^ Cohen AJ, Ross Anderson H, Ostro B, Pandey KD, Krzyzanowski M, Künzli N, et al. (2005). "The global burden of disease due to outdoor air pollution". Journal of Toxicology and Environmental Health. Part A. 68 (13–14): 1301–7. Bibcode:2005JTEHA..68.1301C. doi:10.1080/15287390590936166. PMID 16024504. S2CID 23814778.
- ^ "Air Pollution & Cardiovascular Disease". National Institute of Environmental Health Sciences. Archived from the original on 14 May 2011.
- ^ Lave, Lester B.; Seskin, Eugene P. (June 1973). "An Analysis of the Association between U.S. Mortality and Air Pollution". Journal of the American Statistical Association. 68 (342): 284–290. doi:10.1080/01621459.1973.10482421. eISSN 1537-274X. ISSN 0162-1459.
- ^ Mokdad AH, Marks JS, Stroup DF, Gerberding JL (March 2004). "Actual causes of death in the United States, 2000". JAMA. 291 (10): 1238–45. doi:10.1001/jama.291.10.1238. PMID 15010446. S2CID 14589790.
- ^ a b European Environment Agency (2009). Spatial assessment of PM10 and ozone concentrations in Europe (2005). Publications Office. doi:10.2800/165. ISBN 978-92-9167-988-1.[page needed]
- ^ Lim SS, Vos T, Flaxman AD, Danaei G, Shibuya K, Adair-Rohani H, et al. (December 2012). "A comparative risk assessment of burden of disease and injury attributable to 67 risk factors and risk factor clusters in 21 regions, 1990-2010: a systematic analysis for the Global Burden of Disease Study 2010". Lancet. 380 (9859): 2224–60. doi:10.1016/s0140-6736(12)61766-8. PMC 4156511. PMID 23245609.
- ^ "Air pollution in Europe: These are the worst-hit cities to live in". euronews. 24 December 2021. Retrieved 1 April 2022.
- ^ Laden, F; Neas, L M; Dockery, D W; Schwartz, J (October 2000). "Association of fine particulate matter from different sources with daily mortality in six U.S. cities". Environmental Health Perspectives. 108 (10): 941–947. doi:10.1289/ehp.00108941. PMC 1240126. PMID 11049813.
- ^ Ozkaynak, Haluk; Thurston, George D. (December 1987). "Associations Between 1980 U.S. Mortality Rates and Alternative Measures of Airborne Particle Concentration". Risk Analysis. 7 (4): 449–461. Bibcode:1987RiskA...7..449O. doi:10.1111/j.1539-6924.1987.tb00482.x. PMID 3444932.
- ^ Mailloux, Nicholas A.; Abel, David W.; Holloway, Tracey; Patz, Jonathan A. (16 May 2022). "Nationwide and Regional PM2.5-Related Air Quality Health Benefits From the Removal of Energy-Related Emissions in the United States". GeoHealth. 6 (5): e2022GH000603. Bibcode:2022GHeal...6..603M. doi:10.1029/2022GH000603. PMC 9109601. PMID 35599962.
- ^ Carrington, Damian (17 February 2021). "Air pollution significantly raises risk of infertility, study finds". The Guardian.
- ^ Zhang M, Mueller NT, Wang H, Hong X, Appel LJ, Wang X (July 2018). "Maternal Exposure to Ambient Particulate Matter ≤2.5 μm During Pregnancy and the Risk for High Blood Pressure in Childhood". Hypertension. 72 (1): 194–201. doi:10.1161/HYPERTENSIONAHA.117.10944. PMC 6002908. PMID 29760154.
- ^ Sapkota A, Chelikowsky AP, Nachman KE, Cohen AJ, Ritz B (1 December 2012). "Exposure to particulate matter and adverse birth outcomes: a comprehensive review and meta-analysis". Air Quality, Atmosphere & Health. 5 (4): 369–381. Bibcode:2012AQAH....5..369S. doi:10.1007/s11869-010-0106-3. S2CID 95781433.
- ^ a b c Sacks J. "2009 Final Report: Integrated Science Assessment for Particulate Matter". US EPA National Center for Environmental Assessment, Research Triangle Park Nc, Environmental Media Assessment Group. Retrieved 31 March 2017.
- ^ Erickson AC, Arbour L (26 November 2014). "The shared pathoetiological effects of particulate air pollution and the social environment on fetal-placental development". Journal of Environmental and Public Health. 2014: 901017. doi:10.1155/2014/901017. PMC 4276595. PMID 25574176.
- ^ Lee PC, Talbott EO, Roberts JM, Catov JM, Bilonick RA, Stone RA, et al. (August 2012). "Ambient air pollution exposure and blood pressure changes during pregnancy". Environmental Research. 117: 46–53. Bibcode:2012ER....117...46L. doi:10.1016/j.envres.2012.05.011. PMC 3656658. PMID 22835955.
- ^ Woodruff TJ, Parker JD, Darrow LA, Slama R, Bell ML, Choi H, et al. (April 2009). "Methodological issues in studies of air pollution and reproductive health". Environmental Research. 109 (3): 311–320. Bibcode:2009ER....109..311W. doi:10.1016/j.envres.2008.12.012. PMC 6615486. PMID 19215915.
- ^ Byrne CD, Phillips DI (November 2000). "Fetal origins of adult disease: epidemiology and mechanisms". Journal of Clinical Pathology. 53 (11): 822–8. doi:10.1136/jcp.53.11.822. PMC 1731115. PMID 11127263.
- ^ Barker DJ (November 1990). "The fetal and infant origins of adult disease". BMJ. 301 (6761): 1111. doi:10.1136/bmj.301.6761.1111. PMC 1664286. PMID 2252919.
- ^ Pope CA, Burnett RT, Thun MJ, Calle EE, Krewski D, Ito K, Thurston GD (March 2002). "Lung cancer, cardiopulmonary mortality, and long-term exposure to fine particulate air pollution". JAMA. 287 (9): 1132–41. doi:10.1001/jama.287.9.1132. PMC 4037163. PMID 11879110.
- ^ EU's PM2.5 Limit Festering: New Study Linked PM with Heart Attack Cesaroni G, Forastiere F, Stafoggia M, Andersen ZJ, Badaloni C, Beelen R, et al. (January 2014). "Long term exposure to ambient air pollution and incidence of acute coronary events: prospective cohort study and meta-analysis in 11 European cohorts from the ESCAPE Project". BMJ. 348: f7412. doi:10.1136/bmj.f7412. PMC 3898420. PMID 24452269.
- ^ Hussey SJ, Purves J, Allcock N, Fernandes VE, Monks PS, Ketley JM, et al. (May 2017). "Air pollution alters Staphylococcus aureus and Streptococcus pneumoniae biofilms, antibiotic tolerance and colonisation" (PDF). Environmental Microbiology. 19 (5): 1868–1880. Bibcode:2017EnvMi..19.1868H. doi:10.1111/1462-2920.13686. PMC 6849702. PMID 28195384.
- ^ "National Study Examines Health Risks of Coarse Particle Pollution". www.newswise.com.
- ^ "Mongolia: Ulaanbaatar Air Pollution Linked to Public Health Crisis".
- ^ Matthews, Dylan (27 December 2021). "How humans could live two years longer". Vox.
- ^ Symons, Angela (15 December 2022). "Suicide rates rise as air quality worsens, study finds". euronews. Retrieved 19 December 2022.
- ^ Fan, Shu-Jun; Heinrich, Joachim; Bloom, Michael S.; Zhao, Tian-Yu; Shi, Tong-Xing; Feng, Wen-Ru; Sun, Yi; Shen, Ji-Chuan; Yang, Zhi-Cong; Yang, Bo-Yi; Dong, Guang-Hui (January 2020). "Ambient air pollution and depression: A systematic review with meta-analysis up to 2019". Science of the Total Environment. 701: 134721. Bibcode:2020ScTEn.701m4721F. doi:10.1016/j.scitotenv.2019.134721. PMID 31715478. S2CID 207944384.
- ^ Maher, Barbara A.; Ahmed, Imad A. M.; Karloukovski, Vassil; MacLaren, Donald A.; Foulds, Penelope G.; Allsop, David; Mann, David M. A.; Torres-Jardón, Ricardo; Calderon-Garciduenas, Lilian (27 September 2016). "Magnetite pollution nanoparticles in the human brain". Proceedings of the National Academy of Sciences. 113 (39): 10797–10801. Bibcode:2016PNAS..11310797M. doi:10.1073/pnas.1605941113. PMC 5047173. PMID 27601646.
- ^ "Parkinson's Disease".
- ^ Kanninen, K. M.; Lampinen, R.; Rantanen, L. M.; Odendaal, L.; Jalava, P.; Chew, S.; White, A. R. (1 June 2020). "Olfactory cell cultures to investigate health effects of air pollution exposure: Implications for neurodegeneration". Neurochemistry International. 136: 104729. doi:10.1016/j.neuint.2020.104729. PMID 32201281. S2CID 214585295 – via ScienceDirect.
- ^ Cohen AJ, Ross Anderson H, Ostro B, Pandey KD, Krzyzanowski M, Künzli N, et al. (2005). "The global burden of disease due to outdoor air pollution". Journal of Toxicology and Environmental Health. Part A. 68 (13–14): 1301–7. Bibcode:2005JTEHA..68.1301C. doi:10.1080/15287390590936166. PMID 16024504. S2CID 23814778.
- ^ Nawrot TS, Perez L, Künzli N, Munters E, Nemery B (February 2011). "Public health importance of triggers of myocardial infarction: a comparative risk assessment". Lancet. 377 (9767): 732–40. doi:10.1016/S0140-6736(10)62296-9. PMID 21353301. S2CID 20168936. "Taking into account the OR and the prevalences of exposure, the highest PAF was estimated for traffic exposure (7.4%)... ":"... [O]dds ratios and frequencies of each trigger were used to compute population-attributable fractions (PAFs), which estimate the proportion of cases that could be avoided if a risk factor were removed. PAFs depend not only on the risk factor strength at the individual level but also on its frequency in the community. ... [T]he exposure prevalence for triggers in the relevant control time window ranged from 0.04% for cocaine use to 100% for air pollution. ... Taking into account the OR and the prevalences of exposure, the highest PAF was estimated for traffic exposure (7.4%) ...
- ^ "Resources and Information" (PDF). ww16.baq2008.org. Archived from the original (PDF) on 17 December 2008.
- ^ a b Smiley, Kevin T. (2019). "Racial and Environmental Inequalities in Spatial Patterns in Asthma Prevalence in the US South". Southeastern Geographer. 59 (4): 389–402. doi:10.1353/sgo.2019.0031. S2CID 210244838. Project MUSE 736789.
- ^ "Erratum: Eur. Phys. J. C.22, 695–705 (2002) – DOI 10.1007/s100520100827 Published online: 7 December 2001". The European Physical Journal C. 24 (4): 665–666. August 2002. Bibcode:2002EPJC...24..665.. doi:10.1007/s10052-002-0987-x. S2CID 195313204.
- ^ a b Mikati, Ihab; Benson, Adam F.; Luben, Thomas J.; Sacks, Jason D.; Richmond-Bryant, Jennifer (1 April 2018). "Disparities in Distribution of Particulate Matter Emission Sources by Race and Poverty Status". American Journal of Public Health. 108 (4): 480–485. doi:10.2105/AJPH.2017.304297. PMC 5844406. PMID 29470121.
- ^ "Urban Air Pollution and Health Inequities: A Workshop Report". Environmental Health Perspectives. 109 (s3): 357–374. 1 June 2001. doi:10.1289/ehp.01109s3357.
- ^ a b c Jervis, Rick; Gomez, Alan (12 October 2020). "Racism turned their neighborhood into 'Cancer Alley.' Now they're dying from COVID-19". USA Today.
- ^ US EPA, OAR (12 November 2018). "How Smoke from Fires Can Affect Your Health". US EPA. Retrieved 26 November 2020.
- ^ Wegesser TC, Pinkerton KE, Last JA (June 2009). "California wildfires of 2008: coarse and fine particulate matter toxicity". Environmental Health Perspectives. 117 (6): 893–7. doi:10.1289/ehp.0800166. PMC 2702402. PMID 19590679.
- ^ Haikerwal A, Akram M, Del Monaco A, Smith K, Sim MR, Meyer M, et al. (July 2015). "Impact of Fine Particulate Matter (PM2.5) Exposure During Wildfires on Cardiovascular Health Outcomes". Journal of the American Heart Association. 4 (7): e001653. doi:10.1161/JAHA.114.001653. PMC 4608063. PMID 26178402.
- ^ Reid CE, Considine EM, Watson GL, Telesca D, Pfister GG, Jerrett M (August 2019). "Associations between respiratory health and ozone and fine particulate matter during a wildfire event". Environment International. 129: 291–298. Bibcode:2019EnInt.129..291R. doi:10.1016/j.envint.2019.04.033. PMID 31146163.
- ^ Haikerwal A, Akram M, Sim MR, Meyer M, Abramson MJ, Dennekamp M (January 2016). "Fine particulate matter (PM2.5 ) exposure during a prolonged wildfire period and emergency department visits for asthma". Respirology. 21 (1): 88–94. doi:10.1111/resp.12613. PMID 26346113. S2CID 22910313.
- ^ DeFlorio-Barker S, Crooks J, Reyes J, Rappold AG (March 2019). "Cardiopulmonary Effects of Fine Particulate Matter Exposure among Older Adults, during Wildfire and Non-Wildfire Periods, in the United States 2008-2010". Environmental Health Perspectives. 127 (3): 37006. doi:10.1289/EHP3860. PMC 6768318. PMID 30875246.
- ^ Jiang, Kevin (27 June 2023). "What is 'smoke brain'? How air pollution can harm our cognition and mental health". Toronto Star.
- ^ Ritchie, Hannah; Roser, Max (2021). "What are the safest and cleanest sources of energy?". Our World in Data. Archived from the original on 15 January 2024. Data sources: Markandya & Wilkinson (2007); UNSCEAR (2008; 2018); Sovacool et al. (2016); IPCC AR5 (2014); Pehl et al. (2017); Ember Energy (2021).
- ^ a b The Guardian, 18 March 2021 "Oil Firms Knew Decades Ago Fossil Fuels Posed Grave Health Risks, Riles Reveal; Exclusive: Documents Seen by Guardian Show Companies Fought Clean-Air Rules Despite Being Aware of Harm Caused by Air Pollution"
- ^ The Guardian "75 Ways Trump Made America Dirtier and the Planet Warmer: In the Past Four Years, Trump has Shredded Environmental Protections for American Lands, Animals and People"
- ^ Union of Concerned Scientists, 27 April 2020 "Oil Industry Ghostwrites Trump's Deadly Anti-Environmental Policies"
- ^ Hogan CM (2010). Emily Monosson and C. Cleveland (ed.). "Abiotic factor". Encyclopedia of Earth. National Council for Science and the Environment.
- ^ Hamra GB, Guha N, Cohen A, Laden F, Raaschou-Nielsen O, Samet JM, et al. (September 2014). "Outdoor particulate matter exposure and lung cancer: a systematic review and meta-analysis". Environmental Health Perspectives. 122 (9): 906–11. doi:10.1289/ehp.1408092. PMC 4154221. PMID 24911630.
- ^ Department of the Environment (25 February 2016). "National Environment Protection (Ambient Air Quality) Measure". Federal Register of Legislation. Retrieved 16 November 2018.
- ^ "Ambient air quality standards" (PDF). Archived (PDF) from the original on 30 April 2013. Retrieved 30 April 2013.
- ^ a b "Air Quality Standards – Environment – European Commission". Ec.europa.eu. Retrieved 1 February 2015.
- ^ "Air Quality Objectives". Environmental Protection Department, Hong Kong. 19 December 2012. Retrieved 27 July 2013.
- ^ "微小粒子状物質(PM2.5)対策|東京都環境局 大気・騒音・振動・悪臭対策". Kankyo.metro.tokyo.jp. Archived from the original on 28 February 2015. Retrieved 1 February 2015.
- ^ "Air Quality Standards" (PDF).
- ^ "Home". airkorea.or.kr.
- ^ "미세먼지 환경기준 선진국 수준 강화...'나쁨' 4배 늘 듯".
- ^ "細懸浮微粒管制". Environmental Protection Administration, ROC. Retrieved 16 November 2015.
- ^ "FEATURE: Air pollution reason for concern: groups - Taipei Times". www.taipeitimes.com. 5 February 2014.
- ^ a b "Pm Naaqs | Us Epa". Epa.gov. Retrieved 1 February 2015.
- ^ "Environmental Protection Agency – Particulate Matter (PM-10)". Epa.gov. 28 June 2006. Retrieved 1 February 2015.
- ^ "WHO global air quality guidelines: particulate matter (PM2.5 and PM10), ozone, nitrogen dioxide, sulfur dioxide and carbon monoxide". www.who.int.
- ^ "WHO global air quality guidelines" (PDF). WHO.
- ^ "Canadian Ambient Air Quality Standards (CAAQS) for Fine Particulate Matter (PM2.5) and Ozone" (PDF). Archived from the original (PDF) on 20 December 2016. Retrieved 11 December 2016.
- ^ "Burn better: Making changes for cleaner air".
- ^ "Guidance for wood burning in London".
- ^ "Log burners: What are the new rules and are they going to be banned?". Independent.co.uk. 6 February 2023.
- ^ "Nanotechnology web page". Department of Toxic Substances Control. 2008. Archived from the original on 1 January 2010.
- ^ a b "Chemical Information Call-In web page". Department of Toxic Substances Control. 2008. Archived from the original on 18 March 2010. Retrieved 28 December 2009.
- ^ Wong J (22 January 2009), Call in letter (PDF), archived from the original (PDF) on 27 January 2017, retrieved 28 December 2009
- ^ "Contact List for CNT January 22 & 26 2009 Document" (PDF). Archived from the original (PDF) on 31 January 2017. Retrieved 28 December 2009.
- ^ "Archived DTSC Nanotechnology Symposia". Department of Toxic Substances Control. Archived from the original on 1 January 2010.
- ^ Chemical Information Call-in: Nanomaterials dtsc.ca.gov Archived 1 January 2010 at the Wayback Machine
- ^ a b c "The Cities Where Air Pollution Has Increased and Decreased the Most since 2019". 20 February 2023.
- ^ "Mapped: New Survey Shows Air Pollution Changes In Cities Around The World". Forbes.
- ^ Oliver Milman (1 April 2015). "Call for action on pollution as emissions linked to respiratory illnesses double". The Guardian. Retrieved 3 April 2015.
emissions of a key pollutant linked to respiratory illness have doubled over the past five years
- ^ Li, Jie; Du, Huiyun; Wang, Zifa; Sun, Yele; Yang, Wenyi; Li, Jianjun; Tang, Xiao; Fu, Pingqing (1 April 2017). "Rapid formation of a severe regional winter haze episode over a mega-city cluster on the North China Plain". Environmental Pollution. 223: 605–615. Bibcode:2017EPoll.223..605L. doi:10.1016/j.envpol.2017.01.063. ISSN 0269-7491. PMID 28159396.
- ^ Zhong, Junting; Zhang, Xiaoye; Gui, Ke; Liao, Jie; Fei, Ye; Jiang, Lipeng; Guo, Lifeng; Liu, Liangke; Che, Huizheng; Wang, Yaqiang; Wang, Deying; Zhou, Zijiang (12 July 2022). "Reconstructing 6-hourly PM2.5 datasets from 1960 to 2020 in China". Earth System Science Data. 14 (7): 3197–3211. Bibcode:2022ESSD...14.3197Z. doi:10.5194/essd-14-3197-2022. ISSN 1866-3508. S2CID 250512127.
- ^ "China: annual PM2.5 levels Beijing 2022". Statista. Retrieved 1 April 2023.
- ^ Consulate General of the United States of America Guangzhou, China (n.d.). "U.S. Consulate Air Quality Monitor and StateAir". U.S. Department of State. Archived from the original on 1 July 2011. Retrieved 24 December 2014.
- ^ "Armed With NASA Data, South Korea Confronts Its Choking Smog". NPR.
- ^ "NASA and NIER study finds that 48% of particulate matter comes from outside S. Korea".
- ^ "China, South Korea build environment cooperation". 26 June 2018.
- ^ "Air pollution chokes Thailand as campaigners call for stricter laws".
- ^ "Air pollution hospitalises 200,000 in one week as fumes, emissions and smoke descend on Thailand". 13 March 2023.
- ^ "Ambient (outdoor) air pollution". www.who.int.
- ^ "Aviation Pollution".
- ^ "Chapter 1 - Fly Ash - An Engineering Material - Fly Ash Facts for Highway Engineers - Recycling - Sustainability - Pavements - Federal Highway Administration". www.fhwa.dot.gov.
- ^ "City Rankings, State of the Air, American Lung Association".
- ^ "The Dirtiest And Cleanest Cities In America (The Worst Will Surprise You)". Forbes.
- ^ "An N95 Mask Is Your Best Defense Against Wildfire Smoke | Time". 7 June 2023.
Further reading edit
Control edit
- "Best Practices for Indoor Air Quality when Remodeling Your Home". US EPA. 7 January 2015.
- "Examples of how to manage dust in the workplace". EPA Victoria.
Health edit
- Carrington, Damian (17 September 2019). "Air pollution particles found on foetal side of placentas – study". TheGuardian.com.
- Liu XQ, Huang J, Song C, Zhang TL, Liu YP, Yu L (2023). "Neurodevelopmental toxicity induced by PM2.5 Exposure and its possible role in Neurodegenerative and mental disorders". Hum Exp Toxicol. 42: 9603271231191436. Bibcode:2023HETox..4291436L. doi:10.1177/09603271231191436. PMID 37537902. S2CID 260485784.
- InsideEPA.com, Study Links Air Toxics To Heart Disease In Mice Amid EPA Controversy[dead link]
- G Invernizzi et al., Particulate matter from tobacco versus diesel car exhaust: an educational perspective. Tobacco Control 13, S.219–221 (2004)
- Hunt, A.; Abraham, J. L.; Judson, B.; Berry, C. L. (2003). "Toxicologic and epidemiologic clues from the characterization of the 1952 London smog fine particulate matter in archival autopsy lung tissues". Environmental Health Perspectives. 111 (9): 1209–1214. doi:10.1289/ehp.6114. PMC 1241576. PMID 12842775.
More edit
- "Particulate Pollution Course". US EPA. 12 September 2014.
- Voiland, Adam. "Aerosols: Tiny Particles, Big Impact." NASA, 2 November 2010, Aerosols: Tiny Particles, Big Impact
- The Intergovernmental Panel on Climate Change (the principal international scientific body on climate change) chapter on atmospheric aerosols and their radiative effects
- Preining, Othmar and E. James Davis (eds.), "History of Aerosol Science," Österreichische Akademie der Wissenschaften, ISBN 3-7001-2915-7 (Pbk.)
- Jelonek Z, Drobniak A, Mastalerz M, Jelonek I (December 2020). "Environmental implications of the quality of charcoal briquettes and lump charcoal used for grilling". Sci Total Environ. 747: 141267. Bibcode:2020ScTEn.747n1267J. doi:10.1016/j.scitotenv.2020.141267. PMID 32777507. S2CID 221100463.
- Hinds, William C., Aerosol Technology: Properties, Behavior, and Measurement of Airborne Particles, Wiley-Interscience, ISBN 0-471-19410-7
- Zangari, Shelby et al., Air quality changes in New York City during the COVID-19 pandemic. Science of the Total Environment 742 (2020)
- NARSTO (2004) Particulate Matter Science for Policy Makers: A NARSTO Assessment. P. McMurry, M. Shepherd, and J. Vickery, eds. Cambridge University Press, Cambridge, England. ISBN 0 52 184287 5.
- "70 years since the great London smog 1952, air quality in a modern context". 5 December 2022.
- "A Major Source of Air Pollution: Farms - The Earth Institute".
- "Hong Kong's illegal barbecue site something to chew on | South China Morning Post". 4 December 2021.
- Alves, Célia A.; Evtyugina, Margarita; Vicente, Estela; Vicente, Ana; Gonçalves, Cátia; Neto, Ana Isabel; Nunes, Teresa; Kováts, Nora (15 September 2022). "Outdoor charcoal grilling: Particulate and gas-phase emissions, organic speciation and ecotoxicological assessment - ScienceDirect". Atmospheric Environment. 285: 119240. doi:10.1016/j.atmosenv.2022.119240. S2CID 249860528.
- Papachristopoulou, Kyriakoula; Raptis, Ioannis-Panagiotis; Gkikas, Antonis; Fountoulakis, Ilias; Masoom, Akriti; Kazadzis, Stelios (2022). "Aerosol optical depth regime over megacities of the world". Atmospheric Chemistry and Physics. 22 (24): 15703–15727. Bibcode:2022ACP....2215703P. doi:10.5194/acp-22-15703-2022.
- Ogasa, Nikk (2021). "Air pollution helps wildfires create their own lightning". Science. doi:10.1126/science.abj6782. S2CID 236389007.
- "The Weight of Numbers: Air Pollution and PM2.5". Undark Magazine. Retrieved 27 September 2019.
- JEFF CHARLTON Pandemic planning: a review of respirator and mask protection levels.
External links edit
Control edit
- Control of dust from construction and demolition activities
- Controlling construction dust with on-tool extraction (4 page PDF with photos)
- Beware of dust - Hilti Canada | Dust control - Hilti Hong Kong
- What is Local Exhaust Ventilation (LEV)?
- Welding fume: protect your workers
- Environmental Toolbox Training Kit from the Hong Kong Construction Association with many illustrated useful tips on particle pollution control. Archived from original on 3 July 2023.
Others edit
- NASA's Earth Minute: My Name is Aerosol
- SARS-CoV-2 Aerosol Mechanisms, The Aerosol Society
- Current global map of PM1 distribution | Current global map of PM1 and PM2.5 distribution | Current global map of PM1, PM2.5 and PM10 distribution
- Current global map of the aerosol optical thickness of organic matter in green light
- Real time air quality | About
- Air quality map | About
- Pollution Facts by Air Quality Life Index
- Health Effects of Air Pollutants. EPD HK. *Archived from original on 5 January 2014.
- Sources of Respirable and Fine Suspended Particulates. EPD HK. *Archived from original on 21 September 2024.
- Precision Environmental Health's role in preventing disease