gop: c83747ff
dem: 4894a7ff
| |||||||||||||
| |||||||||||||
.jpg)
.jpg)
| |||||||||||||||||||||||||||||||||||||||||||||||||||||||||||||
538 members of the Electoral College 270 electoral votes needed to win | |||||||||||||||||||||||||||||||||||||||||||||||||||||||||||||
|---|---|---|---|---|---|---|---|---|---|---|---|---|---|---|---|---|---|---|---|---|---|---|---|---|---|---|---|---|---|---|---|---|---|---|---|---|---|---|---|---|---|---|---|---|---|---|---|---|---|---|---|---|---|---|---|---|---|---|---|---|---|
| |||||||||||||||||||||||||||||||||||||||||||||||||||||||||||||
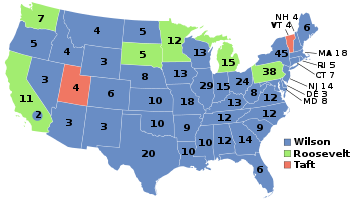 Presidential election results map. Blue denotes those won by Clinton/Bayh, light green denotes those won by Perot/Wilson, red denotes states won by Bush/Sovern. Numbers indicate the number of electoral votes allotted to each state. | |||||||||||||||||||||||||||||||||||||||||||||||||||||||||||||
| |||||||||||||||||||||||||||||||||||||||||||||||||||||||||||||
.jpg)

.jpg)
carter 88 edit
| |||||||||||||||||||||||||||||
538 members of the Electoral College 270 electoral votes needed to win | |||||||||||||||||||||||||||||
|---|---|---|---|---|---|---|---|---|---|---|---|---|---|---|---|---|---|---|---|---|---|---|---|---|---|---|---|---|---|
| Turnout | 52.8%[1] | ||||||||||||||||||||||||||||
| |||||||||||||||||||||||||||||
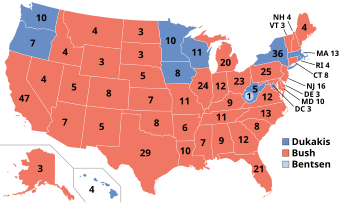 Presidential election results map. Red denotes states won by Bush/Quayle and blue denotes those won by Carter/Jackson. Numbers indicate electoral votes cast by each state and the District of Columbia. | |||||||||||||||||||||||||||||
| |||||||||||||||||||||||||||||
.jpg)

This article needs additional citations for verification. (June 2016) |
| |||||||||||||||||
| |||||||||||||||||
 County results Harris: 50–60% 60–70% 70–80% 80–90% >90% Bell: 50–60% | |||||||||||||||||
| |||||||||||||||||


The 1982 Georgia gubernatorial election was held on November 2, 1982. Joe Frank Harris was elected as the 78th Governor of Georgia.
tx:
connally/anderson: 10
connally/crane: 4
connally/biden: 2
mcgovern/bush: 3
reagan/bush: 1
connally/dole: 8
perot/bush: 1
connally: 24
mcgovern: 3
reagan: 1
perot: 1
anderson: 10
dole: 8
crane: 4
bush: 5
biden: 2
| |||||||||||||||||
| |||||||||||||||||
 County results Fowler: 50–60% 60–70% 70–80% Mattingly: 50–60% 60–70% | |||||||||||||||||
| |||||||||||||||||

swagballer69
| |||||||||||||||||||||||||
| |||||||||||||||||||||||||


Abominable Snowman | |||||||||||||||||||||||||

_(cropped).jpg)
_(cropped).jpg)
The 2020 Iowa Republican presidential caucuses took place on Monday, February 3, 2020, as the first caucus or primary in the Republican Party presidential primaries for the 2020 presidential election.[3] The Iowa caucuses are a closed caucus, with Iowa awarding 40 pledged delegates to the Republican National Convention, allocated on the basis of the results of the caucuses. Incumbent president Donald Trump received about 97 percent of the vote to clinch 39 delegates, while Bill Weld received enough votes to clinch 1 delegate.
| Beaver | 49.3% | 24.1% | 30.4% |
| Box Elder | 49.6% | 38.4% | 12.3% |
| Cache | 52.0% | 34.6% | 15.0% |
| Carbon | 23.1% | 31.2% | 49.6% |
| Daggett | 38.9% | 35.0% | 26.4% |
| Davis | 48.1% | 38.1% | 17.2% |
| Duchesne | 43.4% | 35.4% | 14.7% |
| Emery | 36.4% | 33.7% | 27.7% |
| Garfield | 62.3% | 26.4% | 13.4% |
| Grand | 32.9% | 38.2% | 32.5% |
| Iron | 59.9% | 26.6% | 14.2% |
| Juab | 42.7% | 27.8% | 26.2% |
| Kane | 57.1% | 33.1% | 11.4% |
| Millard | 52.3% | 30.8% | 13.4% |
| Morgan | 45.5% | 37.5% | 15.5% |
| Piute | 57.0% | 27.9% | 21.2% |
| Rich | 59.9% | 30.0% | 16.4% |
| Salt Lake | 36.8% | 37.4% | 30.2% |
| San Juan | 46.2% | 21.8% | 36.6% |
| Sanpete | 44.8% | 34.6% | 18.3% |
| Sevier | 50.5% | 35.2% | 11.4% |
| Summit | 33.3% | 41.1% | 31.4% |
| Tooele | 35.8% | 37.8% | 30.6% |
| Uintah | 45.1% | 37.1% | 16.5% |
| Utah | 56.8% | 31.2% | 11.8% |
| Wasatch | 42.1% | 37.0% | 23.8% |
| Washington | 52.7% | 30.0% | 14.5% |
| Wayne | 57.6% | 29.0% | 18.1% |
| Weber | 39.3% | 38.6% | 24.9% |
| Totals | 29.1% | 44.3% | 22.3% |
|---|
| Nebraska † | 28.2 | 32.3 | 32.1 |
| Nebraska-1 | 31.4 | 28.9 | 32.7 |
| Nebraska-2 | 31.2 | 33.2 | 28.6 |
| Nebraska-3 | 22.3 | 35.4 | 35.3 |
- ^ "National General Election VEP Turnout Rates, 1789-Present". United States Election Project. CQ Press.
- ^ Matthew Choi (October 31, 2019). "Trump, a symbol of New York, is officially a Floridian now". Politico. Retrieved February 3, 2020.
- ^ Forgey, Quint (February 3, 2020). "Trump wins Iowa GOP caucuses". Politico. Retrieved February 3, 2020.
| ||
538 members of the Electoral College 270 electoral votes needed to win | ||
|---|---|---|
|
| ||
nigh edit
| |||||||||||||||||||||||||||||
538 members of the Electoral College 270 electoral votes needed to win | |||||||||||||||||||||||||||||
|---|---|---|---|---|---|---|---|---|---|---|---|---|---|---|---|---|---|---|---|---|---|---|---|---|---|---|---|---|---|
| |||||||||||||||||||||||||||||
| Presidential election results map. Brown denotes states won by Nigh/Graham and orange denotes those won by Laxalt/Cheney. Numbers indicate electoral votes cast by each state and the District of Columbia. | |||||||||||||||||||||||||||||
| |||||||||||||||||||||||||||||
jawn
| |||||||||||||||||||||||||||||
538 members of the Electoral College 270 electoral votes needed to win | |||||||||||||||||||||||||||||
|---|---|---|---|---|---|---|---|---|---|---|---|---|---|---|---|---|---|---|---|---|---|---|---|---|---|---|---|---|---|
| |||||||||||||||||||||||||||||
| Presidential election results map. Brown denotes states won by Nigh/Graham and orange denotes those won by Perot/du Pont. Numbers indicate electoral votes cast by each state and the District of Columbia. | |||||||||||||||||||||||||||||
| |||||||||||||||||||||||||||||
| |||||||||||||||||||||||||||||
538 members of the Electoral College 270 electoral votes needed to win | |||||||||||||||||||||||||||||
|---|---|---|---|---|---|---|---|---|---|---|---|---|---|---|---|---|---|---|---|---|---|---|---|---|---|---|---|---|---|
| |||||||||||||||||||||||||||||
| Presidential election results map. Red denotes states won by Pataki/Bush and blue denotes those won by Pence/Bumpers. Numbers indicate electoral votes cast by each state and the District of Columbia. | |||||||||||||||||||||||||||||
| |||||||||||||||||||||||||||||
ford 80 edit
| |||||||||||||||||||||||||||||||||||||
538 members of the Electoral College 270 electoral votes needed to win | |||||||||||||||||||||||||||||||||||||
|---|---|---|---|---|---|---|---|---|---|---|---|---|---|---|---|---|---|---|---|---|---|---|---|---|---|---|---|---|---|---|---|---|---|---|---|---|---|
| Turnout | 54.2%[1] | ||||||||||||||||||||||||||||||||||||
| |||||||||||||||||||||||||||||||||||||
 Presidential election results map. Blue denotes states won by Ford/Connally and green denotes those won by Carter/Mondale. Olive denotes the five electoral votes for Perot/Boren by Texas faithless electors. Numbers indicate electoral votes cast by each state. | |||||||||||||||||||||||||||||||||||||
| |||||||||||||||||||||||||||||||||||||
.jpg)
| |||||||||||||||||||||||||||||
538 members of the Electoral College 270 electoral votes needed to win | |||||||||||||||||||||||||||||
|---|---|---|---|---|---|---|---|---|---|---|---|---|---|---|---|---|---|---|---|---|---|---|---|---|---|---|---|---|---|
| Turnout | 54.2%[2] | ||||||||||||||||||||||||||||
| |||||||||||||||||||||||||||||
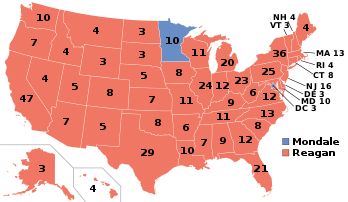
| Presidential election results map. Blue denotes those won by Carter/Mondale and Red denotes states won by Ford/Dole. Numbers indicate electoral votes cast by each state. | |||||||||||||||||||||||||||||
| |||||||||||||||||||||||||||||

| |||||||||||||||||||||||||||||
538 members of the Electoral College 270 electoral votes needed to win | |||||||||||||||||||||||||||||
|---|---|---|---|---|---|---|---|---|---|---|---|---|---|---|---|---|---|---|---|---|---|---|---|---|---|---|---|---|---|
| Turnout | 54.2%[3] | ||||||||||||||||||||||||||||
| |||||||||||||||||||||||||||||
| Presidential election results map. Red denotes states won by Ford/Connally and blue denotes those won by Carter/Mondale. Orange denotes the five electoral votes for Connally/Ford by Texas faithless electors. Numbers indicate electoral votes cast by each state. | |||||||||||||||||||||||||||||
| |||||||||||||||||||||||||||||

| |||||||||||||||||||||||||||||
538 members of the Electoral College 270 electoral votes needed to win | |||||||||||||||||||||||||||||
|---|---|---|---|---|---|---|---|---|---|---|---|---|---|---|---|---|---|---|---|---|---|---|---|---|---|---|---|---|---|
| Turnout | 55.2%[5] | ||||||||||||||||||||||||||||
| |||||||||||||||||||||||||||||
 Presidential election results map. Red denotes states won by Connally/Bush and blue denotes those won by McGovern/Biden. Light red and tan are the electoral votes for Reagan/Bush and Bush/None[b], respectively, by Texas faithless electors, reflecting the 1984 Texas vice presidential electors controversy. Numbers indicate electoral votes cast by each state and the District of Columbia. | |||||||||||||||||||||||||||||
| |||||||||||||||||||||||||||||

.jpg)
| |||||||||||||||||||||||||||||||||||||||||||||||||||||||||||||
538 members of the Electoral College 270 votes needed to win | |||||||||||||||||||||||||||||||||||||||||||||||||||||||||||||
|---|---|---|---|---|---|---|---|---|---|---|---|---|---|---|---|---|---|---|---|---|---|---|---|---|---|---|---|---|---|---|---|---|---|---|---|---|---|---|---|---|---|---|---|---|---|---|---|---|---|---|---|---|---|---|---|---|---|---|---|---|---|
| Opinion polls | |||||||||||||||||||||||||||||||||||||||||||||||||||||||||||||
| |||||||||||||||||||||||||||||||||||||||||||||||||||||||||||||
| Vice presidential election results map. Red denotes electors who voted for Bush, blue denotes electors who voted for Biden, and light red denotes electors who voted for Anderson. Orange, yellow, and pink are the electoral votes cast for Dole, Crane and Agnew, respectively, by Texas faithless electors, reflecting the 1984 Texas vice presidential electors controversy. Numbers indicate electoral votes cast by each state and the District of Columbia. | |||||||||||||||||||||||||||||||||||||||||||||||||||||||||||||


.jpg)
.jpg)


| Agnew v. Texas | |
|---|---|
 | |
| Argued November 29, 1984 Decided December 5, 1984 | |
| Full case name | Spiro Agnew, John B. Anderson, Joseph Biden, Jr., Robert Dole, Phillip Crane, petitioners v. Texas |
| Holding | |
| Electors could not be forced to abstain if one of their pledged candidates is not constitutionally eligible to receive their votes. | |
| Court membership | |
| |
| |||||||||||||||||||||||||||||
538 members of the Electoral College 270 electoral votes needed to win | |||||||||||||||||||||||||||||
|---|---|---|---|---|---|---|---|---|---|---|---|---|---|---|---|---|---|---|---|---|---|---|---|---|---|---|---|---|---|
| Turnout | 54.2%[6] | ||||||||||||||||||||||||||||
| |||||||||||||||||||||||||||||
| Presidential election results map. Red denotes those won by Connally/Bush and blue denotes states won by Dodd/Applegate. Texas electors cast votes for Connally for both President and Vice President. Numbers indicate electoral votes cast by each state. | |||||||||||||||||||||||||||||
| |||||||||||||||||||||||||||||

.JPEG)
| |||||||||||||||||||||||||||||
538 members of the Electoral College 270 electoral votes needed to win | |||||||||||||||||||||||||||||
|---|---|---|---|---|---|---|---|---|---|---|---|---|---|---|---|---|---|---|---|---|---|---|---|---|---|---|---|---|---|
| Turnout | 58.1%[7] | ||||||||||||||||||||||||||||
| |||||||||||||||||||||||||||||
 Presidential election results map. Blue denotes states won by Clinton/Gore and red denotes those won by Bush/Quayle. Numbers indicate electoral votes cast by each state and the District of Columbia. | |||||||||||||||||||||||||||||
| |||||||||||||||||||||||||||||
.jpg)
.jpg)
Presidents edit
| No.[e] | |||||||
|---|---|---|---|---|---|---|---|
| 37 | .jpg)
|
Richard Nixon (1913–1994) [8] |
January 20, 1969 – August 9, 1974[f] |
Republican | 1968
|
Spiro Agnew[f]
Vacant: | |
| 38 | .jpg)
|
Gerald Ford (1913–2006) [10] |
August 9, 1974[h] – January 20, 1977 |
Republican | – | Vacant through December 19, 1974 | |
| 39 | 
|
Jimmy Carter (b. 1924) [11] |
January 20, 1977 – January 20, 1981 |
Democratic | 1976 | Walter Mondale | |
| 40 | .jpg)
|
Gerald Ford (1913–2006) [12] |
January 20, 1981 – January 20, 1985 |
Republican | 1980 | John Connally | |
| 41 |
|
John Connally (1917–1991) [8] |
January 20, 1985 – July 17, 1989[f] |
Republican | 1984
|
George H. W. Bush | |
| 42 |
|
George H. W. Bush (1924–2018) [8] |
July 17, 1989 – January 20, 1993 |
Republican | – | Vacant through October 24, 1989 | |
| 43 |
|
Gary Hart (b. 1936) |
January 20, 1993 – January 20, 2001 |
Democratic | 1992
|
David Boren |
| |||||||||||||||||||||||||||||||||
| |||||||||||||||||||||||||||||||||
 County Results
Clinton 30-40% | |||||||||||||||||||||||||||||||||
| |||||||||||||||||||||||||||||||||
| |||||||||||||||||||||||||||||||||||||||||||||||||||||||||||||
3,346 delegates to the Democratic National Convention 1,674 delegates votes needed to win | |||||||||||||||||||||||||||||||||||||||||||||||||||||||||||||
|---|---|---|---|---|---|---|---|---|---|---|---|---|---|---|---|---|---|---|---|---|---|---|---|---|---|---|---|---|---|---|---|---|---|---|---|---|---|---|---|---|---|---|---|---|---|---|---|---|---|---|---|---|---|---|---|---|---|---|---|---|---|
| |||||||||||||||||||||||||||||||||||||||||||||||||||||||||||||
 | |||||||||||||||||||||||||||||||||||||||||||||||||||||||||||||
_(1).jpg)


| |||||||||||||||||||||||||||||||||||||
538 members of the Electoral College 270 electoral votes needed to win | |||||||||||||||||||||||||||||||||||||
|---|---|---|---|---|---|---|---|---|---|---|---|---|---|---|---|---|---|---|---|---|---|---|---|---|---|---|---|---|---|---|---|---|---|---|---|---|---|
| |||||||||||||||||||||||||||||||||||||
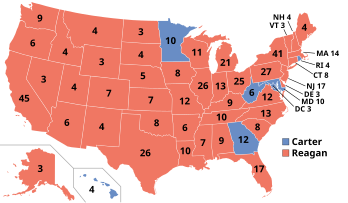
| Presidential election results map. Red denotes states won by Reagan/Bush and blue denotes those won by Carter/Mondale. Numbers indicate electoral votes cast by each state. | |||||||||||||||||||||||||||||||||||||
| |||||||||||||||||||||||||||||||||||||


.jpg)
| |||||||||||||||||||||||||||||
538 members of the Electoral College 270 electoral votes needed to win | |||||||||||||||||||||||||||||
|---|---|---|---|---|---|---|---|---|---|---|---|---|---|---|---|---|---|---|---|---|---|---|---|---|---|---|---|---|---|
| |||||||||||||||||||||||||||||
| Presidential election results map. Blue denotes states won by Carter/Kerrey and red denotes those won by Ford/Rumsfeld. Numbers indicate electoral votes cast by each state. | |||||||||||||||||||||||||||||
| |||||||||||||||||||||||||||||

| |||||||||||||||||||||||||||||
538 members of the Electoral College 270 electoral votes needed to win | |||||||||||||||||||||||||||||
|---|---|---|---|---|---|---|---|---|---|---|---|---|---|---|---|---|---|---|---|---|---|---|---|---|---|---|---|---|---|
| |||||||||||||||||||||||||||||
| Presidential election results map. Blue denotes states won by Hart/Clark and red denotes those won by Bush/Cheney. Numbers indicate electoral votes cast by each state. | |||||||||||||||||||||||||||||
| |||||||||||||||||||||||||||||
.jpg)
- ^ "National General Election VEP Turnout Rates, 1789-Present". United States Election Project. CQ Press.
- ^ "National General Election VEP Turnout Rates, 1789-Present". United States Election Project. CQ Press.
- ^ "National General Election VEP Turnout Rates, 1789-Present". United States Election Project. CQ Press.
- ^ Cite error: The named reference
laws2was invoked but never defined (see the help page). - ^ "National General Election VEP Turnout Rates, 1789-Present". United States Election Project. CQ Press.
- ^ "National General Election VEP Turnout Rates, 1789-Present". United States Election Project. CQ Press.
- ^ "National General Election VEP Turnout Rates, 1789-Present". United States Election Project. CQ Press.
- ^ a b c Hoff (b) (2000).
- ^ Neale (2004), p. 22.
- ^ a b Greene (2013).
- ^ whitehouse.gov (a).
- ^ Schaller (2004).
- ^ "DISENCHANTED". The Boston Globe. Boston, Massachusetts. July 1, 1980. Retrieved April 2, 2024.
- ^ "DISENCHANTED". The Boston Globe. Boston, Massachusetts. July 1, 1980. Retrieved April 2, 2024.
- ^ "DISENCHANTED". The Boston Globe. Boston, Massachusetts. July 1, 1980. Retrieved April 2, 2024.
- ^ "DISENCHANTED". The Boston Globe. Boston, Massachusetts. July 1, 1980. Retrieved April 2, 2024.
- ^ "DISENCHANTED". The Boston Globe. Boston, Massachusetts. July 1, 1980. Retrieved April 2, 2024.
prescott edit
| |||||||||||||||||||||||||||||||||||||
538 members of the Electoral College 270 electoral votes needed to win | |||||||||||||||||||||||||||||||||||||
|---|---|---|---|---|---|---|---|---|---|---|---|---|---|---|---|---|---|---|---|---|---|---|---|---|---|---|---|---|---|---|---|---|---|---|---|---|---|
| |||||||||||||||||||||||||||||||||||||
| Presidential election results map. Red denotes states won by Bush/Romney, blue denotes those won by Muskie/Sanford, and purple denotes those won by Wallace/LeMay, including a North Carolina faithless elector. Numbers indicate electoral votes cast by each state. | |||||||||||||||||||||||||||||||||||||
| |||||||||||||||||||||||||||||||||||||

-cropped.jpg)
.jpg)
| |||||||||||||||||||||||||||||||||||||
538 members of the Electoral College 270 electoral votes needed to win | |||||||||||||||||||||||||||||||||||||
|---|---|---|---|---|---|---|---|---|---|---|---|---|---|---|---|---|---|---|---|---|---|---|---|---|---|---|---|---|---|---|---|---|---|---|---|---|---|
| |||||||||||||||||||||||||||||||||||||
| Presidential election results map. Blue denotes states won by Harris/Moss, red denotes those won by Romney, yellow denotes those won by Gross/Crane, green denotes those won by Rhodes, brown denotes those won by Case, orange denotes those won by Bush/Romney, and pale red denotes those won by various other candidates; this reflects the posthumous scattering of Bush's electoral votes. Numbers indicate electoral votes cast by each state. | |||||||||||||||||||||||||||||||||||||
| |||||||||||||||||||||||||||||||||||||

.jpg)
Cite error: There are <ref group=lower-alpha> tags or {{efn}} templates on this page, but the references will not show without a {{reflist|group=lower-alpha}} template or {{notelist}} template (see the help page).