Talk:List of costliest Atlantic hurricanes
| This article is rated List-class on Wikipedia's content assessment scale. It is of interest to the following WikiProjects: | ||||||||||||||||||||||||||||||||||
| ||||||||||||||||||||||||||||||||||


Daily pageviews of this article
A graph should have been displayed here but graphs are temporarily disabled. Until they are enabled again, visit the interactive graph at pageviews.wmcloud.org |
Inflation adjustment edit
This table spans 48 years. Inflation has increased the value of the dollar to $9.67 since 1965. The changes in rank from Template:Inflation adjustment are as follows:
Top 5 jumps: +27 Betsy (1965), +24 Camille (1969), +15 Agnes (1972), +12 Allen (1980), +12 Fifi (1974)
Top 5 falls: -12 Isaac (2012), -11 Alex (2010), -9 Karl (2010), -9 Lee (2011), -8 Gustav (2008)
Ignoring the adjustment does not adequately give the scale of previous disasters. It doesn't even have to be sorted that way by default, but it should at least be included.
The wealth normalization edit
Could someone please delete a British kid's undergraduate project to list hurricane damage by wealth normalization. No one in the world uses these numbers, and it's absurd to say that a Miami hurricane that did 100 million in damage is actually 140 BILLION in today's money. People are using these numbers in other articles, skewing damage amounts. —Preceding unsigned comment added by 68.227.148.214 (talk) 14:45, 22 August 2009 (UTC)
Todo edit
Added tags regarding accuracy of 2008 estimates. The list does not include recorded storms that occurred before the advent of naming storms, and the estimated damages do not follow any reliable model. They do not follow any economic indicator as referenced in the 2005 model, nor do they follow the correct adjustments for inflation alone, but mix and match different methods to give them their numbers, resulting in a very skewed table. ♬♩ Felyza (talk) 16:52, 26 September 2008 (UTC)
Add other countries, make prettier. ♬♩ Hurricanehink (talk) 01:20, 29 August 2008 (UTC)
Remove Normalization edit
The "Cost adjusted for wealth normalization" absolutely needs to be removed. Unused anywhere else, misleading and should not be the default sorting category. Took very substantial research to find out the the credentials of the authors, and even then it has no peer review outside of itself. I don't doubt the credentials, but this is an entirely unused process and formula used. The math may technically be correct but it's still scientifically misleading. Theoretical numbers at best and do not stand up to standards of statistical review. We have no idea whatsoever how to determine the wind field of older cyclones with any degree of accuracy. All the data for the "normalization" process is based on location of current-day construction and population but is on too macro a scale.
Even if it's to be used, that table needs modern updating with newer storms and a consistent year of inflation. It's theoretical and has no place unless accredited as NOAA data. Since one of the co-authors is a NOAA researcher, that shouldn't be terribly difficult if it were considered good research and more sourcing would have appeared by now. Datheisen (talk) 12:44, 16 October 2009 (UTC) Edited after a lot of research; Datheisen (talk) 07:25, 18 October 2009 (UTC)
- Roger Pielke is a renowned scientist, as are his co-authors, including NOAA's Chris Landsea. His article was published in a peer-reviewed journal. If you think his study is flawed, publish a response in another journal. Anything else, like "modifying" this table, would be original research. So would be "updating" this table, thus we won't do it. Pielke actually publishes an updated version of his list every ten years or so (the current version is actually an update of Pielke/Landsea (1998)). --bender235 (talk) 02:03, 25 November 2009 (UTC)
No, that's crap that doesn't mean anything to anyone. I'll remove it. —Preceding unsigned comment added by 69.171.164.164 (talk) 04:09, 20 October 2010 (UTC)
I'm online, and taking a lot of heat from knowledgeable people about how Wiki's numbers are not adjusted for inflation. Sorting the Wiki table, the most expensive hurricanes are: Katrina, Sandy, Ike and Wilma. (All within the last 10 years.) Critics, however, are pointing out that isn't what NOAA and ICAT say at all. That, for example, the worst by far is the Great Miami of 1926. There are standard Wiki ways to adjust for inflation, let's use them, perhaps adding a column if people find it essential to include the original figures at all.
We shouldn't wait for 69.171.164.164 (talk) to weigh in, that's an anon IP with 30 edits, most rock and roll, three years ago.
Leptus Froggi (talk) 01:32, 17 September 2013 (UTC) it
- Simple, raw inflation adjustment is misleading for hurricanes of different eras. The Pielke et al. list doesn't answer the question "what are the costs of Hurricane X in today's currency", but rather "what damage would Hurricane X cause if it hit today's USA". That's an important difference. Instead of updating Pielke's list by hand, we should wait until he publishes an updated version himself, which will likely be in two years, tops. --bender235 (talk) 03:31, 17 September 2013 (UTC)
- Id be curious to see where this so called criticism is coming from since this article represents all of the hurricanes to have caused a billion $ in damage and therefore the costliest Atlantic hurricanes. It is also worth noting that the Tropical Cyclone Project decided to remove inflation from its articles for various reasons including because it is misleading. Also in my opinion Peilkes data has no place in this article since it is now all of the hurricanes to have caused a billion $ in damage and are the costliest Atlantic hurricanes of all time rather than the costliest US/Cuban hurricanes.Jason Rees (talk) 13:05, 17 September 2013 (UTC)
- Simple, raw inflation adjustment is misleading for hurricanes of different eras. The Pielke et al. list doesn't answer the question "what are the costs of Hurricane X in today's currency", but rather "what damage would Hurricane X cause if it hit today's USA". That's an important difference. Instead of updating Pielke's list by hand, we should wait until he publishes an updated version himself, which will likely be in two years, tops. --bender235 (talk) 03:31, 17 September 2013 (UTC)
Hurricane Sandy edit
Are we going to add Hurricane Sandy in the mix? Fabzzz (talk) 18:50, 30 October 2012 (UTC)
- Not until we get a better damage total. Right now it is extremely preliminary. --♫ Hurricanehink (talk) 00:08, 31 October 2012 (UTC)
Reverted changes regarding overblown worst-case estimate for Sandy. Current financial damage only speculation. Awaiting more concrete estimates. — Preceding unsigned comment added by 174.97.168.91 (talk) 05:32, 2 November 2012 (UTC)
How about all the other Hurricanes since 2005? I'm not very knowledgeable about this stuff, but it seems like the past 7 years of hurricanes had a few that would make this list.68.33.86.221 (talk) 17:36, 2 November 2012 (UTC)
People need to stop putting the 50 billion for sandy down, if you look at the NOAA site the cost listed for the other storms ONLY include property damage, sandy $50 billion includes non-property damage cost such as lost work. Total actual damages from sandy are only 20 billion so far. — Preceding unsigned comment added by 24.7.156.185 (talk) 23:50, 3 November 2012 (UTC)
If the numbers for rest of the of the storms on this list only include property damage, why is Sandy treated differently? It makes comparisons between the rest of the storms difficult and the list erroneous. Either only include property damage numbers for Sandy, or go back and include "loss of business" or "total loss" in the numbers for each other storm; otherwise, you're not comparing the same things. Here are just two articles I found projecting that Sandy's loss of property damage is closer to $20b:
- http://business.time.com/2012/10/31/hurricane-sandy-estimated-to-cost-60-billion/
- http://finance.yahoo.com/news/much-hurricane-sandy-cost-insurance-231523049.html
I realize that $20b would put Sandy as number 6 on this list instead of number two, and thus make it less "tragic" or less of a "superstorm" in some people's eyes, but numbers are numbers. If someone wants to go back and include total loss for each other storm, I'm sure Sandy would still come out very close to the top, and the list would be accurate. However, as the previous comment here suggests, NOAA (http://www.nhc.noaa.gov/pdf/nws-nhc-6.pdf) tracks the amount of loss of property and infrastructure in their estimates, not total economic loss. 75.75.120.143 (talk) 15:13, 24 November 2012 (UTC)
- I don't necessarily understand why Sandy continues to use a number not even mentioned in the article the citation links to. Sandy's article does not mention the amount claimed, I added a [citation needed], and it gets removed without as much as an explanation. Since then, the damage estimate has even gone up, to well over 60 billion, without any source. I also like the usage of "top-costliest" at the top of the article. We might have to wait until the season ends for a full report, but can we at least use a believable, and most importantly, a verifiable number until then? Lfinnisher (talk) 16:32, 26 November 2012 (UTC)
I've reverted the recent changes that put Sandy as the costliest storm. While it was indeed very costly, we don't have proof yet it was the costliest. User:Bslay1298 wrote this in a comment:
- You are going off of a month old article on a storm that is litteraly becoming more expensive by the second. This article was a preliminary number from much longer ago. And most of the damage totals you are referring to are just as old. It has been a month after the storm, the most accurate numbers are coming in now, and all point to a much higher number than 60 billion.
However, I'm going off the most recent damage totals. Even if you assume the entire $41 billion in New York] is entirely damage (which it is not), and ditto to the $29.4 billion in New Jersey, that still only adds up to $70 billion. Again, that is a high total, but not high enough for the costliest storm, and nowhere near the $110 billion some say Sandy did. --♫ Hurricanehink (talk) 15:28, 27 November 2012 (UTC)
Well let's keep in mind that the total being used for Katrina does not only include property damage either. Here are 2 most recent articles, citing the fact that more property was damaged during Sandy than Katrina. Remember this is a month after the storm, not hype a day after the storm. I have no idea why there seems to be a reluctancy or slowness to cover the mounting costs of this storm as to how it compares to Katrina but someone please argue the merits of these 2 most recent articles. Let's not confuse what states are asking the Feds for vs what a storm actually cost. Articles that talk about 40 to 70 billion being requested have nothing to do with total cost and does not include private insurance. Both of these articles put the total damages of NY to be 62 billion and NJ at 61 billion. Both elude to the storm costing more than Katrina. Both talk about the fact that much more property was damaged than during Katrina. And most importantly, both articles are only referring to 2 states out of at least 10 affected by Sandy and are less than 24 hours old. With this info how is it more responsible to hold with numbers that are much older and way off? http://www.news.com.au/world/superstorm-sandy-costs-42-billion-with-damage-worst-than-hurricane-katrina/story-fndir2ev-1226524679879 http://www.telegraph.co.uk/news/worldnews/northamerica/usa/9704840/Superstorm-Sandy-set-to-cost-more-money-than-Hurricane-Katrina.html — Preceding unsigned comment added by Bslay1298 (talk • contribs) 15:51, 27 November 2012 (UTC)
- Andrew Cuomo saying Sandy was worse than Katrina doesn't make it so. The first article you mentioned say - "The total bill in New York and neighboring New Jersey was "62, and 61 billion dollars." The damage total in New Jersey was recently estimated at $29.4 billion, per here. And that's from the New Jersey governor. Damage outside of those two states were fairly minimal, by the way, doubtfully exceeding $1 billion anywhere. --♫ Hurricanehink (talk) 15:59, 27 November 2012 (UTC)
- You are WRONG. Look at the NOAA site were the numbers are actually. The numbers are ONLY for property damage. — Preceding unsigned comment added by 24.7.156.185 (talk) 00:55, 2 December 2012 (UTC)
- It would be helpful if you included a source. Just post the link here. TropicalAnalystwx13 (talk) 02:06, 2 December 2012 (UTC)
- Someone has already included a source, in fact if you actually bother to look at the sources for the damages estimate for the other storms on the NOAA site, it states it. — Preceding unsigned comment added by 24.7.156.185 (talk) 07:22, 2 December 2012 (UTC)
- It would be helpful if you included a source. Just post the link here. TropicalAnalystwx13 (talk) 02:06, 2 December 2012 (UTC)
This article from Yahoo Finance might add some clarity, also less than 24 hours old. http://news.yahoo.com/york-jersey-put-71-billion-price-tag-sandy-002134256--sector.html The 42 and 29 billion, NY and NJ respectfully, you are referring to; totals to the 71 billion referenced above in an additional article. That amount is what the 2 states in question are asking the Feds for. Again that has nothing to do with the totals 62 and 61 billion. It is simply numbers that those states are lobbying for to help with the total damages. Just as with Katrina, the amount the Feds pay, isn't the total tab. What do you think the 62 and 61 billion numbers refer to then? And I agree, what a Gov. thinks a storm costs doesn't make it so. But, I will add that all these numbers are preliminary, as stated above, including the 65 billion that you list and most definetly the ridiculously low, out of the box number of 20 billion. This is a quote from the above article yahoo; "Sandy destroyed 305,000 houses in New York state - a still provisional number that's likely to grow - compared to the 214,700 destroyed in Louisiana by Katrina and Rita. Sandy also caused nearly 2.2 million power outages at its peak in the state, compared to 800,000 from Katrina and Rita in Louisiana, and impacted 265,300 businesses compared to 18,700, Cuomo said." This is just NY we're talking about. Taking into account the overall numbers of structures and the fact that the average value of these structures are incredibly higher than what was the values in Louisiana, which also is mentioned in the article.... C'mon, this is pretty easy to do the math guys.. — Preceding unsigned comment added by Bslay1298 (talk • contribs) 16:43, 27 November 2012 (UTC)
Additional point here; The first sentence in the yahoo article states it correctly which is pulled from a Reuters article also less than 24 hours old...."(Reuters) - New York state and New Jersey need at least $71.3 billion to recover from the devastation wrought by Superstorm Sandy and prevent similar damage from future storms, according to their latest estimates." It is the word "need" I am pointing out. Read the whole article and you will see this is what they are asking for... — Preceding unsigned comment added by Bslay1298 (talk • contribs) 16:48, 27 November 2012 (UTC) I can list more than 8 articles now less than 24 hours old, from yahoo finance to the telegraph and now Reuters... Yes of course all are "preliminary", but all are much more recent estimates than the recycled "preliminary" numbers that are being quoted here. All point to much higher costs than 65 billion for Sandy. Either change the numbers or take down the estimations for Sandy all together until the last dollar is spent.... a year from now. And please stop confusing the issues on costs. seperating cleanup and rebuild vs damage. I don't know where this has gotten off track. Katrina's total of 108 billion is including everything, from cleanup to damage to prevention with the new and improved levee. And most agree that Hurricane Rita's damages are overlapped in that 108 billion. I thought we want to be accurate here. The more accurate numbers are coming out now, their not going down, their going up... — Preceding unsigned comment added by Bslay1298 (talk • contribs) 17:26, 27 November 2012 (UTC)
- For Katrina, the $108 billion is from uninsured and insured damage, so nothing to do with cleanup costs or Rita. No sources yet have said Sandy will top Katrina, and no damage totals (note, damage total, not including cleanup) have reached nearly as high as $100 billion. ♫ Hurricanehink (talk) 19:27, 27 November 2012 (UTC)
Except the 8 articles I referred to above stating just that... And I'm not going to argue the fact that Rita and Katrina were only seperated by a little over a month, obviously outlying areas that were affected by both storms were more than likely to be paid by the more well known and publicized Katrina that was destined to be much more well funded. The reason why the original accessments of 10 to 20 billion are being blown away is the complete lack of understanding of the swath of people who were even mildly affected by Sandy. I'm in the insurance business and worked both events, Katrina and am currently with Sandy. More than 8 million homes lost power. That alone is a huge indicator of costs. That is more than 4 times that of Katrina by the friendliest of numbers. The sheer numbers of people affected is what's driving the costs, not the intensity of the storm. Hands down Katrina, at it's core was a more damaging storm. But on average, 8 million claims valued at $10,000 a piece, which is small comparitively speaking; worth of food spoilage, shingle damage, and lawn damage... and your already at 80 bill before any infrustructure and so on. And, let's not forget the nature of the labor costs in both areas. Do you realize that the same amount of work being paid for by an insurance claim in the NE cost on average 19% more than the SE. The northeast, union higher wages vs the southeast right to work states with little to no union influence...see what I mean? Not only that, we are seeing more people make claims on minimal damage that normally would not, which we believe is due to the economy; a cashing in affect. Bottom line, it is 3 to 1 when we get to independent structures damaged by Sandy vs Katrina. Look at the number of New York structures alone in the above articles. That alone supercedes the amount of damaged properties during Katrina and that's before you get to New Jersey. Look my industry loves playing this down, it's what we do. There should be some deductive reasoning here. — Preceding unsigned comment added by Bslay1298 (talk • contribs) 20:38, 27 November 2012 (UTC)
- The Yahoo article you mentioned said $70 billion. As for deductive reasoning, we're not allowed to do that on Wiki. We have to get a reliable, official damage total, and we go by that. As of now, we don't have any official sources saying the damage total was over $100 billion. Good luck with all of the insurance work afterward though. I can't imagine how long that's all going to take? --♫ Hurricanehink (talk) 23:11, 27 November 2012 (UTC)
Gotcha, my point about the other articles was the 62, 61 quotes. That's where we in the field are putting the true numbers on this, around 120 bil. So when we saw that it just backed up what we are seeing. I guess your saying he was saying total NJ and NY was 61 or 62 billion combined. If that's the case, he sure said it a funny way. I tried to find video of this press conference to see his meaning but no luck. Yeah it's crazy, the numbers are overwhelming, way more than what we saw in Katrina on the outset regarding personal property and housing. We knew that going in just because of the gov housing issue they have down there vs actual homeowner ownership in the NE. But a month later it is intensifying, not slowing down... A lot of sad stories, and almost every person I meet has a feeling that the press isn't covering this in the terms of loss like it was covered during Katrina. We knew the numbers were going to run way up, just because of the land mass. No one could get their arms around a bunch of small damage everywhere combined with devestation along the coasts. It is way easier to come up with total losses in a confined area like New Orleans than to put a number on 8 to 12 states with moderate damage and 2 with tons of damage... — Preceding unsigned comment added by Bslay1298 (talk • contribs) 00:03, 28 November 2012 (UTC)
- What was the exact quote that implied $61 billion in each state? I guess I missed that. --♫ Hurricanehink (talk) 00:23, 28 November 2012 (UTC)
Here is the article... http://www.telegraph.co.uk/news/worldnews/northamerica/usa/9704840/Superstorm-Sandy-set-to-cost-more-money-than-Hurricane-Katrina.html The quote is this...."The total bill in New York and neighboring New Jersey was "62, 61 billion dollars," Mr Cuomo estimated, though that number seemed sure to rise when including extra funds needed for protection against future storms." He was responding to a question about the costs for both New York and New Jersey. Seeing how he is the Gov of only New York, I assume he was giving his number 62 and then saying New Jersey was 61. Just like he is only asking for 42 billion in the same article but he is responding to the total independently, NY and NJ. Think about it like this, if he's asking for 42 and like you said NJ is asing for 29, that doesn't total 61 or 62. What he is saying seems clear, especially by saying the higher number first.... — Preceding unsigned comment added by Bslay1298 (talk • contribs) 00:32, 29 November 2012 (UTC)
- IDK, I think he meant that it was around 61, 62 billion overall, not each. Not to mention, that is only one person's estimate, which contradicts his own estimate of $32 billion in NY and $29 billion in NJ (but is very much when you add those totals together). --♫ Hurricanehink (talk) 00:41, 29 November 2012 (UTC)
Right but that one man's opinion is what every article is basing there numbers off of, just at different times. This was a more recent time. He has already moved his original projections twice now. he's not contradicting, reevaluating... This will happen a few more times. Now you have a lot more than one man's opinion... you have two different state's legislature's saying the damages are more with this newest article...http://thehill.com/blogs/on-the-money/appropriations/269931-lawmakers-press-for-giant-sandy-bill-amid-fiscal-cliff-talks — Preceding unsigned comment added by Bslay1298 (talk • contribs) 02:20, 29 November 2012 (UTC)
- You keep mentioning these bigger totals, but the $42 billion by Cuomo is what he is requesting in aid, it's not the damage total. [1] - here, it includes both Bloomberg asking for $42 billion "in disaster relief and prevention funds", and it also includes "Andrew Cuomo... has broken down the losses incurred by the entire state of New York, for a total of $33 billion." That $33 billion is the benchmark for New York for damage, and we have the $29.4 billion for New Jersey. There is a difference between storm mitigation and federal aid versus the damage total. The storm damage total is only how much damage the storm directly did. It was bad, for sure, but we can't simply include whatever is the highest total we can find. We have to be careful in what we write, for the purposes of this article, to include how much damage the storm actually did. I suggest we wait in updating until we get a firm total from either the National Hurricane Center, the National Oceanic and Atmospheric Administration, FEMA, or another branch of the federal government, not one person's estimate. That is how we do it for other storms. --♫ Hurricanehink (talk) 15:20, 29 November 2012 (UTC)
Conflicting reports edit
All I had to do was a google search to find that more reputable sources conflict with this article. I don't know how to code the charts for wikipedia, but I feel that a chart should be entered to reflect the findings of CNBC's report, which uses the reputable III (Insurance Information Institute, http://www.cnbc.com/id/26426796?slide=2) — Preceding unsigned comment added by Ranger438 (talk • contribs) 02:54, 31 October 2012 (UTC)
Your more reputable source is a month old and more importantly just a few days after the storm. A storm that was the largest storm ever to hit the US in recorded history, in terms of area affected, doesn't accurately get described a couple of days later.... And Insurance Information Institute's job is to low ball damages out of the gate, which historically happens 100% of the time on every storm... — Preceding unsigned comment added by Bslay1298 (talk • contribs) 16:57, 27 November 2012 (UTC)
Wealth normalization table edit
I am incredibly interested in deleting that junk (expletive removed), If someone will give me the O.K. I'll go ahead and delete it. The entire table. — Preceding unsigned comment added by 96.232.201.187 (talk) 18:29, 2 November 2012 (UTC)
Sandy or no Sandy + Damage total edit
Enoughs enough - Should we be including Sandy in this List of costliest Atlantic hurricanes and if so how much damage should we attribute to it 50B or 75B.Jason Rees (talk) 22:41, 22 May 2013 (UTC)
- Include it, $50 billion per TCR. --♫ Hurricanehink (talk) 23:44, 22 May 2013 (UTC)
- The $71.4 billion for the US comes from the NCDC just so you know, so the $75 billion is more accurate. Cyclonebiskit (talk) 23:45, 22 May 2013 (UTC)
- The $50 Billion comes from a report from the NOAA as of May 2013, the 71.4 was an estimate dated in December. The $50 billion is more accurate. — Preceding unsigned comment added by 98.255.215.7 (talk) 08:14, 24 May 2013 (UTC)
- The NCDC also has a report dated AFTER the 71.4 figure showing 50 billion. All latest reports from the NOAA including those form NCDC show 50 billion.--98.255.215.7 (talk) 08:21, 24 May 2013 (UTC)
- Yea, but the NCDC is based off preliminary reports. The TCR is still the most accurate estimate as of now, until NCDC releases something more up to date. --♫ Hurricanehink (talk) 00:18, 2 June 2013 (UTC)
- The damage estimates stated by NOAA are just as preliminary, as stated specifically in their TCR on Sandy. TropicalAnalystwx13 (talk) 16:47, 2 June 2013 (UTC)
- The NOAA report still is still more recent, and that report is currently referenced on the NCDC website for Sandy. Also the NOAA has released a new assessment report in May 2013, which still says $50. So as of now that 50M is the latest number from the NOAA. --98.255.215.7 (talk) 21:31, 2 June 2013 (UTC)
- But the NHC one is more reliable and used by NOAA Management unlike the NCDC one.Jason Rees (talk) 16:50, 2 June 2013 (UTC)
- The damage estimates stated by NOAA are just as preliminary, as stated specifically in their TCR on Sandy. TropicalAnalystwx13 (talk) 16:47, 2 June 2013 (UTC)
- Yea, but the NCDC is based off preliminary reports. The TCR is still the most accurate estimate as of now, until NCDC releases something more up to date. --♫ Hurricanehink (talk) 00:18, 2 June 2013 (UTC)
- The $71.4 billion for the US comes from the NCDC just so you know, so the $75 billion is more accurate. Cyclonebiskit (talk) 23:45, 22 May 2013 (UTC)
Hurricane Agnes 1972 edit
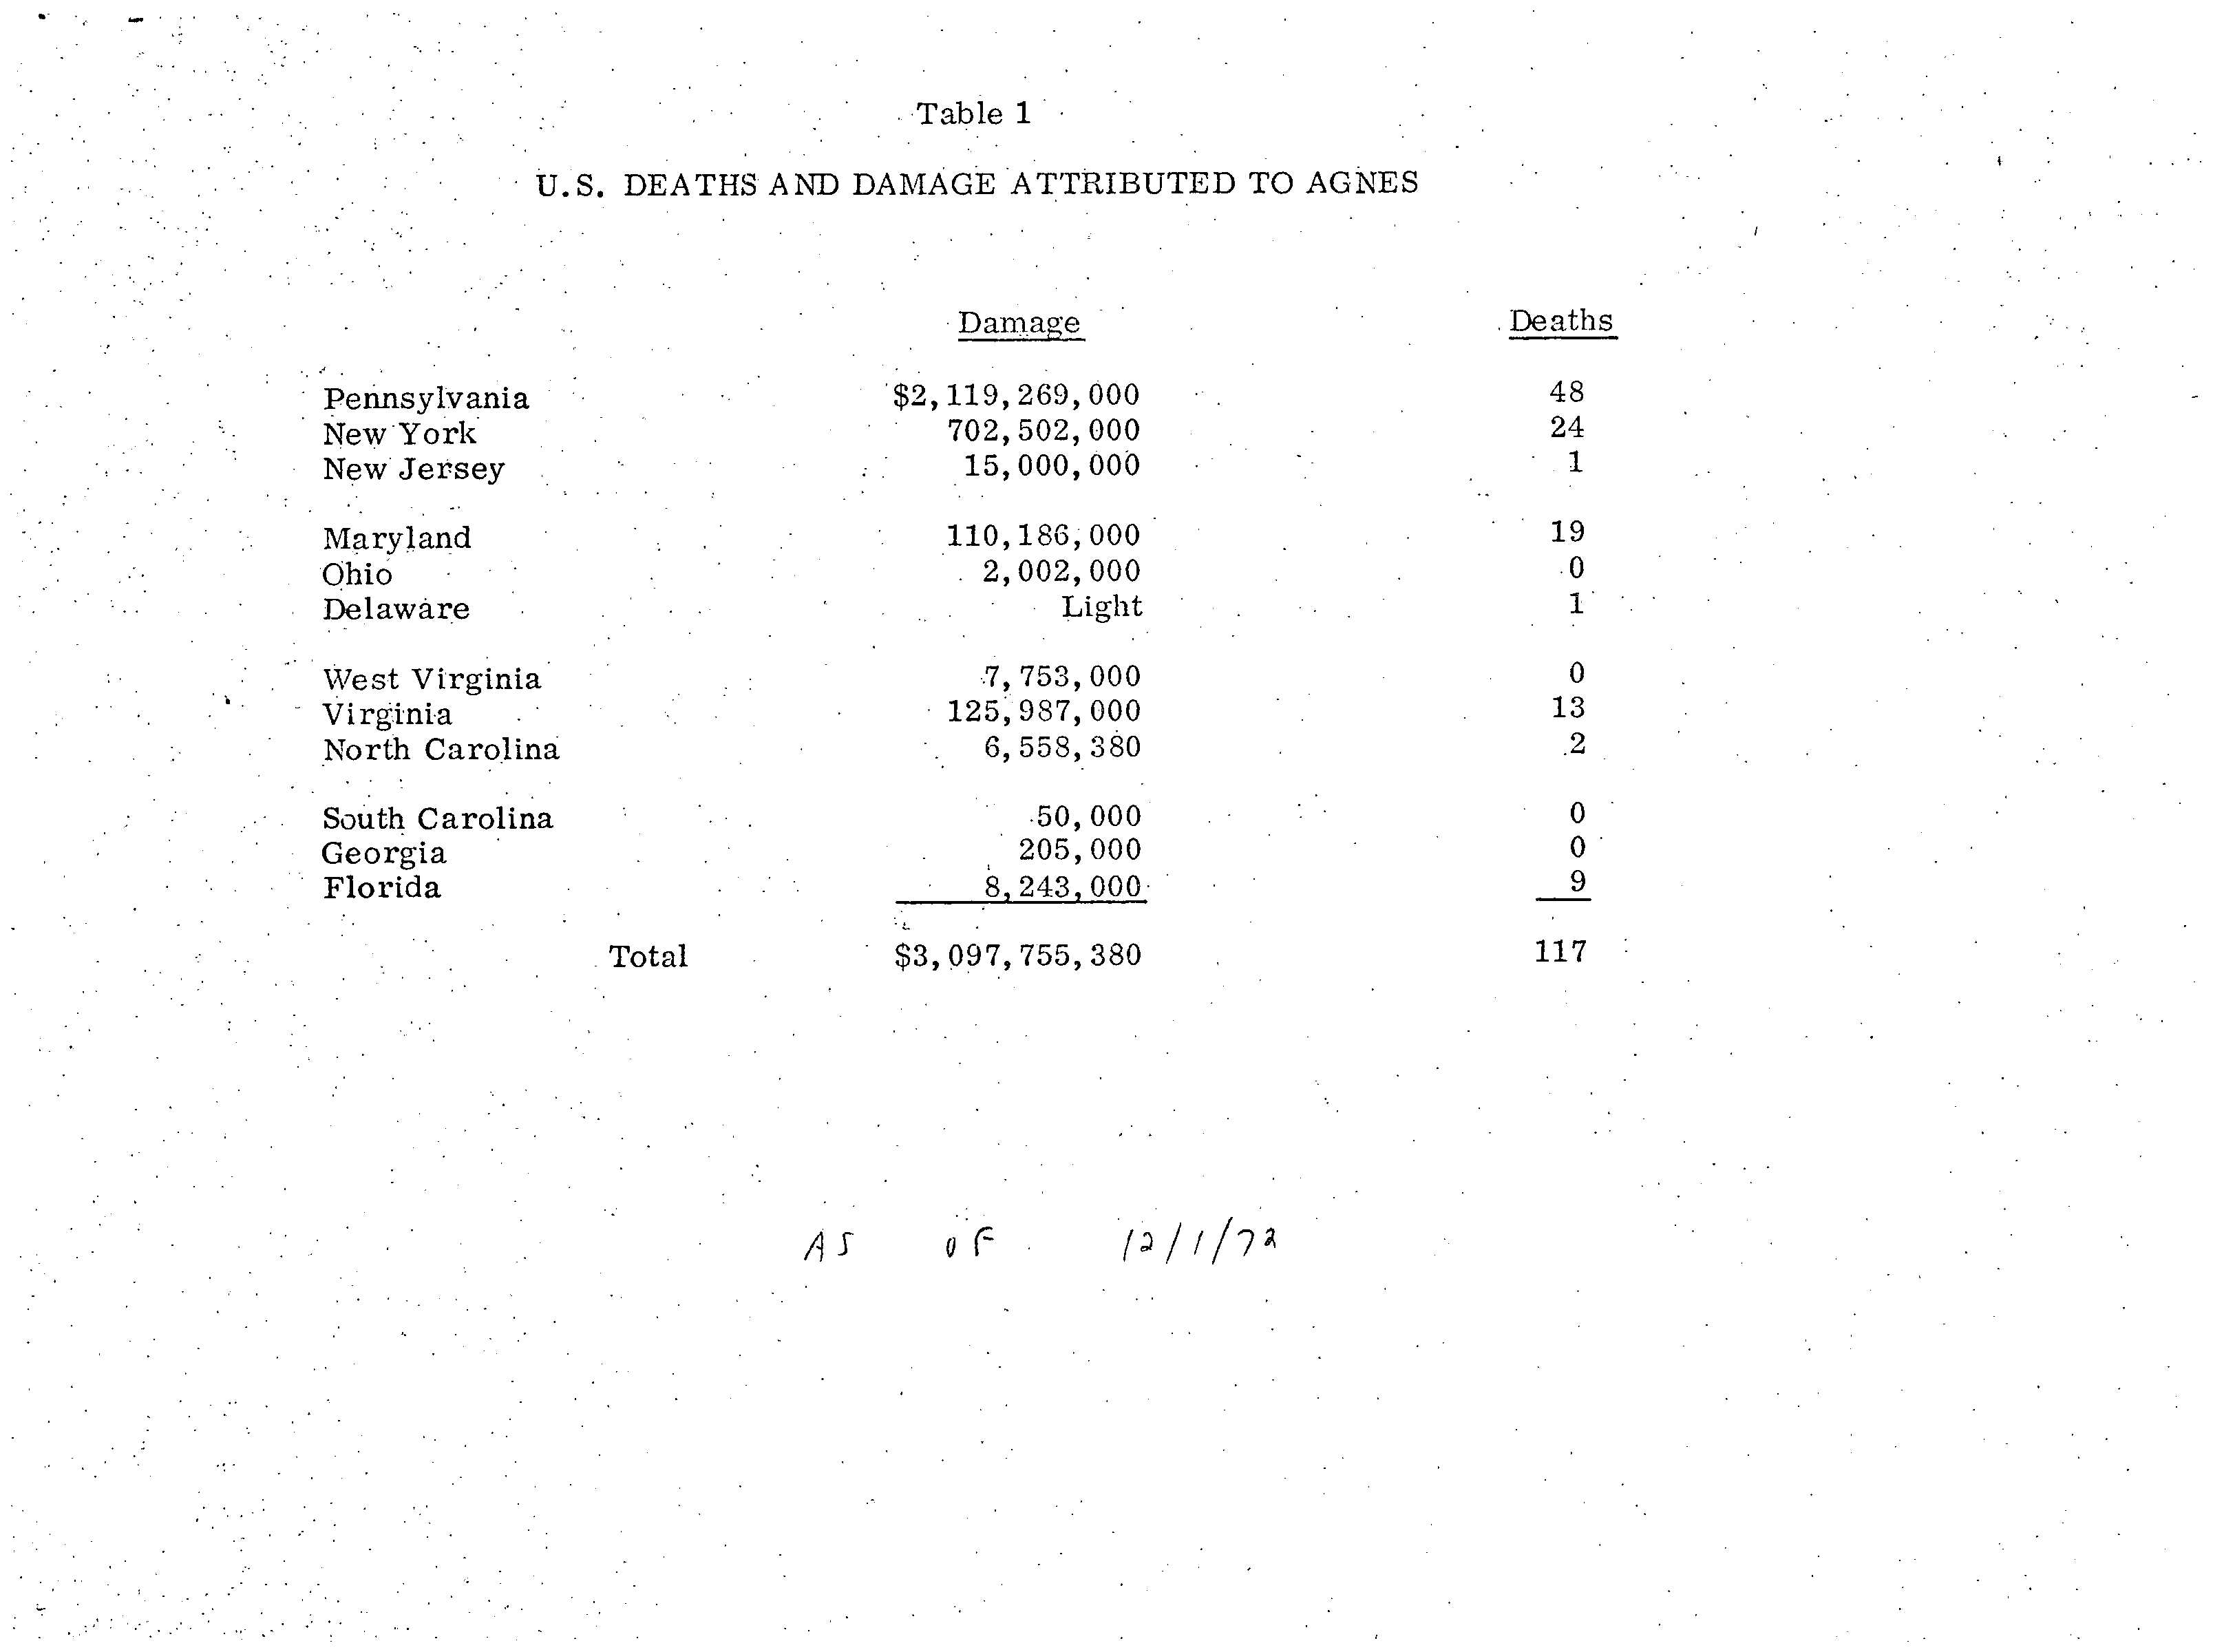
This Wikipedia has contradictory damage reports on Hurricane Agnes. Most sources say Agnes caused $3 billion in damage while others say $2.1 billion. I believe the earlier is true. Someone please tell me which is true. Angela Maureen (talk) 16:20, 8 August 2016 (UTC)
- Hmm... Personally my feeling is that it is the 2.1 Billion, since it can be cited back to every version of The Deadliest, Costliest, and Most Intense United States Tropical Cyclones from... , however, the $3 billion comes from this source which is dated January 1973 and would probably be preliminary.Jason Rees (talk) 22:56, 8 August 2016 (UTC)
Harvey edit
Using Insurance Losses is a terrible indicator. They think they might end up paying out 10 billion. But, that's really because few people have flood insurance 2-3% and those without it cost the insurance industry nothing. This isn't remotely a good metric for actual losses. Tat (talk) 05:32, 29 August 2017 (UTC)
- Some analysts on Monday had already begun to assess Harvey’s potential damage. JPMorgan Chase sent a note to clients saying the insured losses alone could range from $10 billion to $20 billion, hitting private companies that had sold flood coverage in the area. But the total damage is expected to be much greater than just the insured losses, as many people in the area didn’t have flood insurance, and there has been substantial damage to roads, bridges and other public infrastructure. [2] Tat (talk) 05:35, 29 August 2017 (UTC)
- Overall about 15% of people in Houston and more in outlying areas have flood insurance, but yes, uninsured losses are a thing. We won't have any very good numbers for a while; presently, estimates vary by over an order of magnitude. Titanium Dragon (talk)
Harvey cost update edit
Please update the cost of Harvey(2017) — Preceding unsigned comment added by 71.204.244.241 (talk) 22:10, 31 August 2017 (UTC)
Why isn't Hurricanes Harvey, Irma, and Maria on the list? edit
I wonder why, my guess is that the total damage hasn't got a official total. Gary "Roach" Sanderson (talk) 10:20, 5 October 2017 (UTC)
- I saw that someone added Harvey. Could Irma, Maria, and any other appropriate storms from 2017 be added to the list now, too? Charlotte Allison (Morriswa) (talk) 01:23, 2 November 2017 (UTC)
- @Morriswa: Harvey was added as there's now a reliable estimate that NOAA supports. The remaining storms do not have a NOAA-supported value. ~ Cyclonebiskit (chat) 01:53, 2 November 2017 (UTC)
Raise the cutoff for inclusion in the table edit
With almost any landfall near some major population these days, $1 billion in damage is likely. Should we raise the threshold for the "costliest" table to only include the top 25, or more than $5 billion, or something more narrow? ~Araignee (talk • contribs) 17:43, 27 November 2017 (UTC)
- Size is 50kb, so maybe sometime down the road, but it's not terribly problematic at the moment. YE Pacific Hurricane 17:49, 27 November 2017 (UTC)
Southwest US edit
Dolly was a Texas hurricane. That there were two deaths from the remnants in New Mexico does not change that. Texas has not been “southwest US” since the nineteenth century. I changed it to “Texas” but @araignee changed it back. Who’s right? deisenbe (talk) 20:15, 27 November 2017 (UTC)
- Texas is at least arguably part of the Southwest United States. Either way, since the storm moved through New Mexico and other Western states, Texas is definitely not comprehensive enough. YE Pacific Hurricane 01:59, 28 November 2017 (UTC)
- Based on the other entries in the table, I was under the impression that "areas affected" includes the effects before and after a hurricane occurs (there are even a few tropical storms in the list)? I just changed it back to what it was before based on that assumption. If it's only for the areas hit by the hurricane-force storm, Texas would be the appropriate value. Otherwise, a more general label would be better, but I don't care if it's Southern or Southwestern. ~Araignee (talk • contribs) 17:17, 1 December 2017 (UTC)
Including then-costliest-places besides first edit
I support this proposal; we already have then-first-costliest. Care to differ or discuss with me? The Nth User 00:51, 10 January 2018 (UTC)
- I seriously see no reason why we should per WP:Trivia and WP:OR. I’m also not sure I’m a fan off indicating the costliest at the time per WP:OR and WP:Trivia.Jason Rees (talk) 03:15, 10 January 2018 (UTC)
- In most cases, there's probably a sure for the latter, but yea, this argument is basically WP:ILIKEIT, which to be fair is a very common trap for WPTC editors to face. YE Pacific Hurricane 04:45, 10 January 2018 (UTC)
Definitive sources edit
What is the definitive source for damages? I thought it was NOAA, but the numbers don't always seem to match. If NOAA, I'd expect this table to largely match this one, which it doesn't quite do. Then again, NOAA seems to only list damages in the US; how are damages (consistently) determined for other areas? ~Araignee (talk • contribs) 19:05, 26 January 2018 (UTC)
- That table has only just been released today and contains some significant updates to the damage totals for US hurricanes, which will need going through and combining with damage totals from other countries. I have made a start here.Jason Rees (talk) 19:56, 26 January 2018 (UTC)
- Ha, I didn't notice that the PDF was so recent! Some of the numbers were way different than even the previous reports, which is what got me searching and resulted in my finding that latest report. As for damage totals from other countries, what sources are considered the standard? ~Araignee (talk • contribs) 18:10, 30 January 2018 (UTC)
Chart Error? edit
How is it possible that hurricane Harvey be listed below Katrina in terms of costliest hurricanes, yet also be considered "the costliest hurricane at the time it dissipated"? If it were the costliest hurricane by the time it dissipated, in 2017, then it would be more costly than Katrina, which dissipated in 2005, and should be listed above, despite both having similar damage cost values. — Preceding unsigned comment added by EatEn (talk • contribs) 04:01, 12 February 2018 (UTC)
- The source we use shows lists Katrina above Harvey, despite them having similar damage totals.Jason Rees (talk) 21:34, 17 February 2018 (UTC)
- Should we put Harvey at the top, as it was more recent? Or Katrina because it was more intense? CooperScience (talk) 00:50, 15 March 2018 (UTC)CooperScience
Fixing edit
Could you please fix this chart, and pages about Harvey and Katrina. One aticle that's not on Wikipedia said Katrina's cost is $160 billion. So, could you please fix this article and articles about Harvey and Katrina? Please. — Preceding unsigned comment added by 2602:304:5D47:EC19:20AF:B374:240B:993E (talk) 21:20, 17 February 2018 (UTC)
- Inflation-adjusted are not included since it would require constant updating annually. Thus Katrina and Harvey hold the #1 spot. --MarioProtIV (talk/contribs) 22:04, 17 February 2018 (UTC)
- No, Harvey and Katrina are NOT tied. Thank You! — Preceding unsigned comment added by 2601:401:C400:357:90D:2C5F:3EF7:D329 (talk) 20:51, 26 February 2018 (UTC)
- Inflation-adjusted values are difficult to keep up with, and don't reflect the storm's actual damage at the time. Therefore, Harvey and Katrina hold the top spot together, although this may change if new estimates are released for Harvey, as damages are still being evalulated. CooperScience (talk) 01:38, 3 April 2018 (UTC)
Also, on a side note, should Katrina be at the top because it was more intense, or should Harvey because it is more recent? CooperScience (talk) 00:49, 15 March 2018 (UTC)CooperScience
- NHC lists Katrina on top so we will go with that for now. If Harvey should overtake it in the future then we will deal with then.Jason Rees (talk) 01:17, 15 March 2018 (UTC)
Updating edit
It has come to my attention that a some of the damage totals for storms listed here do not reflect the monetary damage values in their articles. Thus, we may need to update either this table or the respective storm articles to have the right damage values. If anyone has any sources for total damages from storms that caused damage in places elsewhere than the United States, could you add them in the comments section below this? Thank you! Cooper 16:48, 17 April 2018 (UTC)
- NHC updated some figures a while back. I remember seeing them be updated here but not in all the articles. YE Pacific Hurricane 17:06, 17 April 2018 (UTC)
- Eh I updated both in January. They should all be fine. TropicalAnalystwx13 (talk · contributions) 18:52, 17 April 2018 (UTC)
- Its still worth having a fresh pair of eyes on the damages especially in order to ensure we have them all reliably sourced.Jason Rees (talk) 21:03, 17 April 2018 (UTC)
- Eh I updated both in January. They should all be fine. TropicalAnalystwx13 (talk · contributions) 18:52, 17 April 2018 (UTC)
Oh, I see now, they seem to all be up to date, although as Jason said we might want to look further and find more sources (Like for Emily). Cooper 23:06, 17 April 2018 (UTC)
Chart edit
Could you please use the inflated version of the chart? Why, because it's better to not have a tie between Harvey and Katrina, and Katrina's cost was $160 billion. Please use the inflated version for ALL pages with the chart including this, Harvey, and Katrina. Please.— Preceding unsigned comment added by 2602:304:5d47:f779:1c16:becf:5668:1145 (talk • contribs)
 Not done We have explained repeatedly to you earlier why we won't do this.--Jasper Deng (talk) 02:00, 30 April 2018 (UTC)
Whither Hazel edit
Can someone please check on Hurricane Hazel (1954. Over $1G in Canada alone! About $3.6B in the US and x number of $ in the Caribbean). I can't believe it wasn't included. Maybe it wasn't that destructive, but from what I remember it was something else. I cannot figure out the formula as given in the article (hint hint). If you can't use the formula, why include it? 2001:1970:5324:D600:7DF5:A752:7871:B57F (talk) 14:25, 19 May 2019 (UTC)
- The article only includes storms with their unadjusted damage total, meaning not inflated. Because Hazel was so long ago, it would've caused over $1 billion nowadays, but it was only $382 million back in 1954 dollars. ♫ Hurricanehink (talk) 14:37, 19 May 2019 (UTC)
If the value is unadjusted, why show the formula for adjustment? I'm confused. 2001:1970:5324:D600:7DF5:A752:7871:B57F (talk) 14:45, 19 May 2019 (UTC)
Shouldn’t Hurricane Katrina be the costliest? edit
My argument is that Hurricane Katrina is the costliest storm because Katrina’s value was equivalent to Harvey’s without Katrina’s estimate being adjusted for inflation. Hurricane Katrina’s damage estimate would be around $150-160 billion in 2020 USD. HurricaneNerd (talk) 03:56, 1 February 2020 (UTC)
- The numbers in the table aren't adjusted for inflation alone. There are (raw) nominal estimates of the damage (the second column of the table), and (adjusted) normalized estimates which account not only for inflation but also for the change in property at risk to be damaged, which overall gives a more accurate comparison. All the numbers are from Weinkle et al. (2018). --bender235 (talk) 16:35, 2 February 2020 (UTC)
Inflation adjustment column. edit
The current chart has columns for the raw cost and normalized damage. Should there be a column in between that shows the inflation-adjusted cost? TornadoLGS (talk) 02:41, 29 April 2021 (UTC)
Ida Cost edit
KN2731 I saw that you reverted my edit re cost of Ida. I'm curious to know how to estimate cost of Ida currently given that the current source which mention >50B is also sort of an upper bound. (From the ref: "private firm estimating total damage from Ida could exceed $50 billion") | MK17b | (talk) 19:23, 5 September 2021 (UTC)
- @Mk17b: "could exceed $50 billion" means that $50 billion is a lower bound to Ida's damage, i.e. Ida caused $50 billion or more in damage. The Philadelphia Inquirer source you linked stated Ida could have caused up to $95 billion in damage, which I read as Ida caused $95 billion or less in damage. Anyway, it remains that the $95 billion figure originates from AccuWeather, which AFAIK doesn't specialise in financial modelling or risk analysis and I'd thus take their damage estimates with a pinch of salt. ~ KN2731 {talk · contribs} 14:23, 7 September 2021 (UTC)
Premature Damage totals edit
I started a discussion on Talk:Hurricane Ian#Premature Damage Totals over this issue. NOAA has not confirmed Ian caused $47 billion in damage. In fact, no one has. Everything (specifically CoreLogic) said 28 to 47 billion. That “28 to” is the key. There is so much to revert because currently, the damage totals for the 2022 Atlantic Hurricane season & Hurricane Ian are WP:OR. Elijahandskip (talk) 14:45, 1 October 2022 (UTC)
- Update: I have removed the information about Hurricane Ian for the moment and have removed the WP:OR tag. Info about Ian can be added when a more solid damage total has been cited. Elijahandskip (talk) 23:26, 1 October 2022 (UTC)
This is without a doubt, one of the costliest hurricane ever, and as numbers would change for a long time, this should be put on the list. AndrewHat250 (talk) 03:10, 2 October 2022 (UTC)
"will be close to $63 billion."
That "close to" is why we cannot put it on the chart yet. Also, I have seen damage ranges from 28-100 billion today alone from various articles. Wikipedia is not a place for guesses as everything has to be verifiable. A recent discussion sort of concluded that we tend to wait for Aon or NOAA damage totals, which will be out later this year. Also, only NOAA could declare if it was one of the top 10 costliest hurricanes ever, so we should not add it to the list until an Aon or NOAA damage total. If editors believe an exception should be made for Ian, then a separate discussion needs to take place basically saying that Karen Clark & Co is a reliable source for hurricane damage totals & to determine when it should be used. The discussion about Aon or NOAA totals basically concluded that anything on the NOAA billion-dollar disaster list should only list NOAA damage totals in the infobox. Since obviously, this will make that list (released later this year), we should wait. Elijahandskip (talk) 04:03, 2 October 2022 (UTC)- The discussion conclusion was:
- Aon damage totals are a reliable source for damage total information (RS Noticeboard discussion conclusion) and can be added to an article's content.
- Aon damage totals are acceptable for an articles/storms infobox if NOAA has not published a damage total.
- Aon damage totals are acceptable for an articles/storm infobox if a NOAA NCDC damage total is also present. This would have both damage totals in the infobox (format done to this article, Tornado outbreak of March 21–23, 2022.
- Aon damage totals are ok for an article's content (aka text portion of the article), but should not be added in the infobox if a NOAA Billion-Dollar Weather and Climate Diasters damage total is present, due to RS use of it over the Aon damage total.
- If we want to have a discussion for Karen Clark & Co, that is ok, but the results will most likely be the same as Aon, meaning for Hurricane Ian, we should wait for NOAA damage totals for the infobox and this list. Elijahandskip (talk) 04:05, 2 October 2022 (UTC)
- Really? Another debate? That’s unnecessary. However I do agree on the lower bound. That being said if CoreLogic does have a $28-47 billion dollar estimate, the $28 billion should be put into place. We use the lower bounds, not no bounds. Also Aon is coming out weirdly so there may not be an Aon until January. 173.68.184.70 (talk) 12:42, 2 October 2022 (UTC)
Wrong nominal values for adjusted values edit
The table shows nominal and adjusted values but the nominal values come from NOAA and the adjusted values come from the Weinkle et al paper. That explains oddities like Harvey (2017), which is listed with nominal of $125B and adjusted of $62B. Looking at the data in the supplementary materials of the Weinkle paper shows they used $60B as the nominal cost of Harvey. So it's very wrong to include the $125B and $62B figures together, at least without considerable annotation.
The paper attributes their nominal values to "historical loss estimates from the National Hurricane Center (1900-1924, 1998-2015), Monthly Weather Review (1925-1997) and Swiss Re and Aon Benfield (2016-2017)."
There are four readily available cost sources:
- Nominal from NOAA
- CPI-adjusted from NOAA
- Nominal from Weinkle
- Normalized-adjusted from Weinkle
The article currently shows 1 and 4. I think it would be useful to readers to show all of them instead of making a judgement here. However, just showing 3 and 4 with appropriate labeling would be an improvement over the current situation. Daggerbox (talk) 17:02, 18 February 2024 (UTC)