Talk:Laffer curve/Archive 2
| This is an archive of past discussions. Do not edit the contents of this page. If you wish to start a new discussion or revive an old one, please do so on the current talk page. |
| Archive 1 | Archive 2 | Archive 3 |
Neo-laffer curve
Huh, I could have sworn File:Neo-Laffer_curve.svg appeared in this article at some point. Why was this removed? --163.1.211.97 (talk) 10:14, 22 December 2011 (UTC)
1996 Hsing study
It appears that the study by Y. Hsing mentioned under "Research on revenue maximising tax rate" is only looking at the federal tax rate, not the total (income) tax. I base this on the abstract, which mentions a suggested increase in this rate to 36% - which must have been a federal rate. The full article is not available without payment.
Thus the numbers quoted are not comparable to the others in the same section. I have changed the article to reflect this, in a way that I hope is acceptable. — Preceding unsigned comment added by NisJorgensen (talk • contribs) 21:12, 4 July 2012 (UTC)
This is wrong
"However, since the Laffer curve is based on the theory that decreased tax rates result in greater tax revenue through increased economic activity, any study normalized to GDP is not really saying anything about the Laffer curve."
It does not state this when the decrease occurs on the left side of the maxima. — Preceding unsigned comment added by 203.26.147.254 (talk) 06:52, 23 May 2012 (UTC)
delete - double post
Parody Neo-Laffer Curve
I have some considerable reservation about this chart.
First off, the citation, is just "an article" and clicking on the link leads to a WSJ site blocked to non-subscribers. A proper citation would be in order. Moreover, the Wikicommons explanation says that the graph cannot be firmly attributed. Minor perhaps, but not proper.
Second, only about 30 countries are shown. Are they top economic performers? Chosen at random? cherry-picking? We have no way of knowing.
Third, the line connects every dot. If we are looking for trends, this is rather unusual.
Most importantly, the curve looks at corporate tax rates only and does not consider other taxation, nor does it take into account other variables. As just one 'for instance', a company paying x% corporate tax but no import duties may provide less revenue to the government than a company paying ½ x % tax and y% import duties.
With that in mind, I would submit that comparing eg UAE taxes to those in France is like comparing apples to oranges. A far more neutral/accurate way of considering the issue would be to compare revenues vs tax rates within the same nation over time.
While amusing, this chart must be considered unreliable and, absent some specific explanations and clarification, has no place in an encyclopaedia.
- I agree. It's stupid. Anyone could make that kind of a parody from any graph with a weak to medium-strong correlation. It adds no meaning or insight and should be removed. —Cupco 21:47, 7 September 2012 (UTC)
Diversity of opinion on the peak location
http://delong.typepad.com/sdj/2010/08/where-is-the-peak-of-the-laffer-curve.html has a decent survey. 5% or 80%? It's probably a good idea to go into more detail that economists are all over the map. —Cupco 21:47, 7 September 2012 (UTC)
33% peak

Recently watched this video from Prager University where they discuss the Laffer curve and a paper published in the American Economic Review The Macroeconomic Effects of Tax Changes: Estimates Based on a New Measure of Fiscal Shocks by Christina D. Romer, David H. Romer. According to the video, it suggests the peak of the curve is much lower then previously thought, and that it is actually around 33%. I didn't see this in the article, so we should consider including it. Morphh (talk) 20:10, 10 September 2012 (UTC)
- The same authors have a February 2012 paper in the same series saying 84%.[1][2][3] It's not just different economists who are all over the map. —Cupco 22:35, 10 September 2012 (UTC)
- I don't see that the paper states that conclusion. The blog articles seem to make such statements but only one specificly mentions the Laffer curve, but it appears to be based on faulty logic. The articles state that based on the figures, you could raise taxes up to 84 percent before people’s reduced incentives to make money would compensate for the higher tax rates. That's fine, but that is only part of what is considered in the Laffer curve. As one article stated after quoting the article "In other words, recent U.S. history shows that when you raise taxes on the rich, they don’t stop trying to make money: they just pay their lawyers and accountants more to avoid paying taxes." Exactly, that is what is measured - what is paid in taxes. So again, they stop trying to make money at 84%, but the Laffer curve doesn't measure when individuals stop trying to make money or the rate at which it reduces incentive to make more money - it measures how much money the government will get based on the rate, which history shows is much lower then the point described. Morphh (talk) 01:40, 11 September 2012 (UTC)
Just read the American Economic Review paper The Macroeconomic Effects of Tax Changes: Estimates Based on a New Measure of Fiscal Shocks by Christina D. Romer, David H. Romer. The video misrepresents it, or does some OR using it. In any case, some observations:
- The paper is about the Keynesian tax multiplier, not about the Laffer curve, the Laffer curve is not mentioned in the paper.
- The paper is estimating the non-balance budget Keynesian tax multiplier effect and finding a high sensitivity of output to tax changes w.r.t. non-balance budget changes in taxes. It contrasts this with balance budget changes in taxes and spending, and finds much high effects from the former, and much lower effect from the later (and also from when taxes are changed to stabilize the economy).
- The paper considers 11 quarters of data, or less than 3 years, which is generally considered the 'short-run' by macroeconomists. The Laffer curve is interested in long-run equilibrium effects.
As far as I can tell, the paper is unrelated to estimates about the maximum revenue tax rate (which usually considers the economy in long run equilibrium). Standard macroeconomics tell us that tax cuts spur investment and growth in the short run, and this paper confirms it. However, we shouldn't expect such tax cuts to have a permanent long run effect on the economy. LK (talk) 10:34, 11 September 2012 (UTC)
- BTW, if anyone is fooled into thinking Prager University is a real university, have a look at their Wikipedia article. It is essentially a website, "not an accredited university that grants degrees ... criticized for emphasizing conservative views in its videos". LK (talk) 10:50, 11 September 2012 (UTC)
- Just watched the whole video – talk about hidden biases and misrepresenting results. If anything the video is an argument for considering Prager University publications as not RS for anything except their own views. LK (talk) 10:59, 11 September 2012 (UTC)
Type of taxation
Not sure this is covered, but it might be worth looking for a source that makes a distinction that different types of taxes would likely produce different maximum revenue rates. The statements of maximum revenue rates seems to come from a point of income taxation on wages. However, other tax systems could have much different maximum rates, such as capital gains taxes or corporate tax rates, which have different incentives to earn or bring international tax competition. Different systems and infrastructures bring variances in tax avoidance and/or evasion (or an offsetting administrative burden of enforcement), which could greatly effect the maximum revenue rate. Even the same tax system could vary in maximum rate based on the country - depending on their enforcement, tax infrastructure, and political views/history of the populace. While discussing the peak, it seems we should clarify what tax structure is being measured and across what group. Morphh (talk) 13:45, 11 September 2012 (UTC)
Graphs removed

These graphs were removed because they "have little relevance and provide no context for the section's content". Why aren't they relevant to the Laffer curve? Do we need a source saying that the government gets more revenue when there are more jobs? For those of you who think they provide no context for the article, please say why. I think they explain a great deal. —Cupco 20:44, 3 October 2012 (UTC)
- While I agree that economic growth increases government revenue, I don't see that either one of these graphs makes that point. In addition, it would seem to have to have some direct connection to how this applies to the Laffer curve. The first graph is the average annual growth, which seems to suggest an optimal tax rate above 75% for economic growth. Obviously, this is WP:SYN and WP:POV - and at what point does it make use of the Laffer curve? And at what point does economic growth overtake the an increase in the tax? It's SYN on top of SYN, on top of SYN. Then we have the "The U.S. federal effective corporate tax rate, 1947-2011". How does this apply to the Relationship with supply-side economics? Am I looking for the Reagan years here to prove something? Laffer curve? I understand this stuff... imagine a user unfamiliar with this content. The graph has no relation to the content. It doesn't tell the user anything about the topic. Morphh (talk) 21:31, 3 October 2012 (UTC)
- As we discussed above, there is considerable disagreement as to whether the Laffer curve peaks above 70%, which the majority of the economists and almost all of the peer reviewed secondary literature says it does. The people with an opposing view say it peaks below 30%. The graphs are accurate representations of historical facts, and one of them agrees with the former of the two of the differing opposing views. Do you believe that because historical facts agree with one of the two differing opinions, that means the facts themselves are biased and synthesis? —Cupco 01:19, 4 October 2012 (UTC)
Laffer placed in "Other" Category
I find it curious that Laffer, the guy who came up with the Laffer curver, is slotted into the "other"category near the bottom of the Empiricle Data section, while the "The New Palgrave Dictionary of Economics", which is frankly so large I doubt the co-authors could have studied Laffer curves sufficiently to come up with a great result. Shouldn't the guy who came up with this be at the top of the Empiricle Data section? JettaMann (talk) 17:20, 5 December 2012 (UTC)
Recent claim based on blog post
I have removed[4] this recent addition by Skywriter to the section "Tax rate at which revenue is maximized":
and per capita Federal revenues have historically peaked during policy periods within that range.Cite error: The
<ref>tag has too many names (see the help page).[1] More recently Christina Romer, an economic adviser for President Obama, has also calculated the peak of the Laffer Curve with a maximum tax bracket at 33%.[2][3]
If one examines the sources, one can see that they don't back the claim, except for a single post from a right-wing blog, which is not RS for this academic issue. The sources are:
- White House, page 411 [5] which is a table of raw data with no discussion.
- Tax Policy Center, Historical Federal Receipt and Outlay Summary [6] which is a table of raw data with no discussion.
- An an economist, I can say that these tables do not back the argument being made. More relevantly for Wikipedia, tables without discussion are Primary sources, and cannot be used to justify a position. Doing so violates WP:OR, especially WP:SYN.
- Christina Romer,"The Macroeconomic Effects of Tax Changes: Estimates Based on a New Measure of Fiscal Shocks" [7]
- This paper is about the short-run macroeconomic stimulus effects of tax cuts, and is irrelevant to the Laffer curve, which is about the tax rate that maximises long run tax collection. The paper is irrelevant to this topic, and does not address the Laffer curve at all. A search for 'Laffer' in the article, finds no results. This paper does not back the claim being made. More relevantly for Wikipedia, in order not to violate WP:OR, sources used should be "directly related to the topic of the article, and directly support the material being presented." This paper is neither.
- From the right wing group blog, Ricochet: Right people, Right tone Right place, "The Laffer Curve and New Evidence that Taxes Stifle Economic Output", blog post by Tim Grose [8]
- This is a blog post from a partisan blog, and is not a reliable source for an academic issue. As an economist, I can also state that it is wrong and misleading, but that's irrelevant for Wikipedia.
LK (talk) 03:33, 15 January 2013 (UTC)
- Lawrence, please refer to the discussion I initiated above. It's difficult to have a discussion while you are ignoring what I wrote.
- To repeat, I'm neutral about which sources you would prefer for simple revenue data. There is a difference between an historical occurrence and a theory. Hsing offered a theory (which must be an academic RS), while the White House provided history (and the White House should indeed be a reliable source). As I wrote above, the statement "Babe Ruth happened to have a lot of strike outs while he was achieving his home run record" is NOT something that requires an academic paper, while the quite different statement of "linear-log analysis demonstrates that a home run record has a specific correlation with strike outs" would indeed require an academic paper.
- However, at this time the data does NOT support the Hsing paper, which I read in detail today, because the Hsing data itself is flawed. It arrived at the correct number for the maximum tax rate (per actual receipts), but then mistook a maximum tax rate for an average tax rate. An average tax rate of 35% in a progressive tax would give a maximum tax rate of 65%. Conversely, a maximum tax rate of 35% in a progressive tax would give an average tax rate of 19%. Hsing does not distinguish between the two, and he actually says "average", which cannot be supported by the historical receipts. Maximum rates of 65% are not even addressed by Hsing's paper, though they would be required for a 35% average rate.
- Hsing's paper, then, cannot be correlated with any of the sources I gave, because they would have supported a 35% max / 19% average, rather than a 65% max / 35% average.
- At this time there is no need for me to restore the White House source, since Hsing's paper is so poorly done that there is no way to match it with real history.
- I do plan to continue to look for sources, though, because this one isn't well represented by the excerpt.SkyWriter (Tim) (talk)
government revenue vs. tax revenue
Under "In political discourse", "Reaganomics":
According to the CBO historical tables, government revenue as a percentage of GDP increased from 31.8% in 1980 to 33.2% in 1989. [25]
The article Hauser's law, under "History:
From fiscal year 1946 to fiscal year 2007, federal tax receipts as a percentage of gross domestic product averaged 17.9%, with a range from 14.4% to 20.9%.[5] 2009 tax collections, at 15% of GDP...
If "31.8% in 1980" is the same kind of number that Hauser claimed was never far from 19.5%, the article on Hauser's law should note that Hauser's law failed from 1980 to 1989.
If there is a meaningful difference between "government revenue" and "federal tax receipts", either this mention of government revenue should be removed from the article on Laffer's curve, or there should be an explanation that this is a different type of measure, and there should be an explanation of what the citation is believed to illustrate.
Jmichael ll (talk) 03:12, 2 January 2013 (UTC) Government revenue would include state and local taxes as well as federal, so the two sets of numbers aren't really comparable (no doubt the actual figures would be on the CBO website and other reliable sources). --81.149.74.231 (talk) 14:55, 16 January 2013 (UTC)
About the recent additions
Discussion from the user talk pages:
Dear SkyWriter, I truly believe that you are a reasonable person and that you are here to improve the Encyclopedia. However, your additions to the article Laffer curve show that you are not taking seriously enough, our policies No Original Research and especially Synthesis. I don't have much time to edit now, so I won't be getting involved in Laffer curve anytime soon. But please, please do read and take to heart those policies. Especially, I would like to highlight for you in WP:NOR, where it says, "you must be able to cite reliable, published sources that are directly related to the topic of the article, and directly support the material being presented.", and "Even with well-sourced material, if you use it out of context, or to advance a position not directly and explicitly supported by the source, you are engaging in original research" And in WP:SYN, "If a single source says "A" in one context, and "B" in another, without connecting them, and does not provide an argument of "therefore C", then "therefore C" cannot be used in any article." LK (talk) 04:41, 18 January 2013 (UTC)
Lawrence, I also believe you are a reasonable person -- but you've accidentally stumbled into an unreasonable position that's prevented you from addressing my point: not all source requirements are equal.
Do you need an academic peer reviewed scientific paper that needs a 32 dollar payment even to access in order to know that Babe Ruth had a lot of strike outs AND a lot of home runs at the same time? No.
Such a paper may be required to prove a causal relationship between the two, but NOT their corresponding occurrence.
In any case, the Laffer Curve article is in bad shape. Nothing is well defined, and it shows.
The Laffer curve is at 70%.
The Laffer curve is also at 35%.
The Laffer curve is also at 35%. (that's not a typo)
The Laffer curve is also at 20%.
The first is top marginal tax rates on a single tax system (such as France). The second is average tax rates on a single tax system (such as France). The third is top marginal tax rates on a hybrid tax system (such as the United States, where the State and Local taxes are about 20% of GDP and the Federal government is also about 20% of GDP). The third is the average tax rates on a hybrid tax system.
Now, most of the academic journals listed are speaking of the first option, while Hsing is talking about the second option. NONE of them are even calculating what is popularly applied in blogs and news articles as the Laffer curve, and I don't think Laffer does either. That's the problem with the curve -- it's not well defined. Liberal sources tend to look at the calculation that is most natural for top marginal rates on a single tax system, and laugh at Laffer curve valuations in the 20s and 30s as utterly ridiculous and beneath mention. Conservative sources tend to look at the calculation that would apply to a hybrid tax system (since the term is popularized in the United States) and think the Liberal calculations are equally absurd.
Neither is wrong -- they are talking about entirely different things. And the article doesn't even address that. Anyone reading the current article could be left with the impression that BOTH state and federal tax rates should EACH be at 70%!
In any case, the distinctions need to be added to the article. Neither of us have a lot of time. That means we do NOT have time for edit warring. I don't CARE what sources you prefer, but they need to be used in such a manner that has some meaning and context.
The sources I used were specific for the Federal government's share of the tax pie. The sources that are there are for top rates on a single tax system. At least allow that to be mentioned, or Laffer himself would not be able to recognize his own curve.SkyWriter (Tim) (talk) 11:03, 18 January 2013 (UTC)
- You are still falling into the trap of OR. Per policy, a reliable source should exist for EVERY SINGLE POSITION OR ARGUMENT. Don't try to figure out the truth by integrating various sources and presenting that in the article. Only summarise the arguments and positions of what is in reliable sources. You additions to the article are a mishmash of OR and SYN. Please stop.
- BTW, the Laffer argument is quite clear that it assumes a single tax rate. So, average tax = marginal tax. If a source doesn't mention average or marginal rates, don't attribute such a view to them. LK (talk) 11:18, 18 January 2013 (UTC)
- That's not a trap of OR at all. The application of the Laffer curve was to FEDERAL tax rates. Can you even FIND a popular source that doesn't? The academic journals you listed gave two different rates: 35% and 70% as if they disagreed. I had to add the fact that they didn't disagree. That's not OR. It's just reading the material. Even worse, the Hsing article did NOT assume a single tax rate, since it presented itself as a study of FEDERAL tax rates (which by definition are in addition to State tax rates). Your article is nonsense unless it is defined. I invite you to do so, and am willing to help. But it does need to be defined.SkyWriter (Tim) (talk) 11:36, 18 January 2013 (UTC)
- Take a look at the chart on page 48 here: http://www.nber.org/papers/w15343.pdf?new_window=1
- You can see that the writer is measuring Federal tax rates alone -- not combined state, federal, and local. And you can also see that he is comparing them to other single tax rate countries. So, he is mixing a hybrid rate into a single rate as if they are on the same scale. It's not just a problem with the article, but with most of the papers that address the subject (including Laffer himself). Surely not ALL of the papers make this mistake. But you as an economist can see that the paper does not use a pristine assumption as you assert.
- I don't care which rate is "right" or "true." That's not our job as editors. Our job is to say what's out there. Well, the article needs a bit of detail or readers will be just as confused as the writer of that article.SkyWriter (Tim) (talk) 11:47, 18 January 2013 (UTC)
- BTW, just for giggles -- calculate the top marginal tax rate if the AVERAGE rate is 70% and the bottom rate is 5%, on a straight logarithmic progressive tax.SkyWriter (Tim) (talk) 12:03, 18 January 2013 (UTC)
- I'm done here, if you can't see, you won't. I'm sorry but the additions are uncited and original research, in that they are your conclusions which you draw from the sources, rather than what is stated in the sources themselves. The edits violate WP:V, WP:OR and WP:SYN. I have removed them, I realise that you will likely reinsert them, but I advise against it. LK (talk) 02:11, 19 January 2013 (UTC)
Lawrence -- there are three problems here:
First, as I said, the fact that more per capita revenues were raised at 35% rates is not a matter of interpretation, but history. It's a simple matter of record and does not require an academic source.
Second, academic sources must be put in the context THEY THEMSELVES set. The current state of the article is making those sources say something they do NOT say. The calculations for the Laffer curve are made in isolation -- that is, in the absence of ANY other taxes. As Hsing notes, the average tax burden peaks at 35%, and the maximum progressive tax peaks at 65% - 70%. The economic sources are all in agreement on this, as is the source I initially gave. But it needs to be STATED that these numbers are in the absence of any other tax, or people will think these academic journals are suggesting a 65% rate for the real Federal income tax, which they CANNOT. If the Laffer curve peaks at an average burden of 35% and a maximum progressive burden of 65%, that includes ALL taxes, not just one. Add a 5% SALES tax and the maximum potential for a progressive tax falls to 55%. Or if you have a 20% VAT tax instead the potential income tax rate peaks at 25%. If it's not stated in the article that the Laffer curve includes ALL taxes together, then the article says something the academic journals would never be irresponsible enough to say.
Third, collaboration is different from edit warring. If you don't like a source, improve it. It would have taken you ten minutes to find a source better to your liking, rather than the hour or two you've devoted to avoiding collaborative work. Wikipedia isn't king of the hill. It's a collaborative effort. And if you don't WANT to work with others, then for goodness sake don't get in their way. I've asked you several times what you want here, and I'll be glad to hunt for it WITH you. But edit warring is both counter-productive and a waste of time.
Worse -- it's left the article hanging with the impression that the Laffer curve can be applied to EACH TAX cumulatively. The journals do not say that, and so the article ITSELF is some bizarre OR you've created in the guise of avoiding it. Any competent economist would look at this article and laugh his head off.SkyWriter (Tim) (talk) 16:03, 20 January 2013 (UTC)
Graph removal
Guest2625, et al. File:US_high-income_effective_tax_rates.png is discussed here Talk:Taxation_in_the_United_States#Employment_Graphs. Such a highly criticized, redacted, non-peer reviewed and partisan graph (created by an Obama campaign donor in the hight of election) should be considered with weight and NPOV balance. I'm not sure how it directly relates to the Laffer curve and seemed more an injection of POV without proper balance. I don't see this as any reflection on Guest2625 when he edited the graph as I've seen him upload many great graphs, this one just happens to be an issue. It made sense to remove such a graph until consensus is achieved for actually adding it or a new graph found. Sorry if my edit caused disruption - I was just trying to work through the listed articles. Feel free to discuss here or at the Taxation in the United States article as appropriate for the scope of this article. Morphh (talk) 14:24, 6 January 2014 (UTC)
A tad Americocentric?
Obviously, the term originated in the USA, but do you not feel that the article gets just a little bogged down in US domestic policy,with insufficient explanation of its universal implications and impact around the globe? Jatrius (talk) 10:31, 29 April 2014 (UTC)
Needed in the lede: On what the the Laffer Curve actually is
In the 35 years since I first heard of the Laffer Curve during Reagan's run for President, I'm routinely amazed at how many people don't recognize what the Curve actually is. Even back in 1980, when the talking head nitwits on TV acted as if the Laffer Curve had arrived to us on a stone tablet from on high, I couldn't understand why no one realized that it's just the lower half of the supply/demand curve diagram that every college student learns in his freshman year. (I'm actually never surprised when TV's talking heads don't know something, as they never seem to know much about anything.) I would think that this rather obvious fact should be someplace in the article, probably in the lede.
Also, In reading the talk pages in the Archives, I've noticed several people stating that people would continue to work if the taxation rate were 100%. Really? If there are any people out there who are willing to work for free then I will gladly hire them on. If these people are willing to give 100% of their earnings to the government then they shouldn't mind giving it all back to me. Why do people say such ridiculous things? (It also stupidly ignores the fact that at an oppressive tax rate people would only work if they were paid under the table.)__209.179.51.170 (talk) 03:17, 18 September 2014 (UTC)
- If nobody is willing to voluntarily work for free, how does Wikipedia get written? Dunncon13 (talk) 19:35, 2 April 2015 (UTC)
- You get what you pay for. 40% of the information on Wikipedia is severely incomplete or just wrong. For example, I know much more about duty of care and insurance bad faith than I have contributed to those articles, but I am withholding that information for articles that I plan to publish under my own name some day. It's for this same reason that the article on Law in the United States is such an incomplete mess, because neither I nor all the experienced, hardworking lawyers or law professors out there have the six weeks to dedicate to writing a terrific (and not merely decent) treatment of the subject. --Coolcaesar (talk) 08:07, 3 April 2015 (UTC)
- Dunncon13 - you've confused work with hobby. People do things all the time for free for various reasons that have nothing to do with being paid money. If writing something on Wikipedia gives someone a positive sense of accomplishment then that is all of the "pay" they want. And look at it another way: if people had to pay actual money for their stuff to go onto Wikipedia, how big would it be today? 209.179.35.169 (talk) 03:57, 10 April 2015 (UTC)
External links modified
Hello fellow Wikipedians,
I have just added archive links to 2 external links on Laffer curve. Please take a moment to review my edit. If necessary, add {{cbignore}} after the link to keep me from modifying it. Alternatively, you can add {{nobots|deny=InternetArchiveBot}} to keep me off the page altogether. I made the following changes:
- Added archive https://web.archive.org/20110326082726/http://www.aei.org/docLib/20080528_GiertzPaper.pdf to http://www.aei.org/docLib/20080528_GiertzPaper.pdf
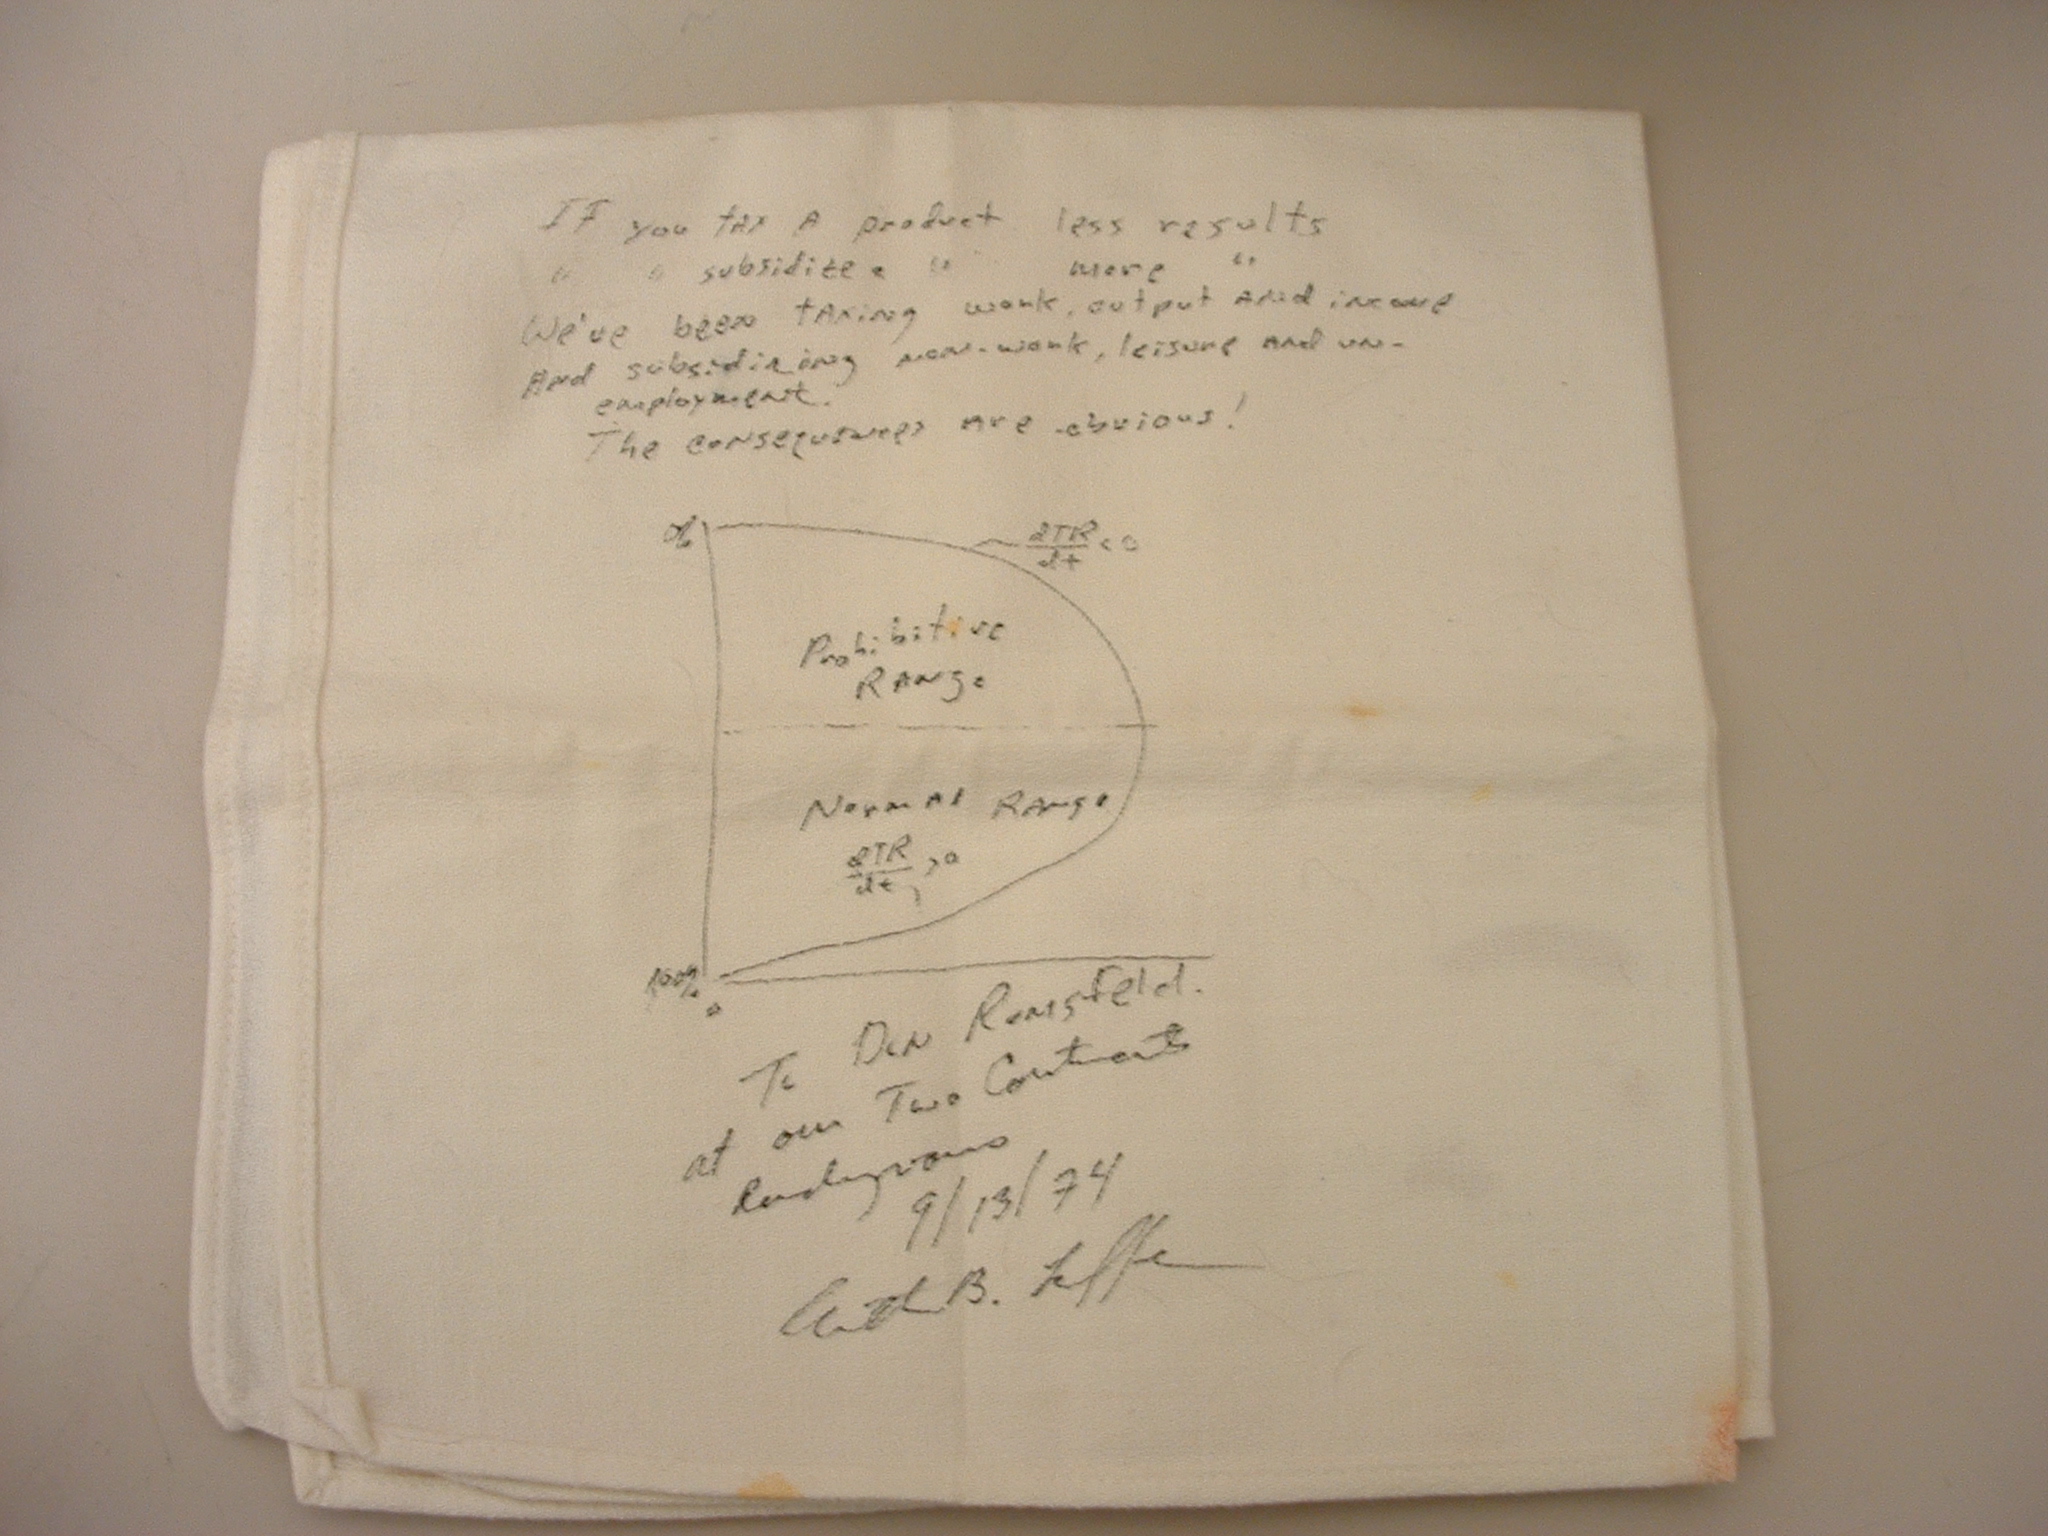
- Added archive https://web.archive.org/20110722020213/http://www.polyconomics.com/gallery/Napkin003.jpg to http://www.polyconomics.com/gallery/Napkin003.jpg
When you have finished reviewing my changes, please set the —cyberbot IITalk to my owner:Online 07:27, 25 August 2015 (UTC)
Per the discussion at supply-side economics talk, i think the line in the lede "In 2012, numerous leading economists have rejected the viewpoint that the Laffer Curve's postulation of increased tax revenue through a rate cut applies to federal US income taxes of the time in the medium term. When asked whether a “cut in federal income tax rates in the US right now would raise taxable income enough so that the annual total tax revenue would be higher within five years than without the tax cut,” none of the economists surveyed by the University of Chicago in 2012 agreed and 71% disagreed. [4]" needs to be at least modified to eliminate peacock terms, and should be moved from the lede, as it is not a hugely important criticism. Bonewah (talk) 12:53, 14 October 2015 (UTC)
- I agree, see my statements on the other article's talk page too, but I don't think it's a matter of it not being important; it's a matter of it not being criticism of the Laffer curve. These economists just state that a specific country, the US, at a specific time, 2012, is/was not at the tipping point in the curve. LjL (talk) 13:12, 14 October 2015 (UTC)
- Yes, exactly, it doesn't really belong in the lead. Absolutelypuremilk (talk) 15:05, 14 October 2015 (UTC)
References
- ^ http://www.taxpolicycenter.org/taxfacts/displayafact.cfm?Docid=200
- ^ http://ricochet.com/main-feed/The-Laffer-Curve-and-New-Evidence-that-Taxes-Stifle-Economic-Output
- ^ http://www.aeaweb.org/articles.php?doi=10.1257/aer.100.3.763
- ^ http://www.igmchicago.org/igm-economic-experts-panel/poll-results?SurveyID=SV_2irlrss5UC27YXi
- I don't have a problem with this being removed from the lede on the Laffer Curve article. I agree that it only says where we are on the curve. I would like to see someone add an edit for the lede that says the peak of the curve is the tax rate that maximizes government taxation, which is the whole point of the Laffer Curve. Lipsquid (talk) 17:10, 14 October 2015 (UTC)
- The end of the first paragraph says "there must be at least one rate where tax revenue would be a non-zero maximum." which is a little unwieldy, what about "there must be at least one rate which maximises taxation income." ? Absolutelypuremilk (talk) 19:14, 14 October 2015 (UTC)
Could you say "government taxation revenue" instead of "taxation income"? I agree that what you put above is much better than the current sentence which is unnecessarily complexly worded. So whichever you prefer I would fire away on that as I doubt anyone would disagree. Lipsquid (talk) 20:48, 14 October 2015 (UTC)
- Yes I have done that now Absolutelypuremilk (talk) 22:26, 14 October 2015 (UTC)
"Other" section
This is a faulty edit and i believe should be reworded or deleted.
- Laffer has presented the examples of Russia and the Baltic states, which instituted a flat tax with rates lower than 35% and whose economies started growing soon after implementation. He has similarly referred to the economic outcome of the Kemp-Roth tax act, the Kennedy tax cuts, the 1920s tax cuts, and the changes in US capital gains tax structure in 1997.[3]
The Laffer Curve is a formula regarding maximizing tax revenue and makes no claims on GDP growth that doesn't include taxation growth Lipsquid (talk) 19:34, 21 November 2015 (UTC)
- That would depend on whether the Laffer curve includes future govt revenue - I have not seen (from a very quick glance at the article) any sources that say that it only applies to current govt revenue, and even if there were sources that said this, I am not sure that this would not apply e.g. if a govt said it would lower tax rates in the future, economic activity could increase due to the announcement and therefore current govt revenues could increase Absolutelypuremilk (talk) 11:36, 23 November 2015 (UTC)
RfC on the Laffer Curve, economists poll
I have opened an RfC on the economists poll and the Laffer curve on the Jude Wanniski talk page. The discussion is similar to what we discussed above, if you participated in that discussion, I would appreciate your comments on that RfC as well. Thanks. Bonewah (talk) 15:30, 23 November 2015 (UTC)
- It may be relevant to this RfC's outcome to mention that the passage in question has been added again to this article (into the lead section!) after some time, under the pretence of an "ungoing edit war" about it. This is even though there seemed to be agreement to leave it out (including by the editor reinstating it now, at least from the lede). Let's please determine whether this RfC's consensus applies. LjL (talk) 23:58, 4 February 2016 (UTC)
The rules for an RfC are here https://en.wikipedia.org/wiki/Wikipedia:Requests_for_comment Lipsquid (talk) 07:45, 5 February 2016 (UTC)
- BTW Bonewah has deleted this paragraph 5 times in the last 6 months. that is by definition a person guilty of edit warring. He should get a topic ban. Lipsquid (talk) 07:52, 5 February 2016 (UTC)
- An RfC on a different article does not apply to this article. What may be right for an article on one topic, may be wrong for an article on another topic. I don't have a problem with this being in the lede (except for the "it's a Laffer" quote), especially since those polled are the top of the profession.Volunteer Marek (talk) 08:02, 5 February 2016 (UTC)
- That may be so in general Volunteer Marek, but I don't see why that is that not the case here - surely all the same reasons apply? Absolutelypuremilk (talk) 09:16, 5 February 2016 (UTC)
- Well, no. One can argue that criticisms of the Laffer curve are only loosely related to the topic of Jude Wanniski (I actually disagree but nm). But obviously criticisms of the Laffer curve are more than loosely related to the topic of... the Laffer curve.Volunteer Marek (talk) 14:18, 5 February 2016 (UTC)
- Except that is only a small part of why the edit in question was rejected. Nowhere in the reference provided is there any mention of "the empirical relevancy of the Laffer Curve", describing it as such here is clearly WP:OR, irrespective of what article it appears in. In any event the Onus is clearly on you and lipsquid to demonstrate that there is some reason why this material should be included. Bonewah (talk) 15:58, 5 February 2016 (UTC)
- Except "rejecting the empirical relevancy" is just a description of what the source says. It's called paraphrasing (maybe I used "big words" or something but so what, this is an encyclopedia). Previously it said "rejected the rationale" which was a misrepresentation of the source. None of these guys and gals said "the theory behind the Laffer Curve is wrong". They all said "the results that Laffer emphasized are irrelevant to the real world". So no, it's not OR except for some upside-down definition of OR where describing a source accurately is OR but misrepresenting it (perhaps with the purpose of eventually removing it altogether) is not.
- And no, WP:IJUSTDONTLIKEIT is not a sufficient grounds for removal. Look, we know what's going to happen here. No matter the argument, the sources, the policies, you're going to object to this material. You've been engaged in like a two year long slow moving edit war over this (perhaps it's time to drop the stick and step away from the horse carcass?). So when you bring up WP:ONUS you're clearly doing so in bad faith in an attempt to WP:GAME Wikipedia policy.Volunteer Marek (talk) 16:32, 5 February 2016 (UTC)
- We had this discussion over at Supply-side economics and came to the somewhat consensus that we should describe the poll in a much more neutral fashion and not in the lede. Im sure you remember as you participated in that very conversation. This is why this article already contains this information in the "other" subsection: "In 2012, economists surveyed by the University of Chicago rejected the viewpoint that the Laffer Curve's postulation of increased tax revenue through a rate cut applies to federal US income taxes of the time in the medium term. When asked whether a “cut in federal income tax rates in the US right now would raise taxable income enough so that the annual total tax revenue would be higher within five years than without the tax cut,” none of the economists surveyed agreed and 71% disagreed". Why you are so insistent that we add this information again, in the lede, with wording that was already rejected is beyond me.
- As for the rest, ive only been at this for a few months and would be done by now if it hadnt been for you and lipsquid constantly re-adding the same material and insisting that we go over the same ground over and over again. Its beyond absurd that after insisting that I start an RfC, that was closed in favor of exclude, that you think you can simply re-add this material and that *I* should drop the stick. Sophistry, pure and simple. I bring up ONUS because any reasonable, good faith editor would agree that after loosing an RfC about this exact topic, that the onus is on you to establish that this case is different. Bonewah (talk) 17:57, 5 February 2016 (UTC)
- First, that wasn't actually the outcome of that discussion. The relevant link (which you failed to provide) is here. Second, there was indeed some rough consensus for rewording the phrasing. Which is exactly what I have just done! And now you're here objecting to that! That sort of shows that you're not discussing this issue in good faith - you seem to have a "my way or the highway" approach to this topic (as also evidenced by your two-year long edit war about it, against multiple editors). Third, there's absolutely nothing absurd, nor is there any "sophistry" involved, about the fact that what may be off-topic in one article (Jude Wanniski) is perfectly on topic in another (the Laffer Curve). This has been explained repeatedly to you over and ... over and over and over and over and over and over and over and over and over and over and over and over and over and over again, yet you still pretend like you've never heard that before. Classic WP:IDIDNTHEARTHAT behavior. So please, stop lecturing others about "good faith" and start acting with some yourself. No legitimate reason for removal has been provided except "some RfC somewhere else" or "original research!" (which is bunk, as has been also explained).Volunteer Marek (talk) 18:04, 5 February 2016 (UTC)
- Except that is only a small part of why the edit in question was rejected. Nowhere in the reference provided is there any mention of "the empirical relevancy of the Laffer Curve", describing it as such here is clearly WP:OR, irrespective of what article it appears in. In any event the Onus is clearly on you and lipsquid to demonstrate that there is some reason why this material should be included. Bonewah (talk) 15:58, 5 February 2016 (UTC)
- Well, no. One can argue that criticisms of the Laffer curve are only loosely related to the topic of Jude Wanniski (I actually disagree but nm). But obviously criticisms of the Laffer curve are more than loosely related to the topic of... the Laffer curve.Volunteer Marek (talk) 14:18, 5 February 2016 (UTC)
- That may be so in general Volunteer Marek, but I don't see why that is that not the case here - surely all the same reasons apply? Absolutelypuremilk (talk) 09:16, 5 February 2016 (UTC)
Lets keep this simple. this edit which contains all the information you are so obsessed with, was added on Oct 9 and has been fairly stable since. On feb 4th Lipsquid added this edit which duplicates the information from the previous edit, but with, in my opinion much worse wording, which is what your re-adding as well. What is your justification for adding this duplicate material? Bonewah (talk) 19:30, 5 February 2016 (UTC)
- It is already in the article in the "Other" section. As per earlier discussions, not only is the wording of the first sentence OR (it extrapolates from "federal income taxes" to all taxes in the USA), but it is far too specific to be placed in the lead - it refers to US federal income taxes in 2012. Absolutelypuremilk (talk) 19:38, 7 February 2016 (UTC)
- I think you might have missed my second sentence - not only is the wording of the first sentence OR (it extrapolates from "federal income taxes" to all taxes in the USA), but it is far too specific to be placed in the lead - it refers to US federal income taxes in 2012. Absolutelypuremilk (talk) 09:32, 8 February 2016 (UTC)
- I did miss it, i ignored it because it has been brought up countless times already. A quote from a reliable source can't be [WP:OR] and bringing it up 10 more times won't change the fact that it is not original research. Also, I read the second part and tax cuts don't raise revenue unless the tax rate is on the right side of the Laffer Curve, (this is an integral part of the theory and highly doubt you want to dispute that). We are no where near the right side of the curve, according to the various reliable sources quoted in the article. I can't think of anything more important that the average reader needs to walk away knowing if interested in the theory. Lipsquid (talk) 17:01, 8 February 2016 (UTC)
- I think you might have missed my second sentence - not only is the wording of the first sentence OR (it extrapolates from "federal income taxes" to all taxes in the USA), but it is far too specific to be placed in the lead - it refers to US federal income taxes in 2012. Absolutelypuremilk (talk) 09:32, 8 February 2016 (UTC)
- The first sentence is OR, not the second. If you want to include quotes from people in the source, then go ahead, but I don't see how you can say it is suitable for the lead. How exactly is the most important thing about the Laffer curve that four years ago, economists thought that in the case of one specific tax in one specific country, it would not increase revenue? Absolutelypuremilk (talk) 18:17, 8 February 2016 (UTC)
- Do we have any other studies of the effects of the Laffer Curve on current tax policy? I am all for more sources. It seems no one does research on it. My guess is because the subject is not worth researching, I can't think of any other reason for the lack of academic research. Lipsquid (talk) 02:15, 9 February 2016 (UTC)
- Not that I know of, I presume that its because it would be difficult to do this empirically, with so many other factors affecting tax take. If you can't find a source that says "Most economists think that a majority of countries are on the right hand side of the Laffer curve" or similar, then I don't think it should be in the lead and I will remove it. Absolutelypuremilk (talk) 14:07, 9 February 2016 (UTC)
- Proving a negative is a fool's errand. Instead, until you can find a source that says the majority of countries are on the right side of the the Laffer curve, I think we should stay with the RS we currently have. We have no other reliable sources, we can't remove the only sourced information we have because you don't like the outcome. If you have a current poll that says some majority of economists or academics all think a tax cuts will raise revenues, by all means add it. Lipsquid (talk) 16:48, 9 February 2016 (UTC)
- I'm not saying it should be removed, it should merely not be in the lead as it is too specific. Seeing as we don't have sources saying that either a majority countries are on the right side or the left side, it shouldn't be in the lead. Absolutelypuremilk (talk) 17:01, 9 February 2016 (UTC)
- We are discussing it on the talk page and you go ahead and change it again anyway. Nice work! Lipsquid (talk) 23:03, 9 February 2016 (UTC)
- It was already discussed on the talk page and it was agreed that it shouldn't be in the lead. You then re-added it earlier (22:30 4th Feb) - we then started our current discussion which does not have a consensus for inclusion so I removed it until it has been resolved. The information is now in both the "problems" section and the "other" section. I presume that you would prefer it in the "problems" section? I will remove it from the "other" section in a couple of days unless you object. Absolutelypuremilk (talk) 23:51, 9 February 2016 (UTC)
- We are discussing it on the talk page and you go ahead and change it again anyway. Nice work! Lipsquid (talk) 23:03, 9 February 2016 (UTC)
- I'm not saying it should be removed, it should merely not be in the lead as it is too specific. Seeing as we don't have sources saying that either a majority countries are on the right side or the left side, it shouldn't be in the lead. Absolutelypuremilk (talk) 17:01, 9 February 2016 (UTC)
- Proving a negative is a fool's errand. Instead, until you can find a source that says the majority of countries are on the right side of the the Laffer curve, I think we should stay with the RS we currently have. We have no other reliable sources, we can't remove the only sourced information we have because you don't like the outcome. If you have a current poll that says some majority of economists or academics all think a tax cuts will raise revenues, by all means add it. Lipsquid (talk) 16:48, 9 February 2016 (UTC)
- Not that I know of, I presume that its because it would be difficult to do this empirically, with so many other factors affecting tax take. If you can't find a source that says "Most economists think that a majority of countries are on the right hand side of the Laffer curve" or similar, then I don't think it should be in the lead and I will remove it. Absolutelypuremilk (talk) 14:07, 9 February 2016 (UTC)
- Do we have any other studies of the effects of the Laffer Curve on current tax policy? I am all for more sources. It seems no one does research on it. My guess is because the subject is not worth researching, I can't think of any other reason for the lack of academic research. Lipsquid (talk) 02:15, 9 February 2016 (UTC)
- The first sentence is OR, not the second. If you want to include quotes from people in the source, then go ahead, but I don't see how you can say it is suitable for the lead. How exactly is the most important thing about the Laffer curve that four years ago, economists thought that in the case of one specific tax in one specific country, it would not increase revenue? Absolutelypuremilk (talk) 18:17, 8 February 2016 (UTC)
- Lipsquid, you previously agreed to the version of this article that did not have this material in the lede and was worded as we have it in the "other" section. See here where you said "I don't have a problem with this being removed from the lede on the Laffer Curve article" Further you agreed to the state of the article on Oct 15th saying "Thank you for the edit, I like it much better!" which was the last message in that thread. Whats changed? Why the need to put this back into the lede with wording that you previously agreed needed to be changed? Bonewah (talk) 19:55, 8 February 2016 (UTC)
Are we starting an RfC here or what? FoCuS contribs; talk to me! 14:29, 9 February 2016 (UTC)
- I think this material should remain out, as previously discussed. Capitalismojo (talk) 04:10, 10 February 2016 (UTC)
Laffer curve and economist poll yet again
Ok we have at least resolved (again) the question of where the material in question should go here. Now lets talk (again) about why the wording of this edit is problematic. Here is at least some of the reasons (again) why this edit was changed:
- What we have now is pretty clearly wp:OR. Nowhere does the source cited ask the question "Do you reject the empirical relevance of the Laffer Curve for the United States?" They only ask if "A cut in federal income tax rates in the US right now would raise taxable income enough so that the annual total tax revenue would be higher within five years than without the tax cut." Which is not the same thing. No where in the article cited do "96% of economists surveyed" say anything like what we say here. Moreover, the Laffer curve isnt even directly mentioned in the question, it only appears in the title of this section and in some of the responses, some of which clearly do not "reject the empirical relevance of the Laffer Curve". Consider Robert Hall's response "In addition, few studies suggest we are already at the max of the Laffer curve, though we may be close." or Edward Lazear "This is the Laffer curve issue. There is little (if any) evidence that rates exceed revenue-maximizing levels. See Mankiw, Feldstein." Neither of those two sound like they are rejecting the relevance of the Laffer curve, and assuming that the rest of the economists surveyed do is clear OR.
- its citation's survey is highly specific to one tax (federal income tax), in one place (The US), at one time (2012). Thats a pretty US specific data point for a general discussion of the matter and expanding it to apply to the Laffer curve generally is western centric.
- expanding on my first point, even if we accept that this is not OR, we are misconstruing what the source actually says. Most of the economists surveyed didnt comment on the Laffer curve per se, only saying agree or disagree. Of the 40 economists listed, only 12 even commented at all, only 4 or 5 of the comments unequivocally reject the Laffer curve (maybe slightly more depending on how you read them). There is no reason to believe that those who disagree necessarily reject the Laffer curve. Of the ones that did comment 5 or 6 responded in such a way as to indicate that they actually accept the Laffer curve despite 5 of them responding disagree to the question.
And of course, because lipsquid and volunteer Marek refuse to acknowledge any argument that isnt specifically on the page in question, no matter how redundant that makes these discussions, i will cut and paste the bulk of this argument over to Art Laffer so that we can all have the exact same discussion (again). I encourage the participants here to go there and weigh in (again). Further, since we have a number of editors who agree that this material should either be excluded entirely or modified to reflect what the source actually says, i am going to change the article based on that consensus. If you want to re-add it, it is incumbent upon you to both make your argument here, and gain some kind of consensus before changing the article. Bonewah (talk) 15:39, 12 February 2016 (UTC)
Right the same as last time, first get what you don't like moved lower in the page, to which people reluctantly agree and accept. Then start asking for it to be removed in entirety. You are the one who keeps asking for changes to the article, as you are here after only a day or two after a reluctant consensus was reached. Also, you are way, way, way over 3RR. Please stop. Lipsquid (talk) 18:54, 14 February 2016 (UTC)
Problems and The Economists Polled
I have a sincere problem with the usage of the economist poll as evidence of a 'problem' with the Laffer Curve. In this article, the Laffer Curve is presented to reach an apex at 70% taxation (though the number would theoretically be much lower if regulation and tax code complications were removed). The poll asks economists whether a tax cut would improve taxable income and the overwhelming majority said no. This does nothing to present a problem to the Laffer Curve, it simply means our current taxation rate is considered lower than the optimal taxation rate on the curve. Additionally, we need to be more precise about who these economists are and why the poll is significant. Are all of these economists hired by news organizations? Are they university professors? How do we know the poll measures truth rather than political bias or simply ignorance of the truth? --SelfpediaDotOrg (talk) 02:51, 3 March 2016 (UTC)
- First, Welcome to Wikipedia! The bio's of all of the respondents can be found on the same page by scrolling down. Most of them are Professors with PHDs in Economics, we quote reliable sources, which this is, to avoid problems with bias or ignorance. It is very hard to find any academic studies of the Laffer Curve, many editors have tried to find additional studies, myself included. I would certainly very much like to see a reliable academic study myself. Lipsquid (talk) 02:41, 4 March 2016 (UTC)
- Agreed, possibly because it is a matter of opinion whether taxes in one country are at the peak of the Laffer curve, so the only way to study it is to ask a range of professors what their opinion is. Clearly it would be almost impossible to have a scientific experiment (you would need to be able to control for all possible other factors affecting tax income which is plainly extremely difficult). Possibly we could move this poll to a subsection of "Problems" under the title "Applicability to current tax rates"? Absolutelypuremilk (talk) 09:46, 4 March 2016 (UTC)
- I ok with creating a subsection if that is what other editors want. @SelfpediaDotOrg, I think its worth browsing the list of responses in the citation. Per above, a number of them responded in such a way as to indicate that they simply felt the question was vague, or that the Laffer curve applied, but not at current rates, etc. Also, I would very much appreciate editors from here commenting on this same issue on the talk page of Art Laffer, thanks. Bonewah (talk) 15:45, 4 March 2016 (UTC)
- Agreed, possibly because it is a matter of opinion whether taxes in one country are at the peak of the Laffer curve, so the only way to study it is to ask a range of professors what their opinion is. Clearly it would be almost impossible to have a scientific experiment (you would need to be able to control for all possible other factors affecting tax income which is plainly extremely difficult). Possibly we could move this poll to a subsection of "Problems" under the title "Applicability to current tax rates"? Absolutelypuremilk (talk) 09:46, 4 March 2016 (UTC)
- The article is pretty stable and this section addresses the position that tax cuts can be offset by growth/demand. Is it a point in time? Yes, all polls occur at a specific point in time. If you have another poll with the same quality of reliable sources that says something contrary to what this poll says, I encourage it to be posted. Otherwise, this is all we have. If the poll results were shocking and worthy of discussing in academia, we would have another poll by now. Lipsquid (talk) 04:41, 5 March 2016 (UTC)
Are all of these economists hired by news organizations? Are they university professors? How do we know the poll measures truth rather than political bias or simply ignorance of the truth? - Yes, they are university professors and not just any university professors, but pretty much the top of the field.Volunteer Marek (talk) 16:14, 4 March 2016 (UTC)
An even bigger objection
Good grief. The single biggest objection to this silly conception is that the system under taxation is memoryless, allowing it to be described by a simple, functional curve, rather than twenty feet of used dental floss sandwiched between two glass plates, or a Jimi Hendrix shower curtain that hasn't been cleaned in months. No normal human economy ever is memoryless (memoryless: if you return to the same place on the curve and repeat the same polity change, you always get the same result). — MaxEnt 22:59, 2 May 2016 (UTC)
- Preaching to the choir here... and people wonder why they can find no academic studies on the topic. Lipsquid (talk) 02:58, 3 May 2016 (UTC)
- I don't think that anyone has argued that it is memoryless? Absolutelypuremilk (talk) 08:01, 3 May 2016 (UTC)
- To the best of my knowledge, the Laffer Curve is meant to be a conceptual pedagogic tool, not a close approximation of taxation and revenue generation. You should think of it in the same way you think of simplified supply and demand curves: a tool to teach people the relationship between two things. Its a concept, not a law. Bonewah (talk) 13:42, 4 May 2016 (UTC)
- Right it is a possible theoretical tool and not a close approximation of anything. It says nothing, predicts nothing. 14:07, 4 May 2016 (UTC)
- To the best of my knowledge, the Laffer Curve is meant to be a conceptual pedagogic tool, not a close approximation of taxation and revenue generation. You should think of it in the same way you think of simplified supply and demand curves: a tool to teach people the relationship between two things. Its a concept, not a law. Bonewah (talk) 13:42, 4 May 2016 (UTC)
- I don't think that anyone has argued that it is memoryless? Absolutelypuremilk (talk) 08:01, 3 May 2016 (UTC)
- Preaching to the choir here... and people wonder why they can find no academic studies on the topic. Lipsquid (talk) 02:58, 3 May 2016 (UTC)
Dr. Chen's comment on this article
Dr. Chen has reviewed this Wikipedia page, and provided us with the following comments to improve its quality:
In general the quality is good. One revision for the statement "Graphical representations of the curve sometimes appear to put the rate at around 50%,..." is to add some words after the word 50%, "if the tax base reacts to the tax rate linearly." Otherwise, the maximum tax rate would not be at 50%.
We hope Wikipedians on this talk page can take advantage of these comments and improve the quality of the article accordingly.
Dr. Chen has published scholarly research which seems to be relevant to this Wikipedia article:
- Reference : Been-Lon Chen & Chih-Fang Lai, 2014. "Effects of Labor Taxes and Unemployment Compensation on Labor Supply in a Search Model with an Endogenous Labor Force," IEAS Working Paper : academic research 14-A015, Institute of Economics, Academia Sinica, Taipei, Taiwan.
ExpertIdeasBot (talk) 16:35, 19 May 2016 (UTC)
Two graphs in the article
The two graphs seem to visually contradict each other and one of them should probably be removed. Lipsquid (talk) 20:18, 31 July 2016 (UTC)
Tax cut evidence?
The introduction states that "economists have found little support for the claim that tax cuts increase tax revenues". However, the whole point of the Laffer curve is that there would be zero revenue at 100%; thus, cutting taxes from 100% should increase revenues. Possibly, some other starting point is meant, but then it should be stated... Piramidon (talk) 14:36, 19 August 2016 (UTC)
- But will cutting rates from 90% increase revenues? How about 60%? Will cutting taxes from 20% raise taxes. No government charges 100% taxation, why would we use a non-existent data point as the entire justification? What does the source actually say? Lipsquid (talk) 04:43, 22 August 2016 (UTC)
- Surely it should say "changing economists have found little support for the claim that tax cuts from current rates increase tax revenues" Absolutelypuremilk (talk) 07:50, 22 August 2016 (UTC)
Terminology
What is a "stylized graph?" I have degrees in math and engineering, and have never heard of such a thing; neither does a Google search turn up any significant hits. Perhaps this should just read "graph?" — Preceding unsigned comment added by 76.3.219.131 (talk) 17:15, 30 April 2011 (UTC)
vague
"There is serious doubt about the relevance considering a single marginal tax rate."
The relevance of what? Of considering a marginal tax rate? Of the curve? Vague. Surely the curve. But needs clarity. — Preceding unsigned comment added by 68.183.100.3 (talk) 04:57, 7 February 2012 (UTC)
Records and Analysis
Lawrence, there is a difference between simple records and analysis.
An academic study says, "things must be this way."
Simple record says, "this happened."
A record doesn't say, "what happened could not have been otherwise" but rather "this happened to occur." It's like saying "Babe Ruth happened to have a lot of strike outs during his period of home run hits." Almost anything can serve as a source for the latter, and since this is a simple matter of record, I really don't care WHAT source you want to use. It's just boring news about 2000s tax revenues that HAPPENED to agree with the theory predicted by Hsing in the 1990s. Let's not war about the news, but work together until you're okay with it.SkyWriter (Tim) (talk) —Preceding undated comment added 12:49, 14 January 2013 (UTC)
Just to be clear -- I'm not interested in an edit war, but rather looking for how to collaborate on something non-controversial. The controversy is in the theory of what must and should optimize tax revenue (which involves academic sources). The non-controversial material is the simple history of what levels have experienced maximum revenues so far. That's no more controversial than Babe Ruth's batting average. It says nothing about what must or should occur, but rather reports on what has so far. Since the record happens to fall within the range of one academic source already listed in the article, and the Romer paper I added, it is certainly of interest in the article. There's no reason not to list it, and if maximum revenues change to correspond to a different academic theory, then it's a simple matter of updating it.SkyWriter (Tim) (talk) —Preceding undated comment added 14:44, 14 January 2013 (UTC)
Graph by Delphi234
In the "tax revenue growth" graph by Delphi234, I cannot find references for the growth in tax revenue, the sources provided take me to data about income per capita. Can anyone verify this graph? Absolutelypuremilk (talk) 08:39, 28 September 2016 (UTC)
Where's the dispute?
I'm guessing there are two aspects to the Laffer curve controversy. First, that there is even such a thing as "maximizing government revenue by tweaking tax rates". Second, that "we" are "now" at a point where cutting, maintaining, or increasing a particular tax rate would result in (a) more government revenue or (b) some sort of general boost to the economy.
If these are the main controversial aspects, then refer to them in the intro and discuss them in detail further on? --Uncle Ed (talk) 15:22, 8 February 2017 (UTC)
External links modified
Hello fellow Wikipedians,
I have just modified one external link on Laffer curve. Please take a moment to review my edit. If you have any questions, or need the bot to ignore the links, or the page altogether, please visit this simple FaQ for additional information. I made the following changes:
- Added archive https://web.archive.org/web/20071201225944/http://www.heritage.org/Research/Taxes/bg1765.cfm to http://www.heritage.org/Research/Taxes/bg1765.cfm
When you have finished reviewing my changes, you may follow the instructions on the template below to fix any issues with the URLs.
This message was posted before February 2018. After February 2018, "External links modified" talk page sections are no longer generated or monitored by InternetArchiveBot. No special action is required regarding these talk page notices, other than regular verification using the archive tool instructions below. Editors have permission to delete these "External links modified" talk page sections if they want to de-clutter talk pages, but see the RfC before doing mass systematic removals. This message is updated dynamically through the template {{source check}} (last update: 18 January 2022).
- If you have discovered URLs which were erroneously considered dead by the bot, you can report them with this tool.
- If you found an error with any archives or the URLs themselves, you can fix them with this tool.
Cheers.—InternetArchiveBot (Report bug) 13:16, 10 May 2017 (UTC)
External links modified
Hello fellow Wikipedians,
I have just modified 3 external links on Laffer curve. Please take a moment to review my edit. If you have any questions, or need the bot to ignore the links, or the page altogether, please visit this simple FaQ for additional information. I made the following changes:
- Added archive https://www.webcitation.org/5yWZxy6RC?url=http://www.nationalaffairs.com/doclib/20080528_197805001taxesrevenuesandthelaffercurvejudewanniski.pdf to http://www.nationalaffairs.com/doclib/20080528_197805001taxesrevenuesandthelaffercurvejudewanniski.pdf
- Added archive https://web.archive.org/web/20100108100055/http://www.hoover.org/publications/digest/30653464.html to http://www.hoover.org/publications/digest/30653464.html
- Added archive https://www.webcitation.org/5yWZxy6RC?url=http://www.nationalaffairs.com/doclib/20080528_197805001taxesrevenuesandthelaffercurvejudewanniski.pdf to http://www.nationalaffairs.com/doclib/20080528_197805001taxesrevenuesandthelaffercurvejudewanniski.pdf
When you have finished reviewing my changes, you may follow the instructions on the template below to fix any issues with the URLs.
This message was posted before February 2018. After February 2018, "External links modified" talk page sections are no longer generated or monitored by InternetArchiveBot. No special action is required regarding these talk page notices, other than regular verification using the archive tool instructions below. Editors have permission to delete these "External links modified" talk page sections if they want to de-clutter talk pages, but see the RfC before doing mass systematic removals. This message is updated dynamically through the template {{source check}} (last update: 18 January 2022).
- If you have discovered URLs which were erroneously considered dead by the bot, you can report them with this tool.
- If you found an error with any archives or the URLs themselves, you can fix them with this tool.
Cheers.—InternetArchiveBot (Report bug) 12:53, 15 December 2017 (UTC)
Debt relief Laffer curve
The Laffer curve idea was applied to debt relief by Krugman, and now there are a number of citations to this phrase. google search for that. The underlying idea is analogous to taxation. If a country's government is short of money and it is pressured to pay a giant debt, it can't and optimally for its own people pays nothing. If the debt is zero, it pays nothing. But if it is given some relief it pays something. So there's a Laffer curve. Possibly this is worth a paragraph. (Right?) I'll be back someday if nobody else puts it in. -- econterms (talk) 17:40, 26 December 2017 (UTC)
- I'm quite happy for this to be added to the article. Absolutelypuremilk (talk) 21:13, 26 December 2017 (UTC)
- The idea of of the figure of merit maximizing at some midpoint (and related "hump" curve) is applicable to zillions of things. But are they all Laffer curve? Or does Laffer mean this concept applied specifically to taxes and tax revenue? North8000 (talk) 21:50, 26 December 2017 (UTC)
- True, but I don't think there are very many concepts which refer to a "Laffer curve for x" - if there are then maybe we could say "The idea of the Laffer curve has been applied to other concepts, such as ...." Absolutelypuremilk (talk) 10:20, 27 December 2017 (UTC)
- I agree with all the above. Yes, North8000 there are zillions of cases of having a midpoint in the middle -- a hump curve. Not all belong here. In this case, (a) the analogy is quite close, since it involves the responses of the same kind to debt situations; (b) the term/analogy showed up in the literature decades ago and was used as a shorthand term of art since then. We wouldn't be synthesizing it here. I agree with Absolutelypuremilk's proposed phrasing; the new term should be stated as an analogy. And it should be brief, not too disproportionate to its use. But I think it's useful to discuss this, not just to state this new term but to make clear that the Laffer curve logic applies elsewhere. I'm still dawdling before taking the time to read the paper that launched this term. -- econterms (talk) 01:53, 28 December 2017 (UTC)
- Cool! North8000 (talk) 03:35, 28 December 2017 (UTC)
- I agree with all the above. Yes, North8000 there are zillions of cases of having a midpoint in the middle -- a hump curve. Not all belong here. In this case, (a) the analogy is quite close, since it involves the responses of the same kind to debt situations; (b) the term/analogy showed up in the literature decades ago and was used as a shorthand term of art since then. We wouldn't be synthesizing it here. I agree with Absolutelypuremilk's proposed phrasing; the new term should be stated as an analogy. And it should be brief, not too disproportionate to its use. But I think it's useful to discuss this, not just to state this new term but to make clear that the Laffer curve logic applies elsewhere. I'm still dawdling before taking the time to read the paper that launched this term. -- econterms (talk) 01:53, 28 December 2017 (UTC)
- True, but I don't think there are very many concepts which refer to a "Laffer curve for x" - if there are then maybe we could say "The idea of the Laffer curve has been applied to other concepts, such as ...." Absolutelypuremilk (talk) 10:20, 27 December 2017 (UTC)
- The idea of of the figure of merit maximizing at some midpoint (and related "hump" curve) is applicable to zillions of things. But are they all Laffer curve? Or does Laffer mean this concept applied specifically to taxes and tax revenue? North8000 (talk) 21:50, 26 December 2017 (UTC)
Lead: "Generally, empirical studies" show that we are on left side of Laffer curve
The lead currently states "Generally, empirical studies reject the claim that current tax rates are on the side of the Laffer curve where tax increases would reduce government revenue, or that tax cuts (from current rates) may increase tax revenues." However, it is supported by various primary sources, all but one of which are from the previous century, let alone this decade. The only one which is relatively recent is a primary source from 2011. To have such a strong statement in the lead, we would need several relatively recent secondary sources, not the current list of primary sources, many of which date from the early 1980s. Absolutelypuremilk (talk) 10:25, 21 August 2017 (UTC)
- Thanks for bringing this up. All the opposition I've seen in recent decades to the Laffer Curve and "tax cuts" has been on the following grounds:
- There has never been a time when tax rates were so high that a reduction in those rates resulted in higher tax revenue - let alone general prosperity; but,
- Even if #1 were true, it certainly isn't true now!
- A month or more ago, I began to add a few cases from the 20th century when the federal government initiate tax-rate cuts which did result in more gov't revenue or a general improvement in the economy. I'm not sure whether I finished tha project, or if the additions managed to stick.
- Interestingly, it has not only been Republicans who called for tax-rate cuts. I believe JFK was a Democrat. --Uncle Ed (talk) 10:48, 21 August 2017 (UTC)
Quoting Krugman on Laffer is ridiculous because, despite Krugman's Nobel, his political bias against Republicans is extremely well known.
- I object to the removal of well cited material with so little discussion. If you read through the empirical section, looking at the work of academic economists, and not political think tanks, it's clear that the evidence is strongly against the assertion that a tax cut in any OECD country today would result in tax revenue increases. No country has tax rates nearly high enough to be on the wrong side of the laffer curve. LK (talk) 11:31, 3 September 2017 (UTC)
I removed the sentence because while there are plenty of sources, they are all primary sources. As such, we should not be drawing conclusions from them, especially in the lead. Not to mention the fact that only one of them is actually from the current century! @Ed Poor: @Bonewah: what are your thoughts? Do you support removal of the content from the lead?Absolutelypuremilk (talk) 13:19, 4 September 2017 (UTC)
- I am an economist, I teach in a major university. Economists in general are very skeptical of any claims that lowering taxes can increase tax revenues. See for example, this survey of economists.[9] Posed with the statement: "A cut in federal income tax rates in the US right now would raise taxable income enough so that the annual total tax revenue would be higher within five years than without the tax cut." 0% agreed, 33% disagreed and 38% strongly disagreed. There is a general consensus among economists that tax cuts cannot increase revenues. LK (talk) 08:31, 5 September 2017 (UTC)
- Unfortunately Wikipedia is based on the available sources, not whether you are an economics professor or not. The sources that we have are primary sources and are already in the article (including the survey, which is in the "Problems" subsection, but is extremely specific - 1. Only applies to the USA 2. Only applies to 2012 3. Only applies to federal income taxes). The question is whether we should make a very strong statement: "Tax rates right now are generally on the left hand side of the Laffer curve" based on primary sources, which is a clear violation of WP:OR. That's not to mention the fact that you want this in the lead rather than in the main body. Absolutelypuremilk (talk) 11:46, 5 September 2017 (UTC)
- I'm not suggesting that you take my word for it. I'm telling you that the sources are there if we look for them. I'm suggesting that you follow policy and make an honest attempt to find out what the economics literature states before imposing your views on what should be in this article. The sentence in the lead reflects the sources in the article taken as a whole. Those sources can be added to as necessary, including the survey that I cited above, which shows strong consensus in the field about this issue. LK (talk) 02:48, 6 September 2017 (UTC)
I myself can't find any economics literature that say "Generally studies have found that tax rates right now are generally on the left hand side of the Laffer curve". If you can easily find them, I suggest that you add them to the article rather than telling me to look for them. Absolutelypuremilk (talk) 11:22, 6 September 2017 (UTC)
- We are supposed to summarize. Multiple studies from multiple countries find tax rates on the left of the max, as attested to in the sources. As far as I know, no serious academic study finds current tax rates on the right of the max. Feel free to rephrase to capture this. LK (talk) 12:54, 8 September 2017 (UTC)
- "Multiple studies from multiple countries find tax rates on the left of the max, as attested to in the sources." Really? That's way more than [10] says, which is just the *opinion* of a group of economists. If you think there is some relevant study that should be included, link it and lets discuss.
- "As far as I know, no serious academic study finds current tax rates on the right of the max" Current for who? And why is current even relevant? The laffer curve is a general concept, as such, it should apply just as well in the US today as it would in Rome in 33BCE, why should readers care about one country and one tax at one particular time? Again, Wikipedia is not just the US and not just today, we need to write it as such. Im not saying that there is no reason to include examples from today that might be relevant, but you need to make the case that the example to be included helps the user understand the general concept. Bonewah (talk) 15:36, 8 September 2017 (UTC)
- The claim is made, among a particular group of political partisans, that tax revenue today can be increased by lowering tax rates. As noted in the article body, empirical studies and economists in general reject this notion. As it forms a large part of the article itself, this observation should be included in the lead of the article. Feel free to reword if you think necessary, to accurately capture the spirit of what is stated in the article. LK (talk) 01:30, 10 September 2017 (UTC)
- Just to clarify to LK, when I said in my edit summary that I was removing the sentence because it violated WP:OR, this is because it drew conclusions from primary sources, contrary to WP:OR which says "This includes any analysis or synthesis of published material that serves to reach or imply a conclusion not stated by the sources." None of the primary sources says anything like "Generally tax rates are too high". Absolutelypuremilk (talk) 12:09, 10 September 2017 (UTC)
- "The claim is made, among a particular group of political partisans, that tax revenue today can be increased by lowering tax rates." Good for them, if you are looking to refute those partisans, this is not the place to do it. We are not here to Right Great Wrongs. Bonewah (talk) 15:49, 10 September 2017 (UTC)
- The claim is made, among a particular group of political partisans, that tax revenue today can be increased by lowering tax rates. As noted in the article body, empirical studies and economists in general reject this notion. As it forms a large part of the article itself, this observation should be included in the lead of the article. Feel free to reword if you think necessary, to accurately capture the spirit of what is stated in the article. LK (talk) 01:30, 10 September 2017 (UTC)
- "As far as I know, no serious academic study finds current tax rates on the right of the max" Current for who? And why is current even relevant? The laffer curve is a general concept, as such, it should apply just as well in the US today as it would in Rome in 33BCE, why should readers care about one country and one tax at one particular time? Again, Wikipedia is not just the US and not just today, we need to write it as such. Im not saying that there is no reason to include examples from today that might be relevant, but you need to make the case that the example to be included helps the user understand the general concept. Bonewah (talk) 15:36, 8 September 2017 (UTC)
Did the economist above mean "lowering taxes" or "lower tax rates"? There's a differences. Lowering the amount of taxes that a group pays should (I'm a math teacher) lower total tax revenue, so if that's what you mean then I agree! But lowering tax rates has resulted in increased tax revenue on at least two occasions that I remember: the JFK tax-rate cuts and the Reagan tax-rate cuts.
It works the same way as a big department store increasing profits by lowering prices enough that sales skyrocket: they sell more units at a lower margin, but the total profit can be higher. (If the economist above agrees, let's put this comparison into the article, okay?) --Uncle Ed (talk) 20:43, 4 January 2018 (UTC)
RfC: Empirical studies on question of whether tax cuts from current-day tax rates can increase tax revenues
- The following discussion is an archived record of a request for comment. Please do not modify it. No further edits should be made to this discussion. A summary of the conclusions reached follows.
Concerning this revert[11], should the lead contain the statement that empirical studies generally reject the the claim that that tax cuts from current-day tax rates would increase tax revenues? LK (talk) 01:36, 10 September 2017 (UTC)
- Include - amply sourced and represents the settled view of mainstream economists. SPECIFICO talk 01:44, 10 September 2017 (UTC)
- Include It's covered in the article and is a major issue. The purpose of the curve is to show that there is a tax rate that maximizes government revenue. TFD (talk) 02:04, 10 September 2017 (UTC)
- Remove - sourced from primary sources which are both old (only one from this century) and specific to particular places. Per WP:OR we should not draw conclusions from primary sources, and this should especially not be done in the lead. Absolutelypuremilk (talk) 09:36, 10 September 2017 (UTC)
- Remove Im not opposed to including this material per se, but i am opposed to including it in the lede as written. Perhaps this would be better off in the "empirical data" section. Bonewah (talk) 15:46, 10 September 2017 (UTC)
- Reword - summoned by bot. I'm not an economist but looked at the one source for the debated statement that I can read (Pecorino) and that seems to say the opposite of what the statement says. ...the growth-reducing effects of taxation are found to have a moderate, but significant effect in lowering the revenue-maximizing rate of taxation relative to a static model. I'm reading that to say higher taxes lower tax revenue. The statement is also a bit clunky. I'd change the statement to say Although the general conclusions are under debate, several empirical studies suggest that early 21st Century Western society tax rates are on the side of the Laffer curve where tax increases would increase government revenue, and that tax cuts (from current rates) would reduce tax revenues. TimTempleton (talk) (cont) 16:18, 13 September 2017 (UTC)
- FYI, I've not read the source your quote is from, but you're drawing the wrong conclusion from the quoted language. The quoted language is saying that dynamic modeling of taxes results in a lower estimate of the revenue maximizing tax rate than if you did static modeling (i.e., if you take into account how raising taxes affects behavior, you realize you can't raise tax as much before hitting the revenue maximizing rate as you would you have thought you could if you assumed raising taxes didn't affect behavior.). The quoted language doesn't say anything about whether anyone is currently above or below the revenue maximizing rate. Dbrote (talk) 16:00, 13 September 2017 (UTC)
- Ah-ha - I get it. Here's the abstract I quoted from, for full context.[[12]] Unfortunately I'm only able to read the abstract. So if we pull that last source out, the other sources seem to suggest consensus that taxes are generally too low, so we'd need a counter viewpoint source to justify my suggested compromise text saying there's disagreement. TimTempleton (talk) (cont) 22:19, 13 September 2017 (UTC)
- FYI, I've not read the source your quote is from, but you're drawing the wrong conclusion from the quoted language. The quoted language is saying that dynamic modeling of taxes results in a lower estimate of the revenue maximizing tax rate than if you did static modeling (i.e., if you take into account how raising taxes affects behavior, you realize you can't raise tax as much before hitting the revenue maximizing rate as you would you have thought you could if you assumed raising taxes didn't affect behavior.). The quoted language doesn't say anything about whether anyone is currently above or below the revenue maximizing rate. Dbrote (talk) 16:00, 13 September 2017 (UTC)
- Include, and expand into a corresponding section in the article (because it should be covered in more than just the lead, which is supposed to summarize the article.) Summarizing multiple sources is not WP:OR, and several of these papers themselves summarize the opinions of other papers (and therefore aren't even WP:PRIMARY in this context.) I would also suggest this source, which summarizes the curve's history, the pseudo-academic nature of the push behind it, and its consistent failure to to be borne out by empirical research. Here is another paper that touches on curve's history and reaches similar conclusions. --Aquillion (talk) 15:52, 21 September 2017 (UTC)
- There is already a section on this in the article: "Tax rate at which revenue is maximized". Thanks for posting these articles, would everyone be happy with "Several empirical studies suggest that early 21st Century Western society tax rates are on the side of the Laffer curve where tax increases would increase government revenue, and that tax cuts (from current rates) would reduce tax revenues." ? Absolutelypuremilk (talk) 20:03, 21 September 2017 (UTC)
- Remove - summoned by bot. The sentence is completely uninformative. Which tax rates is the sentence talking about? Labour taxes? Revenue taxes? Consumption (VAT) taxes? All taxes? In which country? In what period? The sentence is too general, and honestly too controversial and too prone to misunderstandings, to be included in the lede. See comments below for more information. Dryfee (talk) 17:10, 22 September 2017 (UTC)
- Also remove As noted by others brought in by the bot, the text in question is not informative, people reading it would be making assumptions about what the text is discussing and it seems unlikely that any extended text could repair the suggestion. Also there are equal number of research references and citations which refute the claim so it becomes a question of warring citations. Let's avoid that. Damotclese (talk) 15:54, 24 September 2017 (UTC)
- Leave out / remove Invited by the bot. First it is synthesis, basically a Wikipedia editor deriving that far reaching statement from selected sources. Second it's also a controversial statement on two levels...political, and because nobody really knows the answer. Next, what's in the lead should be a summary of what is covered in more depth in the article, and this isn't. Finally, it is not informative. North8000 (talk) 20:28, 26 September 2017 (UTC)
- Remove - Summoned by bot. Per WP:OR. And if consensus is to include, it should certainly be moved out of the lead and into the body of the article. Meatsgains (talk) 16:13, 9 October 2017 (UTC)
Comments
I do not see where the word "Generally" comes from - there are simply a list of primary sources which say that in these specific cases, the tax rate was less than the optimum. There is no indication that these sources reflect the majority of the studies on this topic. Furthermore, none of them look at countries outside Europe or the USA. Absolutelypuremilk (talk) 09:49, 10 September 2017 (UTC)
- An alternative would be to note that empirical studies from US, UK, and Europe have found this to be true. LK (talk) 15:25, 10 September 2017 (UTC)
- If its included somewhere besides the lede and is carefully worded, i would be in favor of that. Bonewah (talk) 15:50, 10 September 2017 (UTC)
- This belongs in the lede. It's the central fact about the subject. SPECIFICO talk 16:13, 10 September 2017 (UTC)
- @SPECIFICO I disagree. If you think that the Laffer curve is an actual theory on taxation then of course the optimal rate is central forthe subject. The fact however, is that the Laffer curve is not a theory on taxation but a simple argument that both 100% and 0% would yield zero revenue. Dryfee (talk) 17:19, 22 September 2017 (UTC)
- Can you explain that further? Bonewah (talk) 12:14, 11 September 2017 (UTC)
- This belongs in the lede. It's the central fact about the subject. SPECIFICO talk 16:13, 10 September 2017 (UTC)
- If its included somewhere besides the lede and is carefully worded, i would be in favor of that. Bonewah (talk) 15:50, 10 September 2017 (UTC)
Hello, I am not arguing for any of the following to be included I'm just going to mention a few things to keep in mind which are common knowledge among economists, just so that you don't waste too much time going through bits and pieces of citations that might very well be out of context.
- (1) The point where tax revenue is maximised, (assuming aggregate demand is a continuous function -which is already controversial) should be obvious to any economist: the answer is a specific tax rate for each and every product. This is because demand for each product has a different elasticity.
- (2) The solution to the optimal tax rate can be an interval, not a point or might not exist (think about a Cobb Douglass example).
- (3) There is a difference between maximum social benefit and maximum total tax revenue. Maximising tax revenue might not be desirable.
- (4) The Laffer curve is a static construct, whereas impacts on, say capital gains, are obviously dynamic.
As such, the Laffer curve is more of a pedagogical construct and not a theory on taxation or welfare. I hope this helps you focus on what is important about the subject and as such, on the focus of the article. Dryfee (talk) 17:13, 22 September 2017 (UTC)
RfC technical issues
I have asked for the RfC to be closed by a neutral party, but it seems LegoBot is prematurely closing the discussion. I reverted it but LegoBot just repeated the edit - I somehow don't think I can win an edit war against a bot! Ideas? Absolutelypuremilk (talk) 15:14, 10 October 2017 (UTC)
Explanation of recent removal from the lead
I recently removed this from the lead:
A 2007 study conducted by liberal economists Christina Romer and David Romer called The Macroeconomic Effects of Tax Changes: Estimates Based on a New Measure of Fiscal Shocks, estimates that a 1 percent rise in the tax rate decreases GDP by 2 % after a period of about 5 years.[1]
The Romer and Romer article cited is about the short run Keynesian effect of tax increases on GDP. i.e. it is estimating the Keynesian multiplier. The paper has nothing to do with the revenue maximizing tax rate. The article doesn't even contain the words "Laffer", "maximize" or "maximizing". Hence it's use in this article would quite clearly be synthesis. LK (talk) 02:20, 4 May 2018 (UTC)
I think that your removal was a good move, doubly so for something in the lead. North8000 (talk) 11:30, 4 May 2018 (UTC)
References
- ^ "The Macroeconomic Effects of Tax Changes: Estimates Based on a New Measure of Fiscal Shocks". p. 42.
Our baseline specification suggests that an exogenous tax increase of one percent of GDP lowers real GDP by roughly three percent. Our many robustness checks for the most part point to a slightly smaller decline, but one that is still well over two percent.
Laffer rate
Should we add a section on simple ways to calculate the Laffer (i.e. revenue-maximizing) rate using the elasticity of taxable income as a sufficient statistic? Other more complex methods might be excessive for Wikipedia but this model might provide a lot of intuition without much technical detail.Cloudspert (talk) 16:14, 31 May 2018 (UTC)
Romers' Laffer rate estimate of 33%
The last sentence in the second paragraph of the lead reads:
"However, a study done by Christina and David Romer, who are members of the Board of Economic Advisers for the Obama Administration, have suggested that the optimal revenue-maximizing tax rate would be at 33%."
I wanted to add a citation to this currently un-cited statement. I believe the study being referred to is this one published in the American Economic Journal (based on this working paper). However I cannot find any reference in either paper to a revenue-maximizing rate of 33%. The working paper mentions an upper bound of 73% on this rate, based on their findings, but no point estimate so far as I can see. The published article does not even say this. Can anyone find the source for this number? In the meantime I have added a 'citation needed' tag.
Also, assuming that I have identified the correct paper, I think the current text is misleading because it does not mention that the study uses data from the 1920s and 1930s, (thus the reader may assume that the result is more relevant / generalizable than it actually is). I think the sentence is especially misleading because of the reference to the Obama administration Board of Economic Advisers, which might lead a reader to conclude that the study is particularly relevant to recent years.
Lastly, I do not think it is appropriate to 'balance out' a review article (the previous sentence states that the mid-point of Laffer rate estimates is around 70%) with a claim from a single study (not a review) that exclusively used data from before WWII. I have no objections to including different Laffer rate findings, but this seems like a poor choice.
Therefore, I suggest the sentence is removed. A more appropriate point to include might be that the Laffer rate is thought to vary across time and space according to factors such as the strength of tax enforcement, the breadth of the tax base, 'tax morale', etc. and therefore that "the mid-point" of estimates might not be very informative in any specific context. References for this should be easily found. I am happy to make this change later if there are no objections. Cloudspert (talk) 15:00, 21 July 2018 (UTC)
graph removal
I have removed the following graph from the Congressional Budget Office analysis section.

The reason being is that the graph refers to the employment growth rate, which is not a subject directly covered by the Laffer curve. This graph might make more sense in the Supply side economics section, which posits that tax cuts spur growth, but the Laffer curve itself is agnostic as to the effect of tax cuts on job growth. Bonewah (talk) 13:35, 6 June 2019 (UTC)
Good source for the article
"What Is the Revenue-Maximizing Tax Rate?" Tax Notes, Vol. 134, No. 8, 2012 22 Feb 2012 Bruce Bartlett https://papers.ssrn.com/sol3/papers.cfm?abstract_id=2008750
Institute For Fiscal Studies: Mirrlees Review Chapter 2:Means-testing and Tax Rates on EarningsMike Brewer, Emmanuel Saez, and Andrew Shephard https://www.ifs.org.uk/uploads/mirrleesreview/dimensions/ch2.pdf — Preceding unsigned comment added by 175.45.38.98 (talk) 01:27, 6 November 2019 (UTC)