SIPRI Military Expenditure Database
edit
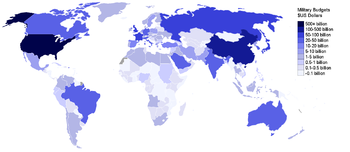
This list is based on the Stockholm International Peace Research Institute (SIPRI) Military Expenditure Database which calculates military expenditure data for 2009 (in constant 2008 US$). It also includes military expenditure data as a percentage of gross domestic product (GDP) in 2008.[1]
|
|
| The world's top 5 largest military budgets in 2009. Figures sourced from SIPRI.
|
 Military spending
 Military spending as percentage of GDP
| Rank |
|
Country |
Military expenditure, 2010[2] |
% of GDP, 2009
|
| 0 |
|
a |
0 |
0
|
| 1 |
 |
United States |
687,105,000,000 |
4.7%
|
| 2 |
 |
People's Republic of China |
114,300,000,000 |
2.2%
|
| 3 |
 |
France |
61,285,000,000 |
2.5%
|
| 4 |
 |
United Kingdom |
57,424,000,000 |
2.7%
|
| 5 |
 |
Russia |
52,586,000,000 |
4.3%
|
| 6 |
 |
Japan |
51,420,000,000 |
1.0%
|
| 7 |
 |
Germany |
46,848,000,000 |
1.4%
|
| 8 |
 |
Saudi Arabia |
42,917,000,000 |
11.2%
|
| 9 |
 |
Italy |
38,198,000,000 |
1.8%
|
| 10 |
 |
India |
34,816,000,000 |
2.8%
|
| 11 |
 |
Brazil |
28,096,000,000 |
1.6%
|
| 12 |
 |
South Korea |
24,270,000,000 |
2.9%
|
| 13 |
 |
Canada |
20,164,000,000 |
1.5%
|
| 14 |
 |
Australia |
19,799,000,000 |
1.9%
|
| 15 |
 |
Spain |
15,803,000,000 |
1.1%
|
| 16 |
 |
United Arab Emirates |
15,749,000,000 |
7.3%
|
| 17 |
 |
Turkey |
15,634,000,000 |
2.7%
|
| 18 |
 |
Israel |
13,001,000,000 |
6.3%
|
| 19 |
 |
Netherlands |
11,604,000,000 |
1.5%
|
| 20 |
 |
Greece |
9,369,000,000 |
3.2%
|
| 21 |
 |
Colombia |
9,191,000,000 |
3.7%
|
| 22 |
 |
Republic of China (Taiwan) |
8,535,000,000 |
2.4%
|
| 23 |
 |
Poland |
8,380,000,000 |
1.8%
|
| 24 |
 |
Singapore |
7,651,000,000 |
4.3%
|
| 25 |
 |
Iran |
7,044,000,000b |
1.8%b
|
| 26 |
 |
Norway |
6,322,000,000 |
1.6%
|
| 27 |
 |
Chile |
6,198,000,000 |
3.5%
|
| 28 |
 |
Indonesia |
6,009,000,000 |
0.9%
|
| 29 |
 |
Algeria |
5,586,000,000 |
3.8%
|
| 30 |
 |
Belgium |
5,382,000,000 |
1.2%
|
| 31 |
 |
Sweden |
5,248,000,000 |
1.2%
|
| 32 |
 |
Portugal |
5,213,000,000 |
2.1%
|
| 33 |
 |
Pakistan |
5,160,000,000 |
2.8%
|
| 34 |
 |
Mexico |
4,859,000,000 |
0.5%
|
| 35 |
 |
Iraq |
4,663,000,000 |
5.4%
|
| 36 |
 |
Denmark |
4,588,000,000 |
1.4%
|
| 37 |
 |
Kuwait |
4,411,000,000 |
4.4%
|
| 38 |
 |
Switzerland |
4,392,000,000 |
0.8%
|
| 39 |
 |
Thailand |
4,336,000,000 |
1.9%
|
| 40 |
 |
Oman |
4,047,000,000 |
9.7%
|
| 41 |
 |
Egypt |
3,914,000,000 |
2.1%
|
| 42 |
 |
Angola |
3,774,000,000 |
4.2%
|
| 43 |
 |
South Africa |
3,735,000,000 |
1.3%
|
| 44 |
 |
Finland |
3,718,000,000 |
1.5%
|
| 45 |
 |
Austria |
3,650,000,000 |
0.9%
|
| 46 |
 |
Ukraine |
3,442,000,000 |
2.9%
|
| 47 |
 |
Malaysia |
3,259,000,000 |
2.0%
|
| 48 |
 |
Morocco |
3,256,000,000 |
3.4%
|
| 49 |
 |
Argentina |
3,179,000,000 |
1.0%
|
| 50 |
 |
Venezuela |
3,106,000,000 |
1.3%
|
| 51 |
 |
Czech Republic |
2,529,000,000 |
1.4%
|
| 52 |
 |
Vietnam |
2,410,000,000 |
2.5%
|
| 53 |
 |
Syria |
2,236,000,000 |
4.0%
|
| 54 |
 |
Romania |
2,164,000,000 |
1.4%
|
| 55 |
 |
Peru |
1,992,000,000 |
1.4%
|
| 56 |
 |
Sudan |
1,991,000,000c |
3.4%c
|
| 57 |
 |
Nigeria |
1,724,000,000 |
0.9%
|
| 58 |
 |
Lebanon |
1,564,000,000 |
4.1%
|
| 59 |
 |
Philippines |
1,486,000,000 |
0.8%
|
| 60 |
 |
Azerbaijan |
1,421,000,000 |
3.4%
|
| 61 |
 |
Jordan |
1,363,000,000 |
6.1%
|
| 62 |
 |
New Zealand |
1,358,000,000 |
1.2%
|
| 63 |
 |
Ireland |
1,354,000,000 |
0.6%
|
| 64 |
 |
Hungary |
1,323,000,000 |
1.1%
|
| 65 |
 |
Sri Lanka |
1,280,000,000 |
3.5%
|
| 66 |
 |
Kazakhstan |
1,227,000,000 |
1.2%
|
| 67 |
 |
Yemen |
1,222,000,000b |
3.9%b
|
| 68 |
 |
Bangladesh |
1,137,000,000 |
1.0%
|
| 69 |
 |
Libya |
1,100,000,000b |
1.2%b
|
| 70 |
 |
Croatia |
1,060,000,000 |
1.8%
|
| 71 |
 |
Slovakia |
1,010,000,000 |
1.4%
|
| 72 |
 |
Serbia |
920,000,000 |
2.3%
|
| 73 |
 |
Slovenia |
788,000,000 |
1.6%
|
| 74 |
 |
Bahrain |
731,000,000 |
3.7%
|
| 75 |
 |
Belarus |
726,000,000 |
1.4%
|
| 76 |
 |
Bulgaria |
698,000,000 |
2.0%
|
| 77 |
 |
Kenya |
594,000,000 |
2.0%
|
| 78 |
 |
Cyprus |
550,000,000 |
1.8%
|
| 79 |
 |
Tunisia |
548,000,000 |
1.3%
|
| 80 |
 |
Uruguay |
491,000,000 |
1.6%
|
| 81 |
 |
Eritrea |
469,000,000d |
20.9%d
|
| 82 |
 |
Georgia |
452,000,000 |
5.6%
|
| 83 |
 |
Lithuania |
427,000,000 |
1.4%
|
| 84 |
 |
Ethiopia |
338,000,000 |
1.0%
|
| 85 |
 |
Estonia |
336,000,000 |
2.3%
|
| 86 |
 |
Armenia |
404,000,000 |
4.2%
|
| 87 |
 |
Cameroon |
368,000,000 |
1.6%
|
| 88 |
 |
Côte d'Ivoire |
353,000,000b |
1.5%
|
| 89 |
 |
Botswana |
352,000,000 |
3.0%
|
| 90 |
 |
Namibia |
329,000,000 |
3.7%
|
| 91 |
 |
Brunei |
327,000,000 |
3.1%
|
| 92 |
 |
Dominican Republic |
322,000,000 |
0.7%
|
| 93 |
 |
Bolivia |
314,000,000 |
2.0%
|
| 94 |
 |
Luxembourg |
301,000,000a |
0.6%
|
| 95 |
 |
Uganda |
276,000,000 |
1.8%
|
| 96 |
 |
Latvia |
268,000,000 |
1.4%
|
| 97 |
 |
Afghanistan |
250,000,000j |
1.8%
|
| 98 |
 |
Chad |
242,000,000 |
6.2%
|
| 99 |
 |
Bosnia and Herzegovina |
232,000,000 |
1.3%
|
| 100 |
 |
Albania |
201,000,000 |
2.1%
|
| 101 |
 |
Zambia |
251,000,000 |
2.0%
|
| 102 |
 |
Turkmenistan |
236,000,000e |
2.9%e
|
| 103 |
 |
Senegal |
217,000,000 |
1.6%
|
| 104 |
 |
Tanzania |
216,000,000 |
1.1%
|
| 105 |
 |
Republic of Macedonia |
204,000,000 |
1.8%
|
| 106 |
 |
Nepal |
194,000,000 |
2.0%
|
| 107 |
 |
Kyrgyzstan |
185,000,000 |
3.7%b
|
| 108 |
 |
Mali |
182,000,000 |
1.9%
|
| 109 |
 |
Guatemala |
175,000,000 |
0.4%
|
| 110 |
 |
Congo, Republic of the |
142,000,000a |
1.1%
|
| 111 |
 |
Paraguay |
140,000,000 |
0.8%
|
| 112 |
 |
Panama |
138,000,000e |
1.0%e
|
| 113 |
 |
El Salvador |
134,000,000 |
0.5%
|
| 114 |
 |
Congo, Democratic Republic of the |
127,000,000 |
1.4%
|
| 115 |
 |
Ghana |
127,000,000 |
0.7%
|
| 116 |
 |
Cambodia |
123,000,000b |
1.1%
|
| 117 |
 |
Mauritania |
122,000,000 |
3.7%
|
| 118 |
 |
Burkina Faso |
112,000,000 |
1.4%
|
| 119 |
 |
Honduras |
105,000,000 |
0.8%
|
| 120 |
 |
Madagascar |
103,000,000b |
1.1%
|
| 121 |
 |
Guinea |
99,800,000f |
2.2%f
|
| 122 |
 |
Mozambique |
92,500,000 |
0.8%
|
| 123 |
 |
Jamaica |
80,300,000 |
0.6%
|
| 124 |
 |
Rwanda |
72,700,000 |
1.5%
|
| 125 |
 |
Mongolia |
71,000,000a |
1.4%a
|
| 126 |
 |
Benin |
67,700,000b |
1.1%
|
| 127 |
 |
Tajikistan |
63,400,000f |
2.2%f
|
| 128 |
 |
Swaziland |
60,000,000a |
1.9%a
|
| 129 |
 |
Togo |
57,000,000 |
1.9%
|
| 130 |
 |
Uzbekistan |
52,000,000d |
1.9%d
|
| 131 |
 |
Malta |
51,600,000 |
0.7%
|
| 132 |
 |
Fiji |
48,400,000b |
1.3%
|
| 133 |
 |
Malawi |
45,100,000a |
1.5%a
|
| 134 |
 |
Sierra Leone |
44,600,000b |
2.4%
|
| 135 |
 |
Burundi |
43,900,000 |
4.0%
|
| 136 |
 |
Lesotho |
43,600,000 |
1.6%
|
| 137 |
 |
Niger |
43,000,000g |
0.5%g
|
| 138 |
 |
Nicaragua |
41,700,000 |
0.7%
|
| 139 |
 |
Papua New Guinea |
37,200,000 |
0.4%
|
| 140 |
 |
Central African Republic |
36,700,000 |
1.6%
|
| 141 |
 |
Djibouti |
36,300,000b |
3.7%
|
| 142 |
 |
Moldova |
27,500,000 |
0.6%
|
| 143 |
 |
Laos |
21,200,000g |
0.4%
|
| 144 |
 |
Guinea-Bissau |
16,800,000g |
3.8%g
|
| 145 |
 |
Belize |
15,600,000b |
1.1%
|
| 146 |
 |
Mauritius |
15,300,000b |
0.2%
|
| 147 |
 |
Iceland |
12,200,000 |
0.1%
|
| 148 |
 |
Cape Verde |
8,800,000 |
0.5%
|
| 149 |
 |
Guyana |
7,900,000h |
0.8%h
|
| 150 |
 |
Liberia |
7,100,000 |
0.6%
|
| 151 |
 |
Seychelles |
6,600,000 |
1.3%
|
| 152 |
 |
Gambia, The |
5,300,000a |
0.5%a
|
| 153 |
 |
North Korea |
Not reported |
na i
|
| 154 |
 |
Zimbabwe |
Not reported |
1.9%c
|
| 999 |
|
zz |
9e50 |
999
|
- ^ Not updated since 2007.
- ^ Not updated since 2008.
- ^ Not updated since 2006.
- ^ Not updated since 2003.
- ^ Not updated since 1999.
- ^ Not updated since 2004.
- ^ Not updated since 2005.
- ^ Not updated since 1996.
- ^ No data available from SIPRI. Estimates from other sources claim about 25% of GDP, aprox. $6 Billion.[3]
- ^ Not updated since 2009.


