User:DukeOfDelTaco/sandbox/Results of the 2004 United States presidential election
| This is not a Wikipedia article: This is a workpage, a collection of material and work in progress that may or may not be incorporated into an article. It should not necessarily be considered factual or authoritative. |
| |||||||||||||||||||||||||||||
538 members of the Electoral College 270 electoral votes needed to win | |||||||||||||||||||||||||||||
|---|---|---|---|---|---|---|---|---|---|---|---|---|---|---|---|---|---|---|---|---|---|---|---|---|---|---|---|---|---|
| |||||||||||||||||||||||||||||
| |||||||||||||||||||||||||||||


| Democratic Party | |
|---|---|
| Republican Party | |
| Minor parties | |
| Related races | |
| |
This workpage details the results of the 2004 United States presidential election, which was the 55th quadrennial presidential election held on November 2, 2004. Incumbent Republican president George W. Bush won re-election to a second term against Democratic nominee John Kerry, the junior Senator from Massachusetts.
Although Kerry managed to flip New Hampshire, Bush flipped two states that voted Democratic in 2000: Iowa and New Mexico. As of 2024, this was the last time that Colorado, Nevada, New Mexico, and Virginia voted for the Republican nominee.
Overview
edit-
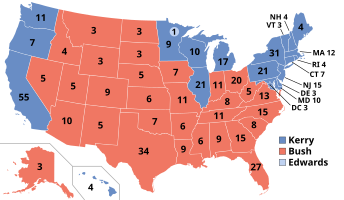
Presidential election results map. Red denotes states won by Bush/Cheney and blue denotes those won by Kerry/Edwards. Numbers indicate electoral votes cast by each state and the District of Columbia. -
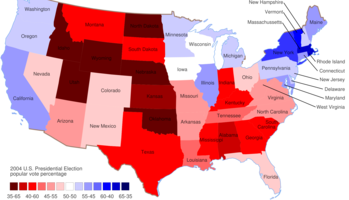 Results by state, shaded according to winning candidate's percentage of the vote.
 -
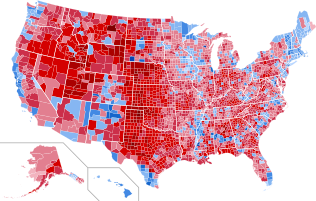 Results by county, shaded according to winning candidate's percentage of the vote.
 -
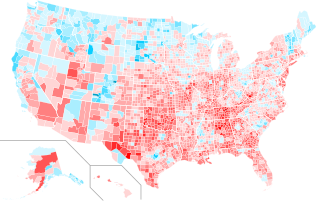 Change in vote margins at the county level from the 2000 election to the 2004 election. While Bush improved nationally overall, making his strongest gains in the South, he suffered a loss of support in parts of New England and the Western United States, which swung in Kerry's favor.


Results
edit| 252 | 286 |
| John Kerry | George W. Bush |
| Presidential candidate | Party | Home state | Popular vote | Electoral vote |
Running mate | |||
|---|---|---|---|---|---|---|---|---|
| Count | Percentage | Vice-presidential candidate | Home state | Electoral vote | ||||
| George W. Bush | Republican | Texas | 62,040,610 | 50.73% | 286 | Dick Cheney | Wyoming | 286 |
| John Kerry | Democratic | Massachusetts | 59,028,444 | 48.27% | 251 | John Edwards | North Carolina | 251 |
| Ralph Nader | Independent | Connecticut | 465,650 | 0.38% | 0 | Peter Camejo | California | 0 |
| Michael Badnarik | Libertarian | Texas | 397,265 | 0.32% | 0 | Richard Campagna | Iowa | 0 |
| Michael Peroutka | Constitution | Maryland | 143,630 | 0.12% | 0 | Chuck Baldwin | Florida | 0 |
| David Cobb | Green | Texas | 119,859 | 0.10% | 0 | Pat LaMarche | Maine | 0 |
| Leonard Peltier | Peace and Freedom | Pennsylvania | 27,607 | 0.02% | 0 | Janice Jordan | California | 0 |
| Walt Brown | Socialist | Oregon | 10,837 | 0.01% | 0 | Mary Alice Herbert | Vermont | 0 |
| James Harris | Socialist Workers | Ohio | 7,102 | 0.01% | 0 | Arrin Hawkins | Minnesota | 0 |
| Other | 99,887 | 0.08% | — | Other | — | |||
| Total | 122,295,345 | 100% | 538 | 538 | ||||
| Needed to win | 270 | 270 | ||||||
Summary table
editState or
district |
George W. Bush Republican |
John Kerry Democratic |
Ralph Nader Independent |
Michael Badnarik Libertarian |
Michael Peroutka Constitution |
David Cobb Green |
Others | Margin | Total votes | |||||||||||||||
|---|---|---|---|---|---|---|---|---|---|---|---|---|---|---|---|---|---|---|---|---|---|---|---|---|
| Votes | % | EV
|
Votes | % | EV
|
Votes | % | EV
|
Votes | % | EV
|
Votes | % | EV
|
Votes | % | EV
|
Votes | % | EV
|
Votes | % | ||
| Alabama | 1,176,394 | 62.46% | 9 | 693,933 | 36.84% | – | 6,701 | 0.36% | – | 3,529 | 0.19% | – | 1,994 | 0.11% | – | – | – | – | 898 | 0.05% | – | 482,461 | 25.62% | 1,883,449 |
| Alaska | 190,889 | 61.07% | 3 | 111,025 | 35.52% | – | 5,069 | 1.62% | – | 1,675 | 0.54% | – | 2,092 | 0.67% | – | 1,058 | 0.34% | – | 790 | 0.25% | – | 79,864 | 25.55% | 312,598 |
| Arizona | 1,104,294 | 54.77% | 10 | 893,524 | 44.32% | – | 2,773 | 0.14% | – | 11,856 | 0.59% | – | – | – | – | 138 | 0.01% | – | 3,517 | 0.17% | – | 210,770 | 10.45% | 2,016,102 |
| Arkansas | 572,898 | 54.31% | 6 | 469,953 | 44.55% | – | 6,171 | 0.58% | – | 2,352 | 0.22% | – | 2,083 | 0.20% | – | 1,488 | 0.14% | – | – | – | – | 102,945 | 9.76% | 1,054,945 |
| California | 5,509,826 | 44.36% | – | 6,745,485 | 54.30% | 55 | 21,213 | 0.17% | – | 50,165 | 0.40% | – | 26,645 | 0.21% | – | 40,771 | 0.33% | – | 27,754 | 0.22% | – | -1,235,659 | -9.95% | 12,421,859 |
| Colorado | 1,101,256 | 51.69% | 9 | 1,001,275 | 47.02% | – | 12,718 | 0.60% | – | 7,665 | 0.36% | – | 2,562 | 0.12% | – | 1,591 | 0.07% | – | 2,808 | 0.13% | – | 99,531 | 4.67% | 2,130,325 |
| Connecticut | 693,826 | 43.95% | – | 857,488 | 54.31% | 7 | 12,969 | 0.82% | – | 3,367 | 0.21% | – | 1,543 | 0.10% | – | 9,564 | 0.61% | – | 12 | 0.00% | – | -163,662 | -10.37% | 1,578,769 |
| Delaware | 171,660 | 45.74% | – | 200,152 | 53.34% | 3 | 2,153 | 0.57% | – | 586 | 0.16% | – | 289 | 0.08% | – | 250 | 0.07% | – | 180 | 0.05% | – | -28,492 | -7.59% | 375,270 |
| D.C. | 21,256 | 9.34% | – | 202,970 | 89.18% | 3 | 1,485 | 0.65% | – | 502 | 0.22% | – | – | – | – | 737 | 0.32% | – | 636 | 0.28% | – | -181,714 | -79.84% | 227,586 |
| Florida | 3,964,522 | 52.10% | 27 | 3,583,544 | 47.09% | – | 32,971 | 0.43% | – | 11,996 | 0.16% | – | 6,626 | 0.09% | – | 3,917 | 0.05% | – | 6,234 | 0.08% | – | 380,978 | 5.01% | 7,609,810 |
| Georgia | 1,914,254 | 57.93% | 15 | 1,366,149 | 41.34% | – | 2,231 | 0.07% | – | 18,387 | 0.56% | – | 580 | 0.02% | – | 228 | 0.01% | – | 2,652 | 0.08% | – | 548,105 | 16.59% | 3,304,481 |
| Hawaii | 194,191 | 45.26% | – | 231,708 | 54.01% | 4 | – | – | – | 1,377 | 0.32% | – | – | – | – | 1,737 | 0.40% | – | – | – | – | -37,517 | -8.74% | 429,013 |
| Idaho | 409,235 | 68.38% | 4 | 181,098 | 30.26% | – | 1,115 | 0.19% | – | 3,844 | 0.52% | – | 3,084 | 0.52% | – | 58 | 0.01% | – | 13 | 0.00% | – | 228,137 | 38.12% | 598,447 |
| Illinois | 2,345,946 | 44.48% | – | 2,891,550 | 54.82% | 21 | 3,571 | 0.07% | – | 32,442 | 0.62% | – | 440 | 0.01% | – | 241 | 0.00% | – | 132 | 0.00% | – | -545,604 | -10.34% | 5,274,322 |
| Indiana | 1,479,438 | 59.94% | 11 | 969,011 | 39.26% | – | 1,328 | 0.05% | – | 18,058 | 0.73% | – | – | – | – | 102 | 0.00% | – | 65 | 0.00% | – | 510,427 | 20.68% | 2,468,002 |
| Iowa | 751,957 | 49.90% | 7 | 741,898 | 49.23% | – | 5,973 | 0.40% | – | 2,992 | 0.20% | – | 1,304 | 0.09% | – | 1,141 | 0.08% | – | 1,643 | 0.11% | – | 10,059 | 0.67% | 1,506,908 |
| Kansas | 736,456 | 62.00% | 6 | 434,993 | 36.62% | – | 9,348 | 0.79% | – | 4,013 | 0.34% | – | 2,899 | 0.24% | – | 33 | 0.00% | – | 14 | 0.00% | – | 301,463 | 25.38% | 1,187,756 |
| Kentucky | 1,069,439 | 59.54% | 8 | 712,733 | 39.68% | – | 8,856 | 0.49% | – | 2,619 | 0.15% | – | 2,213 | 0.12% | – | – | – | – | 219 | 0.01% | – | 356,706 | 19.86% | 1,796,079 |
| Louisiana | 1,102,169 | 56.72% | 9 | 820,299 | 42.22% | – | 7,032 | 0.36% | – | 2,781 | 0.14% | – | 5,203 | 0.27% | – | 1,276 | 0.07% | – | 4,346 | 0.22% | – | 281,870 | 14.51% | 1,943,106 |
| Maine | 330,201 | 44.58% | – | 396,842 | 53.57% | 4 | 8,069 | 1.09% | – | 1,965 | 0.27% | – | 735 | 0.10% | – | 2,936 | 0.40% | – | 4 | 0.00% | – | -66,641 | -9.00% | 740,752 |
| Maryland | 1,024,703 | 42.93% | – | 1,334,493 | 55.91% | 10 | 11,854 | 0.50% | – | 6,094 | 0.26% | – | 3,421 | 0.14% | – | 3,632 | 0.15% | – | 2,481 | 0.10% | – | -309,790 | -12.98% | 2,386,678 |
| Massachusetts | 1,071,109 | 36.78% | – | 1,803,800 | 61.94% | 12 | 4,806 | 0.17% | – | 15,022 | 0.52% | – | – | – | – | 10,623 | 0.36% | – | 7,028 | 0.24% | – | -732,691 | -25.16% | 2,912,388 |
| Michigan | 2,313,746 | 47.81% | – | 2,479,183 | 51.23% | 17 | 24,035 | 0.50% | – | 10,552 | 0.22% | – | 4,980 | 0.10% | – | 5,325 | 0.11% | – | 1,431 | 0.03% | – | -165,437 | -3.42% | 4,839,252 |
| Minnesota | 1,346,695 | 47.61% | – | 1,445,014 | 51.09% | 9 | 18,683 | 0.66% | – | 4,639 | 0.16% | – | 3,074 | 0.11% | – | 4,408 | 0.16% | – | 5,874 | 0.21% | – | -98,319 | -3.48% | 2,828,387 |
| Mississippi | 684,981 | 59.44% | 6 | 458,094 | 39.75% | – | 3,177 | 0.28% | – | 1,793 | 0.16% | – | 1,759 | 0.15% | – | 1,073 | 0.09% | – | 1,488 | 0.13% | – | 226,887 | 19.69% | 1,152,365 |
| Missouri | 1,455,713 | 53.30% | 11 | 1,259,171 | 46.10% | – | 1,294 | 0.05% | – | 9,831 | 0.36% | – | 5,355 | 0.20% | – | – | – | – | – | – | – | 196,542 | 7.20% | 2,731,364 |
| Montana | 266,063 | 59.07% | 3 | 173,710 | 38.56% | – | 6,168 | 1.37% | – | 1,733 | 0.38% | – | 1,764 | 0.39% | – | 996 | 0.22% | – | 11 | 0.00% | – | 92,353 | 20.50% | 450,445 |
| Nebraska | 512,814 | 65.90% | 5 | 254,328 | 32.68% | – | 5,698 | 0.73% | – | 2,041 | 0.26% | – | 1,314 | 0.17% | – | 978 | 0.13% | – | 1,013 | 0.13% | – | 258,486 | 33.22% | 778,186 |
| Nevada | 418,690 | 50.47% | 5 | 397,190 | 47.88% | – | 4,838 | 0.58% | – | 3,176 | 0.38% | – | 1,152 | 0.14% | – | 853 | 0.10% | – | 3,688 | 0.44% | – | 21,500 | 2.59% | 829,587 |
| New Hampshire | 331,237 | 48.87% | – | 340,511 | 50.24% | 4 | 4,479 | 0.66% | – | 372 | 0.05% | – | 161 | 0.02% | – | – | – | – | 978 | 0.14% | – | -9,274 | -1.37% | 677,738 |
| New Jersey | 1,670,003 | 46.23% | – | 1,911,430 | 52.92% | 15 | 19,418 | 0.54% | – | 4,514 | 0.12% | – | 2,750 | 0.08% | – | 1,807 | 0.05% | – | 2,215 | 0.06% | – | -241,427 | -6.68% | 3,612,137 |
| New Mexico | 376,930 | 49.84% | 5 | 370,942 | 49.05% | – | 4,053 | 0.54% | – | 2,382 | 0.31% | – | 771 | 0.10% | – | 1,226 | 0.16% | – | – | – | – | 5,988 | 0.79% | 756,304 |
| New York | 2,962,567 | 40.08% | – | 4,314,280 | 58.36% | 31 | 99,873 | 1.35% | – | 11,607 | 0.16% | – | 363 | 0.00% | – | 138 | 0.00% | – | 3,126 | 0.04% | – | -1,351,713 | -18.29% | 7,391,954 |
| North Carolina | 1,961,166 | 56.02% | 15 | 1,525,849 | 43.58% | – | 1,805 | 0.05% | – | 11,731 | 0.34% | – | – | – | – | 108 | 0.00% | – | 348 | 0.01% | – | 435,317 | 12.43% | 3,501,007 |
| North Dakota | 196,651 | 62.86% | 3 | 111,052 | 35.50% | – | 3,756 | 1.20% | – | 851 | 0.27% | – | 514 | 0.16% | – | – | – | – | 9 | 0.00% | – | 85,599 | 27.36% | 312,833 |
| Ohio | 2,859,768 | 50.81% | 20 | 2,741,167 | 48.71% | – | – | – | – | 14,676 | 0.26% | – | 11,939 | 0.21% | – | 192 | 0.00% | – | 166 | 0.00% | – | 118,601 | 2.11% | 5,627,908 |
| Oklahoma | 959,792 | 65.57% | 7 | 503,966 | 34.43% | – | – | – | – | – | – | – | – | – | – | – | – | – | – | – | – | 455,826 | 31.14% | 1,463,758 |
| Oregon | 866,831 | 47.19% | – | 943,163 | 51.35% | 7 | – | – | – | 7,260 | 0.40% | – | 5,257 | 0.29% | – | 5,315 | 0.29% | – | 8,956 | 0.49% | – | -76,332 | -4.16% | 1,836,782 |
| Pennsylvania | 2,793,847 | 48.42% | – | 2,938,095 | 50.92% | 21 | 2,656 | 0.05% | – | 21,185 | 0.37% | – | 6,318 | 0.11% | – | 6,319 | 0.11% | – | 1,170 | 0.02% | – | -144,248 | -2.50% | 5,769,590 |
| Rhode Island | 169,046 | 38.67% | – | 259,760 | 59.42% | – | 4,651 | 1.06% | – | 907 | 0.21% | – | 339 | 0.08% | – | 1,333 | 0.30% | – | 1,098 | 0.25% | – | -90,714 | -20.75% | 437,134 |
| South Carolina | 937,974 | 57.98% | 8 | 661,699 | 40.90% | – | 5,520 | 0.34% | – | 3,608 | 0.22% | – | 5,317 | 0.33% | – | 1,488 | 0.09% | – | 2,124 | 0.13% | – | 276,275 | 17.08% | 1,617,730 |
| South Dakota | 232,584 | 59.91% | 3 | 149,244 | 38.44% | – | 4,320 | 1.11% | – | 964 | 0.25% | – | 1,103 | 0.28% | – | – | – | – | – | – | – | 83,340 | 21.47% | 388,215 |
| Tennessee | 1,383,336 | 56.81% | 11 | 1,035,160 | 42.51% | – | 8,984 | 0.37% | – | 4,865 | 0.20% | – | 2,565 | 0.11% | – | 33 | 0.00% | – | 6 | 0.00% | – | 348,176 | 14.30% | 2,434,949 |
| Texas | 4,526,917 | 61.09% | 34 | 2,832,704 | 38.22% | – | 9,159 | 0.12% | – | 38,787 | 0.52% | – | 1,636 | 0.02% | – | 1,014 | 0.01% | – | 548 | 0.01% | – | 1,694,213 | 22.86% | 7,410,765 |
| Utah | 663,742 | 71.54% | 5 | 241,199 | 26.00% | – | 11,305 | 1.22% | – | 3,375 | 0.36% | – | 6,841 | 0.74% | – | – | – | – | 1,382 | 0.15% | – | 422,543 | 45.54% | 927,844 |
| Vermont | 121,180 | 38.80% | – | 184,067 | 58.94% | 3 | 4,494 | 1.44% | – | 1,102 | 0.35% | – | – | – | – | – | – | – | 1,466 | 0.47% | – | -62,887 | -20.14% | 312,309 |
| Virginia | 1,716,959 | 53.68% | 13 | 1,454,742 | 45.48% | – | 2,393 | 0.07% | – | 11,032 | 0.34% | – | 10,161 | 0.32% | – | 104 | 0.00% | – | 2,976 | 0.09% | – | 262,217 | 8.20% | 3,198,367 |
| Washington | 1,304,894 | 45.60% | – | 1,510,201 | 52.77% | 11 | 23,283 | 0.81% | – | 11,955 | 0.42% | – | 3,922 | 0.14% | – | 2,974 | 0.10% | – | 4,484 | 0.16% | – | -205,307 | -7.17% | 2,861,713 |
| West Virginia | 423,778 | 56.06% | 5 | 326,541 | 43.20% | – | 4,063 | 0.54% | – | 1,405 | 0.19% | – | 82 | 0.01% | – | 5 | 0.00% | – | 13 | 0.00% | – | 97,237 | 12.86% | 755,887 |
| Wisconsin | 1,478,120 | 49.32% | – | 1,489,504 | 49.70% | 10 | 16,390 | 0.55% | – | 6,464 | 0.22% | – | 869 | 0.03% | – | 2,661 | 0.09% | – | 2,999 | 0.10% | – | -11,384 | -0.38% | 2,997,007 |
| Wyoming | 167,629 | 68.86% | 3 | 70,776 | 29.07% | – | 2,741 | 1.13% | – | 1,171 | 0.48% | – | 631 | 0.26% | – | – | – | – | 480 | 0.20% | – | 96,853 | 39.79% | 243,428 |
| Total | 62,040,610 | 50.73% | 286 | 59,028,444 | 48.27% | 251 | 465,650 | 0.38% | – | 397,265 | 0.32% | – | 143,630 | 0.12% | – | 119,859 | 0.10% | – | 145,433 | 0.12% | – | 3,012,166 | 2.46% | 122,295,345 |
| George W. Bush Republican |
John Kerry Democratic |
Ralph Nader Independent |
Michael Badnarik Libertarian |
Michael Peroutka Constitution |
David Cobb Green |
Others | Margin | Total votes | ||||||||||||||||
Close states
editStates where the margin of victory was under 1% (22 electoral votes):
- Wisconsin, 0.38% (11,384 votes)
- Iowa, 0.67% (10,059 votes)
- New Mexico, 0.79% (5,988 votes)
States where the margin of victory was under 5% (93 electoral votes):
- New Hampshire, 1.37% (9,274 votes)
- Ohio, 2.11% (118,601 votes)
- Pennsylvania, 2.50% (144,248 votes)
- Nevada, 2.59% (21,500 votes)
- Michigan, 3.42% (165,437 votes)
- Minnesota, 3.48% (98,319 votes)
- Oregon, 4.16% (76,332 votes)
- Colorado, 4.67% (99,523 votes)
States where the margin of victory was under 10% (149 electoral votes):
- Florida, 5.01% (380,978 votes)
- New Jersey, 6.68% (241,427 votes)
- Washington, 7.18% (205,307 votes)
- Missouri, 7.20% (196,542 votes)
- Delaware, 7.59% (28,492 votes)
- Virginia, 8.20% (262,217 votes)
- Hawaii, 8.74% (37,517 votes)
- Maine, 9.00% (66,641 votes)
- Arkansas, 9.76% (102,945 votes)
- California, 9.95% (1,235,659 votes)
Results by state
editAlabama
edit
- Bush: 50–60% 60–70% 70–80% 80–90%
- Kerry: 40–50% 50–60% 60–70% 70–80% 80–90%
| Party | Candidate | Votes | % | ±% | |
|---|---|---|---|---|---|
| Republican | George W. Bush (incumbent) | 1,176,394 | 62.46% | ||
| Democratic | John Kerry | 693,933 | 36.84% | ||
| Independent | Ralph Nader | 6,701 | 0.36% | ||
| Independent | Michael Badnarik | 3,529 | 0.19% | ||
| Independent | Michael Peroutka | 1,994 | 0.11% | ||
| Write-in | 898 | 0.05% | |||
| Margin of victory | 482,461 | 25.62% | |||
| Total votes | 1,883,449 | 100.00% | |||
| Republican win | |||||
Alaska
edit
- Bush: 40–50% 50–60% 60–70% 70–80%
- Kerry: 40–50% 50–60%
| Party | Candidate | Votes | % | ±% | |
|---|---|---|---|---|---|
| Republican | George W. Bush (incumbent) | 190,889 | 61.07% | ||
| Democratic | John Kerry | 111,025 | 35.52% | ||
| Populist | Ralph Nader | 5,069 | 1.62% | ||
| Independence | Michael Peroutka | 2,092 | 0.67% | ||
| Libertarian | Michael Badnarik | 1,675 | 0.54% | ||
| Green | David Cobb | 1,058 | 0.34% | ||
| Write-in | 790 | 0.25% | |||
| Margin of victory | 79,864 | 25.55% | |||
| Total votes | 312,598 | 100.00% | |||
| Republican win | |||||
Arizona
edit
- Bush: 50–60% 60–70%
- Kerry: 50–60% 60–70%
| Party | Candidate | Votes | % | ±% | |
|---|---|---|---|---|---|
| Republican | George W. Bush (incumbent) | 1,104,294 | 54.87% | ||
| Democratic | John Kerry | 893,524 | 44.40% | ||
| Libertarian | Michael Badnarik | 11,856 | 0.59% | ||
| Write-in | 2,911 | 0.14% | |||
| Margin of victory | 210,770 | 10.47% | |||
| Total votes | 2,012,585 | 100.00% | |||
| Republican win | |||||
Arkansas
edit
- Bush: 40–50% 50–60% 60–70%
- Kerry: 50–60% 60–70%
| Party | Candidate | Votes | % | ±% | |
|---|---|---|---|---|---|
| Republican | George W. Bush (incumbent) | 572,898 | 54.31% | ||
| Democratic | John Kerry | 469,953 | 44.55% | ||
| Populist | Ralph Nader | 6,171 | 0.58% | ||
| Libertarian | Michael Badnarik | 2,352 | 0.22% | ||
| Constitution | Michael Peroutka | 2,083 | 0.20% | ||
| Green | David Cobb | 1,488 | 0.14% | ||
| Margin of victory | 102,945 | 9.76% | |||
| Total votes | 1,054,945 | 100.00% | |||
| Republican win | |||||
California
edit
- Kerry: 40–50% 50–60% 60–70% 70–80% 80–90%
- Bush: 50–60% 60–70% 70–80%
| Party | Candidate | Votes | % | ±% | |
|---|---|---|---|---|---|
| Democratic | John Kerry | 6,745,485 | 54.30% | ||
| Republican | George W. Bush (incumbent) | 5,509,826 | 44.36% | ||
| Libertarian | Michael Badnarik | 50,165 | 0.40% | ||
| Green | David Cobb | 40,771 | 0.33% | ||
| Peace and Freedom | Leonard Peltier | 27,607 | 0.22% | N/A | |
| American Independent | Michael Peroutka | 26,645 | 0.21% | ||
| Write-in | 21,353 | 0.17% | |||
| Margin of victory | 1,235,659 | 9.95% | |||
| Total votes | 12,421,852 | 100.00% | |||
| Democratic win | |||||
Colorado
edit
- Bush: 40–50% 50–60% 60–70% 70–80% 80–90%
- Kerry: 40–50% 50–60% 60–70% 70–80%
| Party | Candidate | Votes | % | ±% | |
|---|---|---|---|---|---|
| Republican | George W. Bush (incumbent) | 1,101,255 | 51.69% | ||
| Democratic | John Kerry | 1,001,732 | 47.02% | ||
| Reform | Ralph Nader | 12,718 | 0.60% | ||
| Libertarian | Michael Badnarik | 7,664 | 0.36% | ||
| American Constitution | Michael Peroutka | 2,562 | 0.12% | ||
| Green | David Cobb | 1,591 | 0.07% | ||
| Independent | Stanford Andress | 804 | 0.04% | N/A | |
| Concerns of People | Gene Amondson | 378 | 0.02% | N/A | |
| Socialist Equality | Bill Van Auken | 329 | 0.02% | N/A | |
| Socialist Workers | James Harris | 241 | 0.01% | ||
| Socialist | Walt Brown | 216 | 0.01% | ||
| Prohibition | Earl Dodge | 140 | 0.01% | ||
| Write-in | 700 | 0.03% | |||
| Margin of victory | 99,523 | 4.67% | |||
| Total votes | 2,130,330 | 100.00% | |||
| Republican win | |||||
Connecticut
edit
- Kerry: 50–60%
- Bush: 50–60%
- Republican: Litchfield
| Party | Candidate | Votes | % | ±% | |
|---|---|---|---|---|---|
| Democratic | John Kerry | 857,488 | 54.31% | ||
| Republican | George W. Bush (incumbent) | 693,826 | 43.95% | ||
| Politicos Son Corruptos | Ralph Nader | 12,969 | 0.82% | ||
| Green | David Cobb | 9,564 | 0.61% | ||
| Libertarian | Michael Badnarik | 3,367 | 0.21% | ||
| Concerned Citizens | Michael Peroutka | 1,543 | 0.10% | ||
| Write-in | 12 | 0.00% | |||
| Margin of victory | 163,662 | 10.37% | |||
| Total votes | 1,578,769 | 100.00% | |||
| Democratic win | |||||
Delaware
edit
- Kerry: 60–70%
- Bush: 50–60% 60–70%
| Party | Candidate | Votes | % | ±% | |
|---|---|---|---|---|---|
| Democratic | John Kerry | 200,152 | 53.35% | ||
| Republican | George W. Bush (incumbent) | 171,660 | 45.75% | ||
| Independent Party | Ralph Nader | 2,153 | 0.57% | ||
| Libertarian | Michael Badnarik | 586 | 0.16% | ||
| Constitution | Michael Peroutka | 289 | 0.08% | ||
| Green | David Cobb | 250 | 0.07% | ||
| Natural Law | Walt Brown | 100 | 0.03% | ||
| Margin of victory | 28,492 | 7.59% | |||
| Total votes | 375,190 | 100.00% | |||
| Democratic win | |||||