Home
Random
Nearby
Log in
Settings
Donate
About Wikipedia
Disclaimers
Search
Template
:
EP election results graph (percentage)
Template
Talk
Language
Watch
Edit
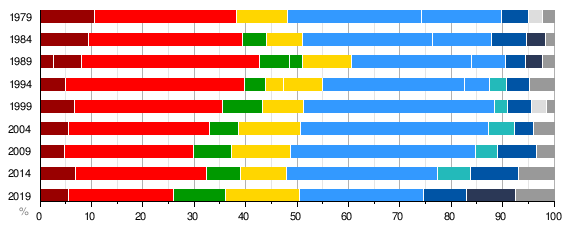
The composition of the European Parliament with regard to percentage share of deputies for each political group, 1979 to 2019. Left to right:
[1]
Left-wing
Social democrats
Greens and regionalists
Liberals and centrists
Christian democrats and conservatives
Eurosceptics
Eurosceptic conservatives
Right-wing nationalists
Heterogeneous
Non-Inscrits
See also
edit
Template:EP election results graph (MEPs)
^
"European Parliament composition"
.