This is a demography of the population of Azerbaijan including population density, ethnicity, education level, health of the populace, economic status, religious affiliations and other aspects of the population.
| Demographics of Azerbaijan | |
|---|---|
 Population pyramid of Azerbaijan in 2020 | |
| Population | 10,353,296 (2022 est.) |
| Growth rate | 0.67% (2022 est.) |
| Birth rate | 13.59 births/1,000 population (2022 est.) |
| Death rate | 6.92 deaths/1,000 population (2022 est.) |
| Life expectancy | 74.15 years |
| • male | 71.08 years |
| • female | 77.41 years (2022 est.) |
| Fertility rate | 1.86 children born/woman (2022 est.) |
| Infant mortality rate | 23.51 deaths/1,000 live births |
| Net migration rate | 0 migrant(s)/1,000 population (2022 est.) |
| Age structure | |
| 0–14 years | 22.84% |
| 65 and over | 7.29% |
| Sex ratio | |
| Total | 0.98 male(s)/female (2022 est.) |
| At birth | 1.06 male(s)/female |
| Under 15 | 1.11 male(s)/female |
| 65 and over | 0.49 male(s)/female |
| Nationality | |
| Nationality | Azerbaijani |
| Major ethnic | Azerbaijani (91.6%) |
| Minor ethnic | Lezgin (2%) |
| Language | |
| Official | Azeri (92.5%) |
Total population edit
- 10,412,651 people

| Year | Pop. | ±% |
|---|---|---|
| 1897 | 1,806,700 | — |
| 1908 | 2,014,300 | +11.5% |
| 1917 | 2,353,700 | +16.8% |
| 1926 | 2,313,600 | −1.7% |
| 1939 | 3,205,200 | +38.5% |
| 1959 | 3,697,700 | +15.4% |
| 1970 | 5,117,100 | +38.4% |
| 1979 | 6,028,300 | +17.8% |
| 1989 | 7,021,200 | +16.5% |
| 1999 | 7,953,400 | +13.3% |
| 2009 | 8,922,000 | +12.2% |
| 2019 | 9,981,457[2] | +11.9% |
| 2023 | 10,135,373[3] | +1.5% |
| Source:[1] | ||
- Graphs are unavailable due to technical issues. There is more info on Phabricator and on MediaWiki.org.
Graphs are unavailable due to technical issues. There is more info on Phabricator and on MediaWiki.org. |
Graphs are unavailable due to technical issues. There is more info on Phabricator and on MediaWiki.org. |
| Year | 1897 | 1908 | 1917 | 1920 | 1923 | 1930 | 1940 | 1941 | 1942 | 1943 | 1944 | 1945 | 1946 | 1947 | 1948 | 1949 | 1950 | 1960 | 1970 | 1980 | 1990 | 2000 | 2009 | 2010 | 2016 | 2019 | |
|---|---|---|---|---|---|---|---|---|---|---|---|---|---|---|---|---|---|---|---|---|---|---|---|---|---|---|---|
| City | 305.1 | - | 560.2 | 405.8 | 486.0 | 750.9 | 1212.0 | 1239.8 | 1195.5 | 1138.1 | 1105.8 | 1118.5 | 1159.9 | 1163.1 | 1110.1 | 1149.1 | 1252.3 | 1835.2 | 2564.6 | 3247.5 | 3847.3 | 4116.4 | 4818.7 | - | |||
| Rural | 1501.6 | - | 1793.5 | 1546.4 | 1377.0 | 1818.6 | 2062.0 | 2092.0 | 1961.6 | 1780.0 | 1670.9 | 1587.1 | 1574.6 | 1577.4 | 1589.2 | 1583.5 | 1606.6 | 1980.5 | 2552.5 | 2866.8 | 3284.6 | 3916.4 | 4078.6 | - | |||
| Total | 1806.7 | 2014.3 | 2353.7 | 1952.2 | 1863.0 | 2569.5 | 3274.0 | 3331.8 | 3157.1 | 2918.1 | 2776.7 | 2705.6 | 2734.5 | 2740.5 | 2699.3 | 2732.6 | 2858.9 | 3815.7 | 5117.1 | 6114.3 | 7131.9 | 8032.8 | 8896.9 | 9000.0[4] | 9747.0[5] | 9981.4[6] |
In thousands[7]
Notes about table
- To see the effect of periodical events on the population period until 1950 is not given in decades.
- 9,047,000[8] (2010)
Vital statistics edit
| Average population | Live births | Deaths | Natural change | Crude birth rate (per 1000) | Crude death rate (per 1000) | Natural change (per 1000) | Total Fertility Rate | |
|---|---|---|---|---|---|---|---|---|
| 1935 | 2,933,800 | 65,245 | 32,134 | 33,111 | 22.0 | 10.8 | 11.2 | |
| 1936 | 3,004,300 | 75,761 | 34,966 | 40,795 | 24.9 | 11.5 | 13.4 | |
| 1937 | 3,082,600 | 110,341 | 40,787 | 69,554 | 35.3 | 13.1 | 22.2 | |
| 1938 | 3,167,400 | 99,729 | 40,937 | 58,792 | 31.3 | 12.8 | 18.5 | |
| 1939 | 3,205,200 | 101,529 | 39,828 | 61,701 | 31.4 | 12.3 | 19.1 | |
| 1940 | 3,274,000 | 96,981 | 48,568 | 48,413 | 29.4 | 14.7 | 14.7 | |
| 1941 | 3,331,800 | 75,735 | 41,144 | 34,591 | 23.3 | 12.7 | 10.6 | |
| 1942 | 3,157,100 | 53,410 | 52,993 | 417 | 17.6 | 17.4 | 0.2 | |
| 1943 | 2,918,100 | 28,958 | 43,510 | -14,552 | 10.2 | 15.3 | -5.1 | |
| 1944 | 2,776,700 | 33,564 | 40,671 | -7,107 | 12.2 | 14.8 | -2.6 | |
| 1945 | 2,705,600 | 39,818 | 39,027 | 791 | 14.6 | 14.3 | 0.3 | |
| 1946 | 2,737,500 | 62,727 | 23,233 | 39,494 | 22.9 | 8.5 | 14.4 | |
| 1947 | 2,719,900 | 80,046 | 23,509 | 56,537 | 29.4 | 8.6 | 20.8 | |
| 1948 | 2,716,000 | 78,324 | 26,632 | 51,692 | 28.8 | 9.8 | 19.0 | |
| 1949 | 2,795,800 | 83,760 | 29,102 | 54,658 | 30.0 | 10.4 | 19.6 | |
| 1950 | 2,896,200 | 90,280 | 27,746 | 62,534 | 31.2 | 9.6 | 21.6 | |
| 1951 | 2,995,000 | 100,979 | 27,331 | 73,648 | 33.7 | 9.1 | 24.6 | |
| 1952 | 3,102,900 | 106,687 | 30,244 | 76,443 | 34.4 | 9.7 | 24.6 | |
| 1953 | 3,170,600 | 101,378 | 29,707 | 71,671 | 32.0 | 9.4 | 22.6 | |
| 1954 | 3,234,600 | 117,428 | 28,855 | 88,573 | 36.3 | 8.9 | 27.4 | |
| 1955 | 3,326,000 | 125,599 | 25,074 | 100,525 | 37.8 | 7.5 | 30.2 | |
| 1956 | 3,429,600 | 134,594 | 23,931 | 110,663 | 39.2 | 7.0 | 32.3 | |
| 1957 | 3,539,700 | 139,529 | 25,667 | 113,862 | 39.4 | 7.3 | 32.2 | |
| 1958 | 3,644,000 | 147,534 | 27,119 | 120,415 | 40.5 | 7.4 | 33.0 | |
| 1959 | 3,754,300 | 155,872 | 26,086 | 129,786 | 41.5 | 6.9 | 34.6 | |
| 1960 | 3,894,500 | 165,849 | 25,918 | 139,931 | 42.6 | 6.7 | 35.9 | |
| 1961 | 4,045,800 | 170,504 | 27,295 | 143,209 | 42.1 | 6.7 | 35.4 | 5.2 |
| 1962 | 4,168,200 | 168,341 | 30,901 | 137,440 | 40.4 | 7.4 | 33.0 | 5.2 |
| 1963 | 4,293,600 | 175,033 | 30,230 | 144,803 | 40.8 | 7.0 | 33.7 | 5.4 |
| 1964 | 4,439,300 | 176,546 | 31,841 | 144,705 | 39.8 | 7.2 | 32.6 | 5.5 |
| 1965 | 4,574,700 | 167,429 | 29,095 | 138,334 | 36.6 | 6.4 | 30.2 | 5.5 |
| 1966 | 4,708,200 | 166,545 | 31,657 | 134,888 | 35.4 | 6.7 | 28.6 | 5.3 |
| 1967 | 4,832,000 | 157,270 | 32,338 | 124,932 | 32.5 | 6.7 | 25.9 | 5.1 |
| 1968 | 4,948,500 | 158,962 | 32,950 | 126,012 | 32.1 | 6.7 | 25.5 | 5.0 |
| 1969 | 5,061,100 | 148,078 | 35,428 | 112,650 | 29.3 | 7.0 | 22.3 | 4.8 |
| 1970 | 5,169,900 | 150,976 | 34,506 | 116,470 | 29.2 | 6.7 | 22.5 | 4.7 |
| 1971 | 5,283,000 | 146,261 | 34,236 | 112,025 | 27.7 | 6.5 | 21.2 | 4.6 |
| 1972 | 5,391,500 | 137,752 | 35,658 | 102,094 | 25.6 | 6.6 | 18.9 | 4.1 |
| 1973 | 5,493,900 | 138,569 | 34,770 | 103,799 | 25.2 | 6.3 | 18.9 | 4.1 |
| 1974 | 5,594,100 | 139,084 | 36,082 | 103,002 | 24.9 | 6.5 | 18.4 | 4.0 |
| 1975 | 5,689,100 | 141,857 | 39,291 | 102,566 | 24.9 | 6.9 | 18.0 | 3.7 |
| 1976 | 5,781,000 | 147,199 | 38,029 | 109,170 | 25.5 | 6.6 | 18.9 | 3.9 |
| 1977 | 5,876,200 | 146,822 | 39,035 | 107,787 | 25.0 | 6.6 | 18.3 | 3.8 |
| 1978 | 5,974,200 | 148,812 | 39,936 | 108,876 | 24.9 | 6.7 | 18.2 | 3.6 |
| 1979 | 6,069,300 | 153,080 | 43,022 | 110,058 | 25.2 | 7.1 | 18.1 | 3.5 |
| 1980 | 6,160,500 | 154,974 | 43,064 | 111,910 | 25.2 | 7.0 | 18.2 | 3.3 |
| 1981 | 6,257,800 | 164,577 | 42,898 | 121,679 | 26.3 | 6.9 | 19.4 | 3.2 |
| 1982 | 6,357,600 | 160,425 | 42,376 | 118,049 | 25.2 | 6.7 | 18.6 | 3.1 |
| 1983 | 6,459,800 | 168,644 | 42,944 | 125,700 | 26.1 | 6.6 | 19.5 | 3.0 |
| 1984 | 6,567,900 | 174,437 | 44,845 | 129,592 | 26.6 | 6.8 | 19.7 | 3.0 |
| 1985 | 6,670,200 | 177,657 | 45,179 | 132,478 | 26.6 | 6.8 | 19.9 | 2.9 |
| 1986 | 6,770,300 | 186,609 | 45,344 | 141,265 | 27.6 | 6.7 | 20.9 | 2.9 |
| 1987 | 6,875,400 | 184,585 | 45,744 | 138,841 | 26.8 | 6.7 | 20.2 | 2.9 |
| 1988 | 6,972,900 | 184,350 | 47,485 | 136,865 | 26.4 | 6.8 | 19.6 | 2.8 |
| 1989 | 7,074,800 | 181,631 | 44,016 | 137,615 | 25.7 | 6.2 | 19.5 | 2.8 |
| 1990 | 7,175,200 | 182,989 | 42,819 | 140,170 | 25.5 | 6.0 | 19.5 | 2.77 |
| 1991 | 7,271,300 | 190,353 | 44,659 | 145,694 | 26.2 | 6.1 | 20.0 | 2.9 |
| 1992 | 7,382,100 | 181,361 | 51,258 | 130,103 | 24.6 | 6.9 | 17.6 | 2.7 |
| 1993 | 7,494,800 | 174,618 | 52,809 | 121,809 | 23.3 | 7.0 | 16.3 | 2.7 |
| 1994 | 7,596,600 | 159,761 | 54,921 | 104,840 | 21.0 | 7.2 | 13.8 | 2.5 |
| 1995 | 7,684,900 | 143,315 | 50,828 | 92,487 | 18.6 | 6.6 | 12.0 | 2.193 |
| 1996 | 7,763,000 | 129,247 | 48,242 | 81,005 | 16.6 | 6.2 | 10.4 | 1.977 |
| 1997 | 7,838,300 | 132,052 | 46,962 | 85,090 | 16.8 | 6.0 | 10.9 | 2.019 |
| 1998 | 7,912,000 | 123,996 | 46,299 | 77,697 | 15.7 | 5.9 | 9.8 | 1.848 |
| 1999 | 7,990,100 | 117,539 | 46,295 | 71,244 | 14.7 | 5.8 | 8.9 | 1.716 |
| 2000 | 8,073,600 | 116,994 | 46,701 | 70,293 | 14.5 | 5.8 | 8.7 | 1.698 |
| 2001 | 8,152,900 | 110,356 | 45,284 | 65,072 | 13.5 | 5.6 | 7.9 | 1.590 |
| 2002 | 8,230,300 | 110,715 | 46,522 | 64,193 | 13.5 | 5.7 | 7.8 | 1.577 |
| 2003 | 8,309,200 | 113,467 | 49,001 | 64,466 | 13.6 | 5.9 | 7.7 | 1.592 |
| 2004 | 8,398,300 | 131,609 | 49,568 | 82,041 | 15.7 | 5.9 | 9.8 | 2.054 |
| 2005 | 8,447,400 | 141,901 | 51,962 | 89,939 | 16.8 | 6.2 | 10.7 | 2.330 |
| 2006 | 8,553,100 | 148,946 | 52,248 | 96,698 | 17.4 | 6.1 | 11.3 | 2.329 |
| 2007 | 8,666,100 | 151,963 | 53,655 | 98,308 | 17.5 | 6.2 | 11.3 | 2.300 |
| 2008 | 8,779,900 | 152,086 | 52,710 | 99,376 | 17.3 | 6.0 | 11.3 | 2.252 |
| 2009 | 8,897,000 | 152,139 | 52,514 | 99,625 | 17.1 | 5.9 | 11.2 | 2.260 |
| 2010 | 8,997,600 | 165,643 | 53,580 | 112,063 | 18.4 | 6.0 | 12.4 | 2.266 |
| 2011 | 9,111,100 | 176,072 | 53,762 | 122,310 | 19.3 | 5.9 | 13.4 | 2.381 |
| 2012 | 9,235,100 | 174,469 | 55,017 | 119,452 | 18.9 | 6.0 | 12.9 | 2.336 |
| 2013 | 9,356,500 | 172,671 | 54,383 | 118,288 | 18.5 | 5.8 | 12.7 | 2.216 |
| 2014 | 9,477,100 | 170,503 | 55,648 | 114,855 | 18.0 | 5.9 | 12.1 | 2.176 |
| 2015 | 9,593,000 | 166,210 | 54,697 | 111,513 | 17.3 | 5.7 | 11.6 | 2.121 |
| 2016 | 9,705,600 | 159,464 | 56,648 | 102,816 | 16.4 | 5.8 | 10.6 | 2.036 |
| 2017 | 9,810,000 | 144,041 | 57,109 | 86,932 | 14.7 | 5.8 | 8.9 | 1.873 |
| 2018 | 9,898,000 | 138,982 | 57,250 | 81,732 | 14.0 | 5.8 | 8.2 | 1.757 |
| 2019 | 9,931,200 | 141,179 | 55,916 | 85,263 | 14.1 | 5.6 | 8.5 | 1.797 |
| 2020 | 10,000,100 | 126,571 | 75,647 | 50,924 | 12.6 | 7.5 | 5.1 | 1.645 |
| 2021 | 10,044,700 | 112,284 | 76,878 | 35,406 | 11.1 | 7.6 | 3.5 | 1.476 |
| 2022 | 10,095,200 | 122,846 | 60,810 | 62,036 | 12.1 | 6.1 | 6.0 | 1.667 |
| 2023 | 10,154,000 | 112,620 | 60,150 | 52,470 | 11.1 | 5.9 | 5.2 | 1.553 |
Current vital statistics edit
| Period | Live births | Deaths | Natural increase |
|---|---|---|---|
| January–February 2023 | 19,158 | 11,191 | 7,967 |
| January–February 2024 | 17,081 | 10,395 | 6,686 |
| Difference |

Structure of the population edit
Population Estimates by Sex and Age Group (01.I.2021):[18]
| Age Group | Male | Female | Total | % |
|---|---|---|---|---|
| Total | 5 053 800 | 5 065 300 | 10 119 100 | 100 |
| 0-4 | 374 400 | 329 400 | 703 800 | 6.96 |
| 5-9 | 454 100 | 394 700 | 848 800 | 8.39 |
| 10-14 | 379 900 | 328 300 | 708 200 | 7.00 |
| 15-19 | 333 000 | 291 500 | 624 500 | 6.17 |
| 20-24 | 362 800 | 327 600 | 690 400 | 6.82 |
| 25-29 | 447 700 | 421 800 | 869 500 | 8.59 |
| 30-34 | 465 500 | 473 900 | 939 400 | 9.28 |
| 35-39 | 411 600 | 424 300 | 835 900 | 8.26 |
| 40-44 | 349 200 | 355 000 | 704 200 | 6.96 |
| 45-49 | 292 100 | 314 500 | 606 600 | 5.99 |
| 50-54 | 304 700 | 338 500 | 643 200 | 6.36 |
| 55-59 | 299 100 | 339 800 | 638 900 | 6.31 |
| 60-64 | 256 800 | 292 500 | 549 300 | 5.43 |
| 65-69 | 143 500 | 175 200 | 318 700 | 3.15 |
| 70-74 | 82 100 | 109 400 | 191 500 | 1.89 |
| 75-79 | 33 500 | 49 900 | 83 400 | 0.82 |
| 80-84 | 40 100 | 63 500 | 103 600 | 1.02 |
| 85-89 | 15 200 | 23 000 | 38 200 | 0.38 |
| 90-94 | 6 300 | 9 100 | 15 400 | 0.15 |
| 95-99 | 1 600 | 2 200 | 3 800 | 0.04 |
| 100+ | 600 | 1 200 | 1 800 | 0.02 |
| Age group | Male | Female | Total | Percent |
| 0-14 | 1 208 400 | 1 052 400 | 2 260 800 | 22.34 |
| 15-64 | 3 522 500 | 3 579 400 | 7 101 900 | 70.18 |
| 65+ | 322 900 | 433 500 | 756 400 | 7.47 |
Fertility rate (The Demographic Health Survey) edit
Fertility Rate (TFR) (Wanted Fertility Rate) and CBR (Crude Birth Rate):[19]
| Year | CBR (Total) | TFR (Total) | CBR (Urban) | TFR (Urban) | CBR (Rural) | TFR (Rural) |
|---|---|---|---|---|---|---|
| 2006 | 17,2 | 2,0 (1,8) | 15,6 | 1,8 (1,7) | 19,3 | 2,3 (2,0) |
Regional differences edit
As of 2022, Azerbaijan has a crude birth rate of 12.2‰. Rural areas tend to have higher birth rates compared to urban areas (13.8‰ and 10.8‰, respectively).
| Town/region | CBR in 1990 (‰) | CBR in 2000 (‰) | CBR in 2010 (‰) | CBR in 2022 (‰) |
|---|---|---|---|---|
| Baku (city) | 19.5 | |||
| Absheron District | 28.2 | |||
| Sumqayit (city) | 25.1 | |||
| Ganja (city) | 20.7 | |||
| Agstafa District | 15.9 | |||
| Tovuz District | 26.3 | |||
| Shamkir District | 27.8 | |||
| Gadabay District | 25.1 | |||
| Dashkasan District | 33.8 | |||
| Samukh District | - | 11.3 | ||
| Goranboy District | 26.9 | |||
| Goygol District | 23.9 | |||
| Republic of Azerbaijan | 25.9 |
As of 2022, the economic regions of Mountainous Shirvan and Mil-Mughan have the highest birth rate in Azerbaijan. On the other hand, the Absheron-Khizi economic region and the Nakhchivan Autonomous Republic have the lowest birth rate in the country. The highest death rate is in the Gazakh-Tovuz economic region, while the lowest is in Absheron-Khizi.
| Economic region | CBR (‰) | CDR (‰) | Natural increase (‰) |
|---|---|---|---|
| Baku city | 10.6 | 6.2 | 4.4 |
| Absheron-Khizi Economic Region | 7.0 | 3.8 | 3.2 |
| Ganja-Dashkasan Economic Region | 10.8 | 6.9 | 3.9 |
| Shaki-Zagatala Economic Region | 12.2 | 6.4 | 5.8 |
| Lankaran-Astara Economic Region | 14.2 | 5.4 | 8.8 |
| Guba-Khachmaz Economic Region | 14.1 | 6.1 | 8.0 |
| Central Aran Economic Region | 13.7 | 6.4 | 7.3 |
| Karabakh Economic Region | 14.1 | 6.6 | 7.5 |
| East Zangezur Economic Region | 14.5 | 6.4 | 8.1 |
| Mountainous Shirvan Economic Region | 15.3 | 6.5 | 8.8 |
| Nakhchivan Autonomous Republic | 9.8 | 5.0 | 4.8 |
| Gazakh-Tovuz Economic Region | 13.3 | 7.2 | 6.1 |
| Mil-Mughan Economic Region | 14.7 | 5.6 | 9.1 |
| Shirvan-Salyan Economic Region | 13.8 | 6.3 | 7.5 |
| Republic of Azerbaijan | 12.2 | 6.0 | 6.2 |


Life expectancy edit
| Period | Life expectancy in Years |
Period | Life expectancy in Years |
|---|---|---|---|
| 1950–1955 | 58.4 | 1985–1990 | 65.2 |
| 1955–1960 | 60.4 | 1990–1995 | 64.6 |
| 1960–1965 | 61.5 | 1995–2000 | 66.2 |
| 1965–1970 | 62.6 | 2000–2005 | 67.4 |
| 1970–1975 | 63.5 | 2005–2010 | 70.1 |
| 1975–1980 | 63.9 | 2010–2015 | 71.6 |
| 1980–1985 | 64.4 |
Source: UN World Population Prospects[22]
Demographic statistics edit
Ethnic groups edit
| Ethnic group |
Census 19261 | Census 19392 | Census 19593 | Census 19704 | Census 19795 | Census 19896 | Census 19997 | Census 20098 | Census 20199 | |||||||||
|---|---|---|---|---|---|---|---|---|---|---|---|---|---|---|---|---|---|---|
| Number | % | Number | % | Number | % | Number | % | Number | % | Number | % | Number | % | Number | % | Number | % | |
| Azerbaijanis | 1,437,977 | 62.1 | 1,870,471 | 58.4 | 2,494,381 | 67.5 | 3,776,778 | 73.8 | 4,708,832 | 78.1 | 5,804,980 | 82.7 | 7,205,464 | 90.6 | 8,172,809 | 91.6 | 9,436,123 | 94.8 |
| Lezgins | 37,263 | 1.6 | 111,666 | 3.5 | 98,211 | 2.7 | 137,250 | 2.7 | 158,057 | 2.6 | 171,395 | 2.4 | 178,021 | 2.2 | 180,312 | 2.02 | 167,570 | 1.68 |
| Armenians | 282,004 | 12.2 | 388,025 | 12.1 | 442,089 | 12.0 | 483,520 | 9.4 | 475,486 | 7.9 | 390,505 | 5.6 | ~120,700[a] | 1.7 | ~120,300[b] | 0.02 | 178 | |
| Russians | 220,545 | 9.5 | 528,318 | 16.5 | 501,282 | 13.6 | 510,059 | 10.0 | 475,255 | 7.9 | 392,304 | 5.6 | 141,687 | 1.8 | 119,307 | 1.34 | 71,046 | 0.7 |
| Talysh | 77,323 | 3.3 | 87,510 | 2.7 | 85 | 0.0 | 21,169 | 0.3 | 76,841 | 1.0 | 111,996 | 1.26 | 87,578 | 0.88 | ||||
| Avars | 19,104 | 0.8 | 15,740 | 0.5 | 17,254 | 0.5 | 30,735 | 0.6 | 35,991 | 0.6 | 44,072 | 0.6 | 50,871 | 0.6 | 49,838 | 0.56 | 48,636 | 0.49 |
| Turks | 95 | 0.0 | 600 | 0.0 | 202 | 0.0 | 8,491 | 0.2 | 7,926 | 0.1 | 17,705 | 0.3 | 43,454 | 0.5 | 37,975 | 0.43 | 30,516 | 0.35 |
| Tatars | 9,948 | 0.4 | 27,591 | 0.9 | 29,370 | 0.8 | 31,353 | 0.6 | 31,204 | 0.5 | 28,019 | 0.4 | 30,011 | 0.4 | 25,911 | 0.29 | 17,712 | 0.18 |
| Tats | 28,443 | 1.2 | 2,289 | 0.1 | 5,887 | 0.2 | 7,769 | 0.2 | 8,848 | 0.1 | 10,239 | 0.1 | 10,922 | 0.1 | 25,218 | 0.28 | 27,657 | 0.28 |
| Ukrainians | 18,241 | 0.8 | 23,643 | 0.7 | 25,778 | 0.7 | 29,160 | 0.6 | 26,402 | 0.4 | 32,345 | 0.5 | 28,984 | 0.4 | 21,509 | 0.24 | 13,947 | 0.14 |
| Tsakhurs | 15,552 | 0.7 | 6,464 | 0.2 | 2,876 | 0.1 | 6,208 | 0.1 | 8,546 | 0.1 | 13,318 | 0.2 | 15,877 | 0.2 | 12,289 | 0.14 | 13,361 | 0.13 |
| Udins | 2,445 | 0.1 | 3,202 | 0.1 | 5,492 | 0.1 | 5,841 | 0.1 | 6,125 | 0.1 | 4,152 | 0.1 | 3,821 | 0.04 | 3,540 | 0.04 | ||
| Georgians | 9,500 | 0.4 | 10,196 | 0.3 | 9,526 | 0.3 | 13,595 | 0.3 | 11,412 | 0.2 | 14,197 | 0.2 | 14,877 | 0.2 | 9,912 | 0.11 | 8,442 | 0.08 |
| Jews | 20,578 | 0.9 | 41,245 | 1.3 | 40,198 | 1.1 | 48,652 | 1.0 | 35,487 | 0.6 | 30,792 | 0.4 | 8,916 | 0.1 | 9,084 | 0.10 | 5,094 | 0.05 |
| Kurds | 41,1937 | 1.8 | 6,005 | 0.2 | 1,487 | 0.0 | 5,488 | 0.1 | 5,676 | 0.1 | 12,226 | 0.2 | 13,075 | 0.2 | 6,065 | 0.07 | 4,105 | 0.04 |
| Others | 94,00 | 4.1 | 85,387 | 2.7 | 25,889 | 0.7 | 22,531 | 0.4 | 31,552 | 0.5 | 31,787 | 0.5 | 9,541 | 0.1 | 16,095 | 0.11 | 15,904 | 0.16 |
| Total | 2,314,571 | 3,205,150 | 3,697,717 | 5,117,081 | 6,026,515 | 7,021,178 | 7,953,438 | 8,922,447 | 9,951,409 | |||||||||
| 1 Source: [2]. 2 Source: [3]. 3 Source: [4]. 4 Source: [5]. 5 Source: [6]. 6 Source: [7]. 7 Almost all Kurds lived in Kurdistan Uyezd, the territory between Armenia and Nagorno Karabakh. In the late 1930s Soviet authorities deported most of the Kurdish population of Azerbaijan to Kazakhstan.9 Source:[26] | ||||||||||||||||||
According to the CIA World Factbook:[23]
- Azerbaijanis 91.6%
- Lezgins 2.0%
- Armenian 1.3%
- Russians 1.3%
- Talysh 1.3%
- Other 2.4%
Languages edit
- Azerbaijani (official) 92.5%
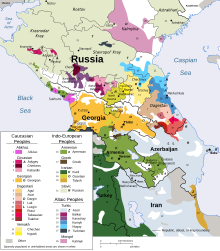
Ethno-linguistic groups in Azerbaijan - Russian 1.4%
- Armenian 1.4%
- Other 4.7%

Age structure edit
- 0-14 years: 22.3% (male 1,208,400/female 1,052,400)
- 15-24 years: 13% (male 695,800/female 619,100)
- 25-54 years: 45.4% (male 2,270,800/female 2,328,000)
- 55-64 years: 11.7% (male 555,900/female 632,300)
- 65 years and over: 7.5% (male 322,900/female 433,500) (2021 est.)
Median age edit
- Total: 32.6 years[28]
- Male: 31.1 years
- Female: 34.2 years (2020 est.)
Urbanization edit
- Urban population:5.554.445 people. This is 55.5% of total population (2019)[28]
- Rate of urbanization: 1.64% of annual rate of change (2010-15 est.)
Sex ratio edit
- At birth: 1.12 male(s)/female
- 0-14 years: 1.16 male(s)/female
- 15-24 years: 1.09 male(s)/female
- 25-54 years: 0.99 male(s)/female
- 55-64 years: 0.98 male(s)/female
- 65 years and over: 0.64 male(s)/female
- Total population: 0.996 male(s)/female (2021 est.)
Infant mortality rate edit
- Total: 26.67 deaths/1,000 live births
- Country comparison to the world: 69
- Male: 27.47 deaths/1,000 live births
- Female: 25.76 deaths/1,000 live births (2014 est.)
Life expectancy at birth edit
- Total population: 71.91 years[29]
- Country comparison to the world: 141
- Male: 68.92 years
- Female: 75.26 years (2014 est.)
Total fertility rate edit
- 2.04 children born/woman (2009 est.)
- 1.92 children born/woman (2012 est.)
- 1.91 children born/woman (2014 est.)
- Country comparison to the world: 138
HIV/AIDS edit
- Adult prevalence rate: less than 0.2% (2012 est.)
- Country comparison to the world: 106
- People living with HIV/AIDS: 10.400 (2012 est.)
- Country comparison to the world: 102
- Deaths: 65 (2012 est.)
- Country comparison to the world: 85
Nationality edit
- Noun: Azerbaijani(s)
- Adjective: Azerbaijani
Religions edit
- Note: Religious affiliation is still nominal in Azerbaijan; percentages for actual practicing adherents are much lower.[citation needed]
Literacy edit
- Definition: age 15 and over can read and write
- Total population: 99.8%
- Male: 99.9%
- Female: 99.7% (2010 census)
Education expenditures edit
- 2.4% of total GDP (2011)
- Country comparison to the world: 158[clarification needed]
See also edit
Notes edit
- ^ AzStat: As a result of expert calculations based on the results of the 1989 census, the number of Azerbaijani citizens of Armenian descent living in the Nagorno-Karabakh region was 120086 people (57904 men, 62182 women). According to the latest census in 1999, the number of Azerbaijani citizens of Armenian descent living in other parts of the country, except Nagorno-Karabakh, was 659 (47 men and 612 women)
- ^ AzStat: As a result of expert calculations based on the results of the 1989 census, the number of Azerbaijani citizens of Armenian descent living in the Nagorno-Karabakh region was 120,086,120,097 (57,904 men, 62,182 women). According to the latest census in 2009, the number of Azerbaijani citizens of Armenian descent living in other parts of the country, except Nagorno-Karabakh, was 220 (17 men, 203 women). (See.)
References edit
- ^ "Population - Population change". The State Statistical Committee of the Republic of Azerbaijan. Retrieved 4 August 2017.
- ^ "Azərbaycanda dеmоqrаfik vəziyyət" (in Azerbaijani). State Statistical Committee of Azerbaijan. 18 February 2019.
- ^ "Azərbaycanda demoqrafik vəziyyət". Azərbaycan Respublikasının Dövlət Statistika Komitəsi.
- ^ "Azərbaycanın 9 milyonuncu vətəndaşı anadan olub". Archived from the original on 2016-03-04. Retrieved 2010-08-29.
- ^ "Названа численность населения Азербайджана – Meydan TV". Archived from the original on 2018-06-20. Retrieved 2016-07-15.
- ^ "Azərbaycanda dеmоqrаfik vəziyyət" (in Azerbaijani). State Statistical Committee of Azerbaijan. 18 February 2019.
- ^ "Demoqrafik göstəricilər - Əhalinin sayının dəyişilməsi". Archived from the original on 2011-10-06. Retrieved 2010-08-29.
- ^ "Население Азербайджана достигло 9 млн. 47 тыс. человек". 1news.az.
- ^ United Nations Demographic Yearbooks
- ^ "PHP 8.1.7 - phpinfo()". www.azstat.org.
- ^ "Azərbaycanda demoqrafik vəziyyət".
- ^ "2023-cü ildə Azərbaycanda 112 min 620 körpə doğulub".
- ^ "Azerbaijan discloses number of deaths in 2023". 14 February 2024.
- ^ "Demographic situation in Azerbaijan, I-VI 2022".
- ^ "Demographic situation in Azerbaijan, I-VI 2023".
- ^ Samadov (www.anarsamadov.net), Anar. "Demographic situation in Azerbaijan". The State Statistical Committee of the Republic of Azerbaijan. Retrieved 2024-04-19.
- ^ Samadov (www.anarsamadov.net), Anar. "Demographic situation in Azerbaijan". The State Statistical Committee of the Republic of Azerbaijan. Retrieved 2024-04-19.
- ^ "Əhali | Azərbaycan Respublikasının Dövlət Statistika Komitəsi".
- ^ "The DHS Program - Quality information to plan, monitor and improve population, health, and nutrition programs".
- ^ 2.6. Natural increase, births and deaths by towns and regions of the Republic of Azerbaijan [1]
- ^ "Population of Azerbaijan".
- ^ "World Population Prospects – Population Division – United Nations". Retrieved 2017-07-15.
- ^ a b The State Statistical Committee of the Azerbaijan Republic, The ethnic composition of the population according to the 2009 census. azstat.org
- ^ Statistical Yearbook of Azerbaijan 2006, State Statistical Committee, Baku, table 2.6, p. 69
- ^ "The Population of Azerbaijan". Archived from the original on 2018-03-28. Retrieved 2008-05-17.
- ^ "Censuses of Republic of Azerbaijan 1979, 1989, 1999, 2009, 2019". Archived from the original on November 30, 2012.
- ^ a b "Middle East :: AZERBAIJAN". CIA The World Factbook. 2 March 2022.
- ^ a b "Azerbaijan Demographics Profile". www.indexmundi.com.
- ^ "World Health Statistics 2014 Part III Global health indicators" (PDF). World Health Organization. Archived from the original (PDF) on 4 April 2022.
![]() This article incorporates public domain material from The World Factbook (2024 ed.). CIA.
This article incorporates public domain material from The World Factbook (2024 ed.). CIA.