Talk:Feynman diagram/Archive 1
| This is an archive of past discussions about Feynman diagram. Do not edit the contents of this page. If you wish to start a new discussion or revive an old one, please do so on the current talk page. |
| Archive 1 |
Antiparticles
This article states that antiparticles aren't really normal particles travelling backwards in time, but the antiparticle article seems to say that seeing them as travelling backwards in time is a good interpretation. This is inconsistent.
- The antiparticle article is correct, however in practice it is more useful to consider it an anti-particle moving forward in time
- JeffBobFrank 02:24, 27 Mar 2004 (UTC)
WikiTex
Man, that WikiTeX Feynman diagram thing at Wikisophia is the bee's knees. We need it over here! --Matt McIrvin 01:40, 10 Oct 2004 (UTC)
Picture
Maybe a picture of an actual diagram would be appropriate in this article? Anyone? --Ignignot 20:52, Feb 15, 2005 (UTC)
If I'm not mistaken, the first example feynman diagram on the top of the page has the arrow of the positron moving in the wrong direction. Gronkkk (talk) 08:35, 21 October 2011 (UTC)
- It's the right direction. As the article says here, an incoming antifermion is represented as an arrow pointing away from the vertex. BTW, the issue has already been discussed ad nauseam in this talk page (see e.g. here). Cheers, Ptrslv72 (talk) 18:10, 31 October 2011 (UTC)
- Gronkkk, you're trying to draw the diagrams the way Feynman did. Apparently there are people here who think they know better than Feynman.-- cheers, Michael C. Price talk 00:44, 1 November 2011 (UTC)
- The picture is consistent with the convention described in the article, and used in many modern QFT textbooks (see also this other discussion). Too bad that Michael can't get over it. Cheers, Ptrslv72 (talk) 11:30, 1 November 2011 (UTC)
- Gronkkk, you're trying to draw the diagrams the way Feynman did. Apparently there are people here who think they know better than Feynman.-- cheers, Michael C. Price talk 00:44, 1 November 2011 (UTC)
Penguin diagram picture?
I got redirected to "Feynman diagram" from "Penguin diagram". However, the article is missing any picture of penguin diagrams... I think a picture (or even a separate article on the subject) could be appropriate. I found a nice picture at http://www.kek.jp/intra-e/info/archive/belle2-e.html -- I am not sure about copyrights though... Anyone experienced in checking/posting that?
- Surely penguin diagram should be in a separate article; it is hardly an important enough fact about feynman diagrams to be mentioned where it is, its prominence in the article is very misleading. the penguin is a fact about gauge theory really rather than feynman diagrams. Notjim 22:09, 1 March 2007 (UTC)
Expert needed
This article has problems with its writing, particularly in the "Mathematical details" section. Some of the statements don't even make sense:
- Lemma: The reduced graph associated with a connected feynman graph is a tree. Otherwise, it is a forest.
Otherwise to what?
The paragraph immediately below it is incoherent, with extremely long sentences sprinkled liberally with parentheses. And so on.
- I did a thorough copyedit and rephrasing some while ago. My version is now at Feynman graph. Septentrionalis 16:16, 28 July 2005 (UTC)
Someone who understands the theory should do this article a huge favor and clean it up. RSpeer 05:11, Mar 20, 2005 (UTC)
- It has been assigned to me... I'll see what I can do, but its not my particular bit of expertise. Gimme a few weeks to read the background, and I might be able to improve it some more... DoomBringer 04:49, 12 July 2005 (UTC)
- I'm an expert, and this article is way too math-oriented. I'll see what I can do in my spare time when I'm not, you know, solving Feynman diagrams. Nubby 02:02, 19 July 2005 (UTC)
Hi, rewrote the section on the Connected diagrams: linked cluster theorem. Hope that helped in improving this specific part of the article. Comments on my proposal are welcome ... —Preceding unsigned comment added by 129.206.28.165 (talk) 16:28, 28 January 2011 (UTC)
Diagram shows
Surely it shows an electron and a positron annihilating? --Richard Clegg 18:19, 24 April 2006 (UTC)
The top diagram in the article seems to have the arrows on the wrong way round. For the electron and positron to approach one another the arrows should point towards the collision point. Likewise, the quark arrows should point away from their collision point -- or am I missing something deep and meaningful? -- R. Carter —Preceding unsigned comment added by 172.143.221.192 (talk) 11:00, 4 December 2007 (UTC)
- Not true. Antiparticles, like positrons and antiquarks, are drawn backwards in time. Please read the article, it contains all necessary information. --Quilbert (talk) 14:42, 5 December 2007 (UTC)
- Where does the article say that? I can't find it. Do you really think it is a good idea to add a confusing figure as a simple example? Gronkkk (talk) 08:43, 21 October 2011 (UTC)
just a small point, in the diagrams description; "In this diagram, a kaon, made of an up and anti-strange quark, decays weakly into three pions, with intermediate steps involving a W boson and a gluon." should the "weakly" be there since the gluon means this isn't just a weak interaction. —Preceding unsigned comment added by 81.107.131.120 (talk) 00:16, 11 September 2008 (UTC)
Graph vs Diagram
For me it seems that this kind of Feynman diagram vs Feynman graph distinction is misleading. First of all one can observe the intention to distinguish physical and mathematical usage, that would be OK, but actually it is not what only happens. "Diagram" better speaks about "noncovariant perturbation theory diagram"s (see "time story") and "graph" is about the mathemathical and the covariant (what IS actually the Feynman-graph or diagram of physics that are interchangable). Hidaspal 11:49, 10 May 2006 (UTC)
Intro to page
A small point: but it seems a pity that the verbal description has time increasing bottom -> top but the example diagram has time increasing left -> right. It would seem trivial to change one or the other to bring them into correspondence and avoid this extra minor hurdle to understanding - any reason why not? And would someone in the field like to say which is the commonest convention? (Perhaps in some sense it doesn't matter because you can rotate the axes depending of the frame of reference - but since the elementary description at the start does not assume this, it would still be best to have the words and pictures in harmony.)
David Young, Department of Informatics, University of Sussex
- My experience is that theorists tend to use the time goes from bottom to top convention and experimentalists tend to use the left to right convention. Josh Thompson 23:39, 16 February 2007 (UTC)
- I would vote for going with bottom to top, as that is what Feynman typically used (see his lectures on the concept at http://www.vega.org.uk/video/subseries/8. Most people browsing Wikipedia would tend to have more exposure to theorists than experimentalists, so this makes sense to me. Of course, we should add a caveat that some physicists prefer time moving from left to right, which is equivalent in all respects. Wikipedia brown 14:37, 28 February 2007 (UTC)
- I've done some general rewriting in (what are now) the first two paragraphs. There is now an explanation of the fact that time sometimes is drawn on one axis and sometimes on the other. IMHO, the article could now use some rewriting (or at least rearrangement) below the first two paragraphs. There introduction of cross section and discussion of perturbation theory seems out of place. I may do it eventually. Josh Thompson 19:13, 30 March 2007 (UTC)
General Comment
This article is terrible. There is far too much whimsy and technicality. I'd remove the whole buisness of Penguin diagrams from here - they don't warrant a mention right in the intro. Leave the maths till later, drop the "little story", give some better pedagogical insight to the lay reader.
In your example of a Feynman diagram you have a diagram showing two electrons colliding and the arrows giving the result of two quarks along with a gluon and they are all labelled EXCEPT WHAT DOES THE "Y" STAND FOR IN THE DIAGRAM!!!! That's what I want to know since the diagrams explanation says everything about the reaction EXCEPT WHAT THE "Y" REPRESENTS.Please tell me what the "Y" represents in the diagram, then maybe I will better understand the wiki article explaining Feynman diagrams.TY.
24.226.10.98 08:06, 29 September 2006 (UTC)gf
- The "Y" is a γ (gamma) and is the standard symbol for a photon, just as "e" is the standard symbol for an electron. Perhaps the diagram should use a typeface that actually shows the loop at the bottom of the gamma, though. --Strait 14:22, 29 September 2006 (UTC)
Physorg
PhysOrg used the penguin diagram from this article. Particle decay may point to New Physics Discussion at PhysOrgForum -Ravedave (help name my baby) 21:33, 12 October 2006 (UTC)
Can someone add Order?
What is the order of a Feynman diagram? Can someone add it to the article? It is alluded to in the fine structure constant article. Thanks. Wikipedia brown 14:41, 28 February 2007 (UTC)
- The "order" is the number of vertices that the diagram has. On the fine-structure constant page, there is some discussion of perturbation theory. I added another wikilink there. Josh Thompson 07:29, 8 March 2007 (UTC)
Real φ4
I really think the Real φ4 section needs to be removed, it doesn't help explain the diagrams at all, if anything, it just shrouds them in mystery! Joelholdsworth 17:01, 9 March 2007 (UTC)
Penguin diagram picture
The penguin diagram picture seems completely incorrect to me. The arrow directions don't match the labelling, and the lower vertex doesn't even conserve baryon number. Please correct this, whoever made the picture. Quilbert 13:55, 12 March 2007 (UTC)
- I have inserted a new image. --Quilbert 20:25, 23 September 2007 (UTC)
Direction of anti-particles in diagram #1
- deleted*
Cynical Jawa 10:05, 6 April 2007 (UTC) Sorry, this was total crap. I am an eejit.Cynical Jawa 10:12, 6 April 2007 (UTC)
Links to graph theory
Why does vertex in "they met each other (the two lines meet at a first point -- [vertex (graph theory]|vertex])," link to graph theory? As far as I can see the use of the word vertex in this article is different from that used in graph theory, ie. in graph theory a vertex can have zero edges. Taemyr 20:37, 12 May 2007 (UTC)
- I don't know anything about graph theory, but you're probably right. Getting rid of the links is fine. Josh Thompson 00:56, 13 May 2007 (UTC)
The Diagram - can't find citation though
I heard that Feynman modestly refers to this as "The Diagram", with emphasis indicating that this is, essentially, the only diagram that matters, it being central to everything. I would add this to the "other names" section, only I can't find a citation. It may be mentioned in GEB by Hofstadter but I can't find my copy. — PhilHibbs | talk 14:37, 5 June 2007 (UTC)
Drawing Convention
Having recently been introduced to Feynman diagrams at school, it has been made clear to all on the course that drawing them completely horizontal, like the diagram presently at the top of the page, is incorrect and causes needless confusion. This makes sense, as according to the axis on that diagram, positron and antiquark travel backwards in time during the reaction, which is rubbish. The diagram is also incorrectly labelled, as stated previously, as it shows an electron changing into a positron (and causing, or being caused by, the interaction on the right side of the diagram) rather than an electron-positron collision, as evidenced by the arrows on the diagram.
Those on my Physics course have been assured that the correct way to draw a Feynman diagram is that of the diagram currently under "mathematical details". In this form any collisions between particles or changes from one particle to another can be seen clearly, and the order in which events occur (ie, something decays, releasing something, causing something else to change) is also shown clearly.
The Initial form of the diagram seems to remain fairly common, but perhaps the article should address these issues to avoid confusion? As it stands the corrected form of the diagram seems to be intended to be taken as a Feynman graph, which is in fact something different as evidenced in the article that wikipedia has on the subject.
If nothing else, the article needs clarification.
- As long as the diagram is clear and self-consistent, I don't see the problem. All the diagrams in this article illustrate their time axis, except for the kaon decay, where the description of the diagram and the labelling of the two quarks as a "kaon" on the left side make things; so I think there's enough clarity, and certainly they all illustrate what they say their illustrating. Practicing physicists use both time conventions; I personally prefer left-to-right time because it fits better with how English-speakers are used to following words and diagrams.
- I think you misunderstand the arrow conventions in Feynman diagrams, by the way. For antiparticles, the arrow points in the opposite direction of "forward in time." This makes more sense once you understand the mathematics of quantum field theory; mathematically, an antiparticle going forward in time would be the same as a particle going forward. -- SCZenz 14:40, 27 July 2007 (UTC)
- As SCZenz says, there is nothing incorrect with drawing them left-to-right, that's what many theorists do. The notable exception is Peskin and Schroeder. (As an aside, it would be more logical to draw them right-to-left, considering how you write the factors from the Feynman rules.)
- But maybe the confusion stems from the fact that the diagrams actually show momentum flows, not space-time pictures. --RE 16:36, 27 July 2007 (UTC)
Feynman's Method
What doesn't come across here is that Feynman developed the diagrams in a particle framework for relativistic theory which was both clear and correct. Because of structural defects in the education system, this is mostly kept secret. In Feynman's framework, the antiparticle goes backwards in time and the lines in the graph represent a sum over space-time trajectories. This space-time point of view is essential for understanding future developments.Likebox (talk) 05:13, 24 June 2008 (UTC)
Particles, not operators
Feynman, and others, described Feynman diagrams as particle paths. Wicks theorem makes them seem that they are somehow algebraic properties of operators. This is not satisfactory. Any Feynman diagram is a particle path contribution to the amplitude, and to avoid saying this is to give Feynman insufficient credit.Likebox (talk) 21:54, 25 September 2008 (UTC)
I will try to write the essential points in a clear way at some point, but here they are:
- The expansion of the path integral for field modes is expandable in propagators.
- The propagators have a Schwinger representation as sums over proper time.
- The Schwinger representation is a sum over all Brownian paths.
- The sum over paths is a particle representation, and identifies field and particle content.
There are many consequences of this picture:
- If you have a local Ising model, you can write the partition function as a Fermi particle path sum.
- If you have a free field theory you can expand it in the derivative to find a local proper-time hopping model
- If you have an OPE you can interpret the OPE as a way of including condensate contributions to particle collisions (SVZ).
None of these are hinted at by the idea that "Feynman diagrams are a reorganization of Wicks theorem", which is such an outrageously sterile way to explain this fertile idea.Likebox (talk) 22:00, 25 September 2008 (UTC)
- Dear Likebox, you just go ahead and expand the "path integral" part of the article. But, in my opinion, deleting a well established interpretation (extensively used for decades and still found in a bunch of modern textbooks) is not a constructive way to write a wikipedia article. Again, there are quite a few conceptual problems with path integrals (from mathematical and physical points of view) and there are physicists that believe that there is nothing new in path integrals, only a re-interpretation of facts already known from the good old canonical theory. I mean, it is not for nothing that it is called "canonical". The Feynman diagram is simply a term in the Wick's theorem, and there is nothing more to it, period. However, if you can constructively prove otherwise, be my guest, write it. But please don't delete a valid point of view just because you dislike it for some reason. Bakken (talk) 08:51, 26 September 2008 (UTC)
- One major problem with path integrals is that they are not defined (but you know that, don't you?). Specifically, the measure on the path is not defined. Path integrals are good for hand-waving, but if you try to really calculate anything, you get into problems immediately. Did you try to solve the easiest quantum problem with path integrals -- a one-dimensional oscillator? If you did, what was the measure you used? Is the measure dependent on the class of paths you used? Is that satisfactory? I am not saying those problems are insurmountable, but problems they are nonetheless. On top of the usual conceptual problems in quantum field theory. Bakken (talk) 09:20, 26 September 2008 (UTC)
- In conclusion: please, be constructive! Bakken (talk) 09:20, 26 September 2008 (UTC)
- I think path integrals are both 100% well defined, and that without them you can't do field theory. I will try to be more constructive in the future.Likebox (talk) 23:12, 29 September 2008 (UTC)
- :) there are textbooks where QED is done without a single path integral. And if you *think* the path integrals are 100% defined, could you please *define* one for a one-dimensional oscillator? See, it is not possible to define the measure on a path. It is only possible to define the measure on a narrow class of paths. Therefore you have to redefine your path integrals not only when you shift from one problem to another, but even within the same problem if you change your class of paths. I personally wouldn't call "100% defined" an object which you have to constantly redefine.
- Here is a quotation from the wikipedia article about path integrals: "There is some difficulty in defining a measure over the space of paths." Bakken (talk) 12:00, 30 September 2008 (UTC)
- Look, I know there's people saying that. It's annoying, because in this case the mathematicians are just being stupid. The definition of path integrals is really ok, and physicists worked out the mathematical fine points in the 70s, without any help from mathematicians. The "class of paths" is defined by the integral itself, and can't be specified in advance. I can define the whole thing completely fine, but I am not up to it today, I'll come back to it some other time.
- But please be considerate to path integrals, even though they sometimes have a bad reputation--- the textbook treatments are hard to follow because they don't use the path integral. All three, Feynman Schwinger and Tomonaga, derived the diagrams from Lagrangians. There were plenty of people who, after the fact, rederived them by operator manipulations, but these people were stuck on gauge theory until 'tHooft and Veltman revived the path integral. Today, anything you do is easier in the path integral, and some things, like an indefinite metric, are hard to motivate in any other way. But try to do ghosts, BRST or supersymmetry without it, it's next to impossible.Likebox (talk) 20:03, 30 September 2008 (UTC)
- :) I am not saying, path integrals are wrong, I am arguing that the alternative formulation, the good old "canonical" quantum field theory, should also be represented in this article. And by all means you just go ahead and improve upon the path integral section. Bakken (talk) 20:31, 30 September 2008 (UTC)
(deindent) I have no argument with your stuff--- its important. I didn't mean to be nasty.
I'll try to be clearer about what is annoying me. Here's the problem. Mathemticians are hung up on probability, because they do not accept as correct any construction which involves the limit of infinitely many coin tosses in sequence. If you use infinitely many random events to define an object, your construction is suspect, no matter how obvious.
The reason is the measure paradoxes of the early twentieth century, which are the result of axiomatic set theory. In axiomatic set theory you can construct what is known as a "non-measurable set", which is a nonconstructive object produced by uncountably many choices collected into a set using the "axiom of choice". This means that the notion of probability is complicated, requiring you to prespecify a set and a sigma algebra of sets on it with a map to numbers, which is the only way mathematicians outside of logic are currently allowed to talk about probability.
This problem means that the sentence "randomly pick a number between 0 and 1", although algorithmically perfectly well defined, is not well defined in set theory, since it leads to a paradox. If you can pick a real number uniformly at random between 0 and 1, and if it can be said to either be a member of an arbitrary set S or not a member of S, then the set S has measure. The measure is defined by picking real numbers uniformly at random between 0 and 1 again and again, then checking to see if they landed in S, and the percentage that landed in S, in the limit of many throws, defines the measure of S. It's countably additive, at least intuitively. This contradicts choice, and mathematicians for their own boneheaded reasons accept choice. The reason they accept choice is their pet theology regarding infinity, and there's no way to talk them out of it. Feynman tried a long time ago (I am inferring this from his autobiography, where he complains at some point about the Banach-Tarski paradox) but failed.
So what do you do in mathematics if you want to talk about infinite random processes? That depends on whether you're a logician or not. If you are not, you talk about sigma algebras and measures. If you are a logician, you can also talk about "random forcing", thereby guaranteeing that the only people who will pay attention will be a small community of specialists. Using random forcing, mathematicians have established that there are "alternative" universes in which every subset of the interval are measurable, that is, where the notion of uniformly picking a number at random between 0 and 1 makes complete sense. Duh.
In these universes, you can define picking a random function by a computer program, just as you define picking a random real number. When you pick a random function appropriately, you define a path integral. This construction requires one of two massive headaches to inject into mathematical discourse. Either you convince mathematicians to allow you to talk about random processes naturally, so that every subset of the interval is measurable, or you go through the insane process of figuring out what the space of distributions you get out is going to be, and define a sigma algebra on those. This is too much trouble to be worth it for a physicist, so they just define path integrals informally, as second order phase transitions in statistical computer models, for example, and let the mathematicians whine that this is "not rigorous" (meaning, it involves talking about infinite random processes as elements of the mathematical universe).Likebox (talk) 20:43, 30 September 2008 (UTC)
Echo above comments about the poor written composition of this article
This is yet another article in chemical physics that lacks didactic value. The problems start in the very first sentence:
"In quantum field theory a Feynman diagram is an intuitive graphical representation of a contribution to the transition amplitude or correlation function of a quantum mechanical or statistical field theory."
The words are all in an English Dictionary, but strung together like this I can't discern their meaning. —Preceding unsigned comment added by 173.75.216.225 (talk) 12:05, 7 August 2009 (UTC)
- I can't make any sense of it either. To me Feynman graphs are graphical representations of possible elementary particle interactions, not representations of a correlation functions in statistical field theory, but I am just a simple guy.Viridiflavus (talk) 13:33, 9 November 2009 (UTC)
- Wikipedia's policy on technical articles tells us that technical articles should not be dumbed down. However, it also says that there should be a sentence of two (at a minimum) in the introduction that explains the basic idea of the concept to a laymen (or, in Wikipedia's words, "to put the topic in some broader context"). Currently, that is not happening. I have a fairly decent physics and science background, and I have absolutely no idea what the first sentence in the intro means: "In quantum field theory a Feynman diagram is an intuitive graphical representation of a contribution to the transition amplitude or correlation function of a quantum mechanical or statistical field theory." At the very least, transition amplitude and correlation function should be linked to an article that defines those terms, if one is available. That way, if I am really interested in figuring out what the intro sentence means, I can at least go look up the terms that I'm unfamiliar with. However, even better would be to start off very generally and get more specific as the intro goes on. For instance: A Feynman diagram is a tool used by quantum physicists to create a graphical representation of the interactions between subatomic particles. I think that would be a great first sentence. Then you can follow it up with more specific information about transition amplitudes and correlation functions. SnottyWong talk 01:16, 25 November 2009 (UTC)
A Feynman diagram is not a tool. The tool is called perturbation theory. Perturbation theory represents a quantity to be calculated as an infinite series of terms. Feynman diagram is simply a picture which represents a term of the perturbation theory. Nothing more. It is not a graphical representation of interactions between subatomic particles. An interaction on the Feynman diagram is represented by a vertex. Feynman diagram can as well represent processes with non-interacting particles. Bakken (talk) 18:03, 25 January 2010 (UTC)
First Feynman Diagram of Electron/Positron Annihilation Wrong
The first diagram at the top of the article showing electron-positron annihilation shows only one photon emerging, a violation of conservation of momentum. It is well understood that when electrons/positrons annihilate they emit two gamma photons of 511 KeV each in opposite direction. The second diagram in the article showing electron-positron annihilation has it right, showing two photons emerging. Would someone correct that first diagram please. And yes, the article is extremely difficult to read and make sense of it.Oldnoah (talk) 13:23, 25 March 2010 (UTC)Oldnoah
- Sorry but I can't find any diagram the fits your description. Do you mean that diagram at the top right corner that starts with a electron-positron pair and ends with a quark-antiquark pair plus gluon? There is nothing wrong with that one. Dauto (talk) 04:46, 26 March 2010 (UTC)
Force carrier
Hello, I wonder if the very existence of force carrier particles does not lie only in perturbation theory. I mean I can't find a quantum field whose quantum particle is not a perturbation ON a static field, or at least an uncertainty of this field. The main speech that anyone can hear everywhere is the opposite: a field that seems to rise from particles (bosons) on fermions.Klinfran (talk) 20:57, 29 September 2010 (UTC)
Britannica explains this better
I might have added this to the #This article is too technical section, but my frustration with this article as a staunch Wikipedia advocate dictates that it get its own section. To the layman, this article is worse than useless - it is so technical as to be impenetrable. More accurately, the *introduction* is too technical - I'm totally fine with jargon after that. Feynman is famous enough that there are going to be plenty of people like me, who studied Physics to age 18 but no further, coming here in an attempt to learn what made him so famous. Here are the terms in the first hundred words that mean nothing to me, and would require considerable research to understand:
- scattering cross section
- perturbation theory
- the quantity is represented as an infinite series
- sum of ever decreasing terms
- perturbative contribution
- transition amplitude
- correlation function
- quantum mechanical or statistical field theory.
- Wick's expansion
- perturbative S-matrix.
By contrast, take a look at this article, where I only had to look up one of the first hundred words (fermions), and only because the paywall prevented me from reading the explanation. Yes, Ladies and Gentlemen, the Encyclopaedia Britannica article - even the free bit before you have to pay - is infinitely more comprehensible than this one. BRITANNICA WINS! At the very least, Britannica explains what each axis represents.
If you have a conscience, and know what you're talking about, please have a go at improving the introduction. Playclever (talk) 22:37, 20 October 2010 (UTC)
- Ha! Very well put.--Michael C. Price talk 22:46, 20 October 2010 (UTC)
- Although I should add that part of the beauty and utility of Feynman diagrams is that they work no matter how you orient them with respect to the space-time axes. Something that should be explained in the article - but isn't. --Michael C. Price talk 10:42, 22 October 2010 (UTC)
Anti-particle diagrams all wrong
I know this is denied above, but the arrows on all the anti-particles are the wrong way around. Anti-particles are particles travelling in the opposite direction. --Michael C. Price talk 22:46, 20 October 2010 (UTC)
- Hi Michael, I was checking for your reaction to our popular culture discussion and I noticed this unrelated comment of yours. I would say that the arrows in the pictures of this article are consistent with the notation used by most QFT books (I have Mandl-Shaw, section 4.4 and Peskin-Schroeder, section 5.1 right in front of me). Indeed, it is customary to draw the arrow as pointing in the direction of the flow of fermion number, i.e. from the initial to the final point in time for a fermion and from the final to the initial point for an antifermion. If you don't believe me just have a look at the cover of the first book I mentioned. Cheers, Ptrslv72 (talk) 11:13, 21 October 2010 (UTC)
- Have a look at the cover of Aitchson & Hey --Michael C. Price talk 16:57, 21 October 2010 (UTC)
- That's why I wrote "most QFT books". The point here is that you must not view the Feynman diagram as an actual depiction of a physical process, but rather as a visual tool that helps you get the proper ordering of the operators when you write down the amplitude. Usually the rule is that for each fermion line you write down the various operators by following the line backwards (w.r.t. to the direction of the arrow). This of course can be done only if all the arrows in a given fermion line point in the same direction, hence the different conventions for fermions and antifermions. The bottom line is that the direction of the arrows is a matter of convention, most textbooks use the convention that I told you, and you certainly cannot claim that the diagrams in this article are "all wrong". Cheers, Ptrslv72 (talk) 19:25, 21 October 2010 (UTC)
- Moreover, this is the convention explicitly described in the article!!!. Cheers Ptrslv72 (talk) 19:47, 21 October 2010 (UTC)
- Why you should regard that as evidence that they don't actually depict physical processes is beyond me. --Michael C. Price talk 22:34, 21 October 2010 (UTC)
- Don't switch topics. Can you read or not? The article - along with the textbooks I mentioned - say: "Positron in the initial state is represented by a solid line with an arrow pointing away from the vertex", which is precisely what the diagrams show. Why do you claim that they are all wrong? Ptrslv72 (talk) 22:54, 21 October 2010 (UTC)
- Hey, you switched topics, not me. And the answer is that the direction of the arrow is fine as long as we call it an electron. Call it a positron and the arrow flips direction. BTW, this the convention throughout Aitchison & Hey, not just a "typo" on the cover, in case you wondered. --Michael C. Price talk 23:19, 21 October 2010 (UTC)
- Can you read the sentence above or not? Try again: "Positron in the initial state is represented by a solid line with an arrow pointing away from the vertex". So 1) you call it a positron 2) you represent it as an arrow pointing away from the vertex. This is precisely what I see in the picture in the article. Are you seeing a different picture? Ptrslv72 (talk) 23:24, 21 October 2010 (UTC)
- Since I was describing Aitchson and Hey's usage, I imagine we probably are looking at different pictures. --Michael C. Price talk 23:28, 21 October 2010 (UTC)
- I am describing the picture in the article and quoting the sentence in the article. They appear to be 1) mutually consistent 2) consistent with Mandl-Shaw and Peskin-Schroeder. There may well be different conventions on the market, but claiming that the pictures in the article are all wrong (as I read in this section's title) is a gross misunderstanding. Cheers, Ptrslv72 (talk) 23:40, 21 October 2010 (UTC)
- Since I was describing Aitchson and Hey's usage, I imagine we probably are looking at different pictures. --Michael C. Price talk 23:28, 21 October 2010 (UTC)
- Can you read the sentence above or not? Try again: "Positron in the initial state is represented by a solid line with an arrow pointing away from the vertex". So 1) you call it a positron 2) you represent it as an arrow pointing away from the vertex. This is precisely what I see in the picture in the article. Are you seeing a different picture? Ptrslv72 (talk) 23:24, 21 October 2010 (UTC)
- Hey, you switched topics, not me. And the answer is that the direction of the arrow is fine as long as we call it an electron. Call it a positron and the arrow flips direction. BTW, this the convention throughout Aitchison & Hey, not just a "typo" on the cover, in case you wondered. --Michael C. Price talk 23:19, 21 October 2010 (UTC)
- Don't switch topics. Can you read or not? The article - along with the textbooks I mentioned - say: "Positron in the initial state is represented by a solid line with an arrow pointing away from the vertex", which is precisely what the diagrams show. Why do you claim that they are all wrong? Ptrslv72 (talk) 22:54, 21 October 2010 (UTC)
- Why you should regard that as evidence that they don't actually depict physical processes is beyond me. --Michael C. Price talk 22:34, 21 October 2010 (UTC)
- Have a look at the cover of Aitchson & Hey --Michael C. Price talk 16:57, 21 October 2010 (UTC)
Lead
A Feynman diagram is not a picture of a physical process. Indeed, there are diagrams that do not represent any physical process at all. For example, for the interaction Lagrangian the Feynman diagram,


does not represent any observable physical process. But it is still a Feynman diagram. Bakken (talk) 10:38, 21 October 2010 (UTC)
- This is another of those silly arguments about the word "physical" which we've disagreed about in the past. IIRC the Feynman lectures supported my usage. --Michael C. Price talk 16:59, 21 October 2010 (UTC)
- oh, no... ...why on earth did you come back? Your warring ignorance is not really helpful. Bakken (talk) 18:14, 21 October 2010 (UTC)
- Nor is your absolute assertion that all things gauge are unphysical. --Michael C. Price talk 18:18, 21 October 2010 (UTC)
- oh, no... ...why on earth did you come back? Your warring ignorance is not really helpful. Bakken (talk) 18:14, 21 October 2010 (UTC)
- "all things gauge are unphysical" -- what is that supposed to mean? Bakken (talk) 18:20, 21 October 2010 (UTC)
Here is another diagram,

which is not a process. It is a contribution to the mass of the fermion. Bakken (talk) 18:33, 21 October 2010 (UTC)
- All mass comes from the emission and absorption of Higgs, with the massive particle flipping from left/right/left.... Whether you call that physical or not is irrelevant. I do, you don't, it seems. --Michael C. Price talk 22:35, 21 October 2010 (UTC)
- What the hell are you talking about? All mass comes from the emission and absorption of Higgs with the massive particle flipping from left/right/left??? You can very well formulate consistent QFTs with mass terms that do not come from the Higgs (besides, a particle's mass in the SM comes from its coupling to the vacuum expectation value of the Higgs, not from its "emission and absorption of Higgs"!!!). Think about a few examples: in QED you can have an explicit fermion mass term without breaking the U(1) gauge symmetry and you don't need to introduce the Higgs. In the Standard Model you do introduce the Higgs, but there is no such thing as "left/right flipping" for the gauge bosons (which also get mass from their coupling to the Higgs). In the MSSM you have explicit, gauge-preserving (but SUSY-breaking) mass terms both for the sfermions and the gauginos, and they don't come from the Higgs. What Bakken writes above is indeed a contribution to the fermion mass from a loop of fermion and scalar, in his generic theory with a scalar-fermion-fermion coupling, and there is no Higgs involved. From the comments above your grasp of QFT appears to be quite tenuous, you should read those books on QFT before arguing with Bakken who clearly knows best. Ptrslv72 (talk) 23:20, 21 October 2010 (UTC)
- Look, Bakken was talking about fermion mass, and I'm talking about fermion mass in the standard model, OK? --Michael C. Price talk 23:25, 21 October 2010 (UTC)
- Even in the Standard Model there are radiative corrections to the fermion masses (from loops of gauge bosons and fermions, as well as loops from Higgs bosons and fermions). I agree with Bakken that a radiative correction to some property of a particle (e.g., its mass) is not usually called a physical process by people in the field. The same applies to the bubble diagram with no external legs that he wrote down first. But it's too late at night for me to enter another revert war. Ptrslv72 (talk) 23:56, 21 October 2010 (UTC)
- Since you're still up, and since we are talking "physics" I assume that you have no problem with "physical". Therefore it is "process" you object to? --Michael C. Price talk 00:18, 22 October 2010 (UTC)
- First of all, in technical language "physical" has a subtler meaning than your naive "pertaining to physics". We usually call "physical" (as opposed to "unphysical") something that - at least in principle - can be observed and/or measured. Think for example of the Higgs mechanism of the SM: the SU(2) doublet of complex scalars contains four degrees of freedom. One of them, is the physical Higgs particle, whose existence and properties we hope to detect and measure in collider experiments. The other three (the would-be Goldstone bosons that are "eaten" by the gauge bosons) are unphysical, in the sense that their properties (mass, couplings) as well as their very presence depend on an arbitrary choice of gauge fixing, and they do not appear in the initial or final states of a physical process. Indeed, as Bakken is trying to make you understand, we call physical process a transition between an observable initial state and an observable final state. There is an infinite series of contributions to a given process, with different topologies and different numbers of loops and vertices, and each of those contributions can be represented by a Feynman diagram. But an individual diagram does by no means represent the whole process. I understand that the lead might sound too technical to a lay reader, but it's not by adding sloppy statements that you are going to improve it. Cheers, Ptrslv72 (talk) 10:58, 22 October 2010 (UTC)
- I am well aware of how Bakken (and some others) define physical to exclude all gauge dependence (we had that out elsewhere and, as I said, the Feynman lectures disagreed with him). BTW your statement "Bakken is trying to make you understand, we call physical process a transition between an observable initial state and an observable final state." is incorrect in that Bakken is now trying to nikpick about the initial and final states having to be different. Finally, you make a cogent point about the process being the sum of a series of diagrams and not individual diagrams. I agree, and I should have (& will) express that better. You might have to take that up with Bakken, though, since his edit summary [1] said "a process is not a sum of diagrams...". --Michael C. Price talk 11:20, 22 October 2010 (UTC)
- I understand that Bakken defines physical as something that can be measured and/or observed. A quantity that depends on an arbitrary choice of gauge cannot be measurable, therefore it cannot be called physical. I am sorry if you don't like this use of language, but it's quite well established (and I don't know what you are referring to in the Feynman lectures). Cheers, Ptrslv72 (talk) 11:32, 22 October 2010 (UTC)
- Feynman lectures,II, 15-5 about the reality of the vector potential (which is a gauge field, of course). I'm not interested in discussing this ad nausem, and will remove "physical" since it seems such a red flag for some. --Michael C. Price talk 11:53, 22 October 2010 (UTC)
- Indeed, a sum of diagrams can be an approximation to the quantum-mechanical amplitude of a process, but it is not a process. A process is an experimentally observed change in a physical system. A Feynman diagram is a perturbative term of the S-matrix with normal-product of operators. These are two completely different concepts. Bakken (talk) 11:36, 22 October 2010 (UTC)
- I understand that Bakken defines physical as something that can be measured and/or observed. A quantity that depends on an arbitrary choice of gauge cannot be measurable, therefore it cannot be called physical. I am sorry if you don't like this use of language, but it's quite well established (and I don't know what you are referring to in the Feynman lectures). Cheers, Ptrslv72 (talk) 11:32, 22 October 2010 (UTC)
- I am well aware of how Bakken (and some others) define physical to exclude all gauge dependence (we had that out elsewhere and, as I said, the Feynman lectures disagreed with him). BTW your statement "Bakken is trying to make you understand, we call physical process a transition between an observable initial state and an observable final state." is incorrect in that Bakken is now trying to nikpick about the initial and final states having to be different. Finally, you make a cogent point about the process being the sum of a series of diagrams and not individual diagrams. I agree, and I should have (& will) express that better. You might have to take that up with Bakken, though, since his edit summary [1] said "a process is not a sum of diagrams...". --Michael C. Price talk 11:20, 22 October 2010 (UTC)
- First of all, in technical language "physical" has a subtler meaning than your naive "pertaining to physics". We usually call "physical" (as opposed to "unphysical") something that - at least in principle - can be observed and/or measured. Think for example of the Higgs mechanism of the SM: the SU(2) doublet of complex scalars contains four degrees of freedom. One of them, is the physical Higgs particle, whose existence and properties we hope to detect and measure in collider experiments. The other three (the would-be Goldstone bosons that are "eaten" by the gauge bosons) are unphysical, in the sense that their properties (mass, couplings) as well as their very presence depend on an arbitrary choice of gauge fixing, and they do not appear in the initial or final states of a physical process. Indeed, as Bakken is trying to make you understand, we call physical process a transition between an observable initial state and an observable final state. There is an infinite series of contributions to a given process, with different topologies and different numbers of loops and vertices, and each of those contributions can be represented by a Feynman diagram. But an individual diagram does by no means represent the whole process. I understand that the lead might sound too technical to a lay reader, but it's not by adding sloppy statements that you are going to improve it. Cheers, Ptrslv72 (talk) 10:58, 22 October 2010 (UTC)
- Since you're still up, and since we are talking "physics" I assume that you have no problem with "physical". Therefore it is "process" you object to? --Michael C. Price talk 00:18, 22 October 2010 (UTC)
- Even in the Standard Model there are radiative corrections to the fermion masses (from loops of gauge bosons and fermions, as well as loops from Higgs bosons and fermions). I agree with Bakken that a radiative correction to some property of a particle (e.g., its mass) is not usually called a physical process by people in the field. The same applies to the bubble diagram with no external legs that he wrote down first. But it's too late at night for me to enter another revert war. Ptrslv72 (talk) 23:56, 21 October 2010 (UTC)
- Look, Bakken was talking about fermion mass, and I'm talking about fermion mass in the standard model, OK? --Michael C. Price talk 23:25, 21 October 2010 (UTC)
- What the hell are you talking about? All mass comes from the emission and absorption of Higgs with the massive particle flipping from left/right/left??? You can very well formulate consistent QFTs with mass terms that do not come from the Higgs (besides, a particle's mass in the SM comes from its coupling to the vacuum expectation value of the Higgs, not from its "emission and absorption of Higgs"!!!). Think about a few examples: in QED you can have an explicit fermion mass term without breaking the U(1) gauge symmetry and you don't need to introduce the Higgs. In the Standard Model you do introduce the Higgs, but there is no such thing as "left/right flipping" for the gauge bosons (which also get mass from their coupling to the Higgs). In the MSSM you have explicit, gauge-preserving (but SUSY-breaking) mass terms both for the sfermions and the gauginos, and they don't come from the Higgs. What Bakken writes above is indeed a contribution to the fermion mass from a loop of fermion and scalar, in his generic theory with a scalar-fermion-fermion coupling, and there is no Higgs involved. From the comments above your grasp of QFT appears to be quite tenuous, you should read those books on QFT before arguing with Bakken who clearly knows best. Ptrslv72 (talk) 23:20, 21 October 2010 (UTC)
- Another example off the top of my head: the scattering G0 G0 -> G0 G0 in the SM (where G0 is the neutral would-be Goldstone boson that I was mentioning above) is certainly not a physical process, since it involves unphysical particles in the initial and final state. However, even at tree level you can draw several different diagrams contributing to the amplitude for G0 G0 -> G0 G0. The contribution to the amplitude from an individual diagram (e.g., the one with quartic G0 coupling) is not necessarily zero, but the sum of all the contributions must cancel out. Writing that one of the diagrams represents a physical process would seem incorrect to me. Cheers Ptrslv72 (talk) 11:23, 22 October 2010 (UTC)
- Don't agree, but I have removed "physical", OK? --Michael C. Price talk 11:53, 22 October 2010 (UTC)
- Another example off the top of my head: the scattering G0 G0 -> G0 G0 in the SM (where G0 is the neutral would-be Goldstone boson that I was mentioning above) is certainly not a physical process, since it involves unphysical particles in the initial and final state. However, even at tree level you can draw several different diagrams contributing to the amplitude for G0 G0 -> G0 G0. The contribution to the amplitude from an individual diagram (e.g., the one with quartic G0 coupling) is not necessarily zero, but the sum of all the contributions must cancel out. Writing that one of the diagrams represents a physical process would seem incorrect to me. Cheers Ptrslv72 (talk) 11:23, 22 October 2010 (UTC)
Here is another diagram, which is not a "possible physical process",

Indeed this process is forbidden by energy-momentum conservation. Bakken (talk) 09:21, 22 October 2010 (UTC)I
- A node, not a diagram. Re conservation, isn't that true of all off-shell virtual diagrams? --Michael C. Price talk 10:30, 22 October 2010 (UTC)
(unindent) Michael, we object to meaningless formulations in the leading paragraph of a wikipedia article. Wikipedia defines "process" as a "change in a physical system which is observable using scientific methods". Therefore, if the initial state in a reaction is equal to the final state, there is no observable change in the system. Therefore, according to wikipedia, there was no process. There was an absence of a process. There are plenty of Feynman diagrams, some of them very important, which connect identical initial and final states and therefore do not describe any process. Thus your statement that a Feynman diagram is a process is meaningless and should not be in the lead. Bakken (talk) 09:37, 22 October 2010 (UTC)
- Well then that is a simplistic definition of "process" since some processes can take you back to the start state. --Michael C. Price talk 10:54, 22 October 2010 (UTC)
- It is the wikipedia's definition written by other editors and I fully agree with them. Physics (and science in general) deals only with things which are "observable using scientific methods". In a quantum mechanical reaction, only the initial and the final states are observable. Therefore if they are identical, there is no reaction. The S-matrix is equal unity, the amplitude of the reaction is equal zero. Nothing happened. If you did not observe and change in your system with scientific methods -- that means there was no change. —Preceding unsigned comment added by Bakken (talk • contribs) 11:29, 22 October 2010 (UTC)
Michael, how about such a phrase: "Free lines of a Feynman diagram (colloquially called legs) can represent particles in the initial or final state of a reaction. The Feynman diagram then represents a perturbative contribution the the amplitude of this reaction". What do you want to say, really? Bakken (talk) 10:01, 22 October 2010 (UTC)
- Then we are right back with the problems than others have complained of - namely an incomprehensible lead of no use to a lay-reader. --Michael C. Price talk 10:26, 22 October 2010 (UTC)
- and what if you start a separate article "Feyman diagrams: non-technical introduction"? That's what we did with gauge theory and it seems to have stoped the edit wars. —Preceding unsigned comment added by Bakken (talk • contribs) 10:38, 22 October 2010 (UTC)
- Urgh. Generally such articles are frowned upon, and I gave up on the gauge theory one, as you may recall. Here we are merely talking about a lead paragraph - I don't think that needs an article. The problem here is some editors are simply incapable of understanding what "comprehensible to a lay-reader" means. --Michael C. Price talk 10:54, 22 October 2010 (UTC)
- Well, I guess if your lay-reader is not familiar with the Wick's theorem, there is no way they can understand what a Feynman diagram is. Because a Feynman diagram is a term in the Wick's expansions. That's precisely what it is. Now, how do you explain Wick's theorem in a way, "comprehensible to a lay-reader"? Bakken (talk) 11:47, 22 October 2010 (UTC)
- Urgh. Generally such articles are frowned upon, and I gave up on the gauge theory one, as you may recall. Here we are merely talking about a lead paragraph - I don't think that needs an article. The problem here is some editors are simply incapable of understanding what "comprehensible to a lay-reader" means. --Michael C. Price talk 10:54, 22 October 2010 (UTC)
- and what if you start a separate article "Feyman diagrams: non-technical introduction"? That's what we did with gauge theory and it seems to have stoped the edit wars. —Preceding unsigned comment added by Bakken (talk • contribs) 10:38, 22 October 2010 (UTC)
- How about this: Feynman diagrams is a tool used by physicists to calculate probabilities of reactions between subatomic particles. Bakken (talk) 11:55, 22 October 2010 (UTC)
- ..... see, that wasn't so hard, was it? --Michael C. Price talk 11:58, 22 October 2010 (UTC)
- How about this: Feynman diagrams is a tool used by physicists to calculate probabilities of reactions between subatomic particles. Bakken (talk) 11:55, 22 October 2010 (UTC)
- Ok, I put this one in. Just don't rush! We'll find out a compromise. Bakken (talk) 12:00, 22 October 2010 (UTC)
- Okay, good start. Now a 2nd sentence? --Michael C. Price talk 12:29, 22 October 2010 (UTC)
- The sentence "each diagram representing a possible reaction history" is incorrect and must be changed (or removed). A single diagram can already imply a sum over reaction histories. This is explained e.g. in the already-mentioned chapter 4.4 of Mandl-Shaw for the example of tree-level Compton scattering. The diagram with t-channel exchange of an electron line between an initial electron and an initial photon (with the initial photon turning into the final electron and the initial electron turning into the final photon) already represents the sum of possible histories: all the histories in which the initial electron emits the final photon and later absorbs the initial photon, plus all the histories in which the initial photon turns into an electron-positron pair and later the positron annihilates with the initial electron, creating the final photon. I apologize but now I must really get to work, I'll leave you guys to deal with the task. Cheers Ptrslv72 (talk) 13:01, 22 October 2010 (UTC)
- Okay, good start. Now a 2nd sentence? --Michael C. Price talk 12:29, 22 October 2010 (UTC)
- Ok, I put this one in. Just don't rush! We'll find out a compromise. Bakken (talk) 12:00, 22 October 2010 (UTC)
But your statement "A single diagram can already imply a sum over reaction histories." in no way contradicts "each diagram representing a possible reaction history". As we all know, one single diagram can be expanded in terms of many others. Thanks for the feedback. --Michael C. Price talk 13:51, 22 October 2010 (UTC)
- The sentence in the lead says that each diagram represents a possible reaction history. I gave you an example of one (very well known) diagram that represents two distinct sets of reaction histories, depending on the time ordering of the vertices. It seems to me that the example contradicts the sentence, but perhaps I don't understand what you mean. What exactly are you referring to when you write "one single diagram can be expanded in terms of many others"? Ptrslv72 (talk) 14:44, 22 October 2010 (UTC) 14:43, 22 October 2010 (UTC)
- Charge and mass renormalisation are the obvious examples, but I'm sure you can think of many more. --Michael C. Price talk 19:42, 22 October 2010 (UTC)
- What? Be more explicit, I honestly do not understand what you mean. What exactly do you think charge and mass renormalization have to do with 1) sums over histories and 2) expanding diagrams in terms of many others? And more to the point, why do you think that my example above on Compton scattering does not contradict your statement that each diagram represents a possible "reaction history"? Ptrslv72 (talk) 00:03, 23 October 2010 (UTC)
- Well, it seems your "grasp of QFT appears to be quite tenuous" if you can't visualise renormalisation in terms of diagrams. I've wasted enough time here. And I leave the article for you to obfuscate further. --Michael C. Price talk 00:51, 23 October 2010 (UTC)
- What? Be more explicit, I honestly do not understand what you mean. What exactly do you think charge and mass renormalization have to do with 1) sums over histories and 2) expanding diagrams in terms of many others? And more to the point, why do you think that my example above on Compton scattering does not contradict your statement that each diagram represents a possible "reaction history"? Ptrslv72 (talk) 00:03, 23 October 2010 (UTC)
- Charge and mass renormalisation are the obvious examples, but I'm sure you can think of many more. --Michael C. Price talk 19:42, 22 October 2010 (UTC)
- Having read the entire above discussion (and it wasn't easy) I can say that Price has no idea what he's talking about, he's just spouting words and phrases about things he doesn't understand, while Bakken is 100 percent correct in all details. A Feynman diagram is not a fundamental process, any more than a cosine term in a Fourier series representing a square wave is a "fundamental square wave". A Feynman diagram is a way to organize a perturbation calculation graphically. It is maddening that Wikipedia has so many people with knowledge who are willing to contribute time and effort to making things clear, and they are thwarted by people without basic understanding who have no business being involved, much less acting as authorities. 71.56.118.247 (talk) 11:11, 29 March 2011 (UTC)
- Charge and mass renormalisation can be understood diagramatically, but this graphical representation is not unique. -- cheers, Michael C. Price talk 05:47, 8 April 2011 (UTC)
- Is this meant as an answer to my question of six months ago? The issue was the correctness of your sentence "each diagram represent[s] a possible reaction history", I still don't see how your sentence on charge and mass renormalization relates to it. But it looks like the discussion on the lead has moved on in the meantime. Cheers, Ptrslv72 (talk) 16:51, 21 April 2011 (UTC)
- Charge and mass renormalisation can be understood diagramatically, but this graphical representation is not unique. -- cheers, Michael C. Price talk 05:47, 8 April 2011 (UTC)
- Having read the entire above discussion (and it wasn't easy) I can say that Price has no idea what he's talking about, he's just spouting words and phrases about things he doesn't understand, while Bakken is 100 percent correct in all details. A Feynman diagram is not a fundamental process, any more than a cosine term in a Fourier series representing a square wave is a "fundamental square wave". A Feynman diagram is a way to organize a perturbation calculation graphically. It is maddening that Wikipedia has so many people with knowledge who are willing to contribute time and effort to making things clear, and they are thwarted by people without basic understanding who have no business being involved, much less acting as authorities. 71.56.118.247 (talk) 11:11, 29 March 2011 (UTC)
to visualize processes
Feynman diagrams do not visualize processes. They visualize terms in the perturbative expansion of the S-matrix. Bakken (talk) 20:10, 7 April 2011 (UTC)
- And each term is a possible process. -- cheers, Michael C. Price talk 22:00, 7 April 2011 (UTC)
- No. Bakken (talk) 22:39, 7 April 2011 (UTC)
- Yes, See Britannica. I note we agree that they aid visualisation - so the lead sentence should mention this. -- cheers, Michael C. Price talk 05:37, 8 April 2011 (UTC)
- No. Bakken (talk) 22:39, 7 April 2011 (UTC)
- Feynman diagrams visualize nether processes nor interactions. They visualize specific terms in the Wick's expansion of the amplitude of a quantum process. Bakken (talk) 13:02, 8 April 2011 (UTC)
- There are already words in the lead about "intuitive graphical representation" -- is it not the same idea, as visualization? Bakken (talk) 13:41, 8 April 2011 (UTC)
- And your definition from britannica is actually close to meaningless. Indeed, several tests have shown that there are approximately as many mistakes in britannica as in wikipedia. However, in wikipedia there are people to quickly correct mistakes. Bakken (talk) 13:41, 8 April 2011 (UTC)
- And how does They visualize specific terms in the Wick's expansion of the amplitude of a quantum process. differ from the more compact: They visualize [...] a [...] process. -- cheers, Michael C. Price talk 16:30, 8 April 2011 (UTC)
- Britannica is a terrible source when it comes to the science part of science. Lots of mistakes, at places very unrigourous or lax in language, and usually outdated by at least 20 years. This article should stick to textbooks and similar material for references. As for term vs process, Bakken's wording is definetaly the most accurate. A Feynman diagram represents a term in the Wick expansion of a process. A feynman diagram sort of represents a process if you draw a diagram of the dominant term and let the higher-level terms be "implicit". I suppose it depends on how rigorous you want to be in your use of language, although of the two proposed wordings, I have to say I prefer Bakken's. Headbomb {talk / contribs / physics / books} 07:32, 9 April 2011 (UTC)
- Ahem, Christine Sutton was the writer of the Britannica article. And the issue is clarity, not rigour (which was not proposed to be sacrificed). And clarity in the lead is important - otherwise we end up like the maths articles, namely inaccessible. -- cheers, Michael C. Price talk 07:38, 9 April 2011 (UTC)
- Britannica is a terrible source when it comes to the science part of science. Lots of mistakes, at places very unrigourous or lax in language, and usually outdated by at least 20 years. This article should stick to textbooks and similar material for references. As for term vs process, Bakken's wording is definetaly the most accurate. A Feynman diagram represents a term in the Wick expansion of a process. A feynman diagram sort of represents a process if you draw a diagram of the dominant term and let the higher-level terms be "implicit". I suppose it depends on how rigorous you want to be in your use of language, although of the two proposed wordings, I have to say I prefer Bakken's. Headbomb {talk / contribs / physics / books} 07:32, 9 April 2011 (UTC)
- And how does They visualize specific terms in the Wick's expansion of the amplitude of a quantum process. differ from the more compact: They visualize [...] a [...] process. -- cheers, Michael C. Price talk 16:30, 8 April 2011 (UTC)
- And your definition from britannica is actually close to meaningless. Indeed, several tests have shown that there are approximately as many mistakes in britannica as in wikipedia. However, in wikipedia there are people to quickly correct mistakes. Bakken (talk) 13:41, 8 April 2011 (UTC)
"Expert needed" tag
While I may agree with the "too technical" tag, it seems to me that there are already quite a few experts around...
On a different topic: have a look at the last three sections, Mathematical details, Mathematical interpretation and List. Do they really add significant information to the article? The first two completely lack references, as does the linked article Feynman graph. The last is just a link to a collection of images (which itself should be nominated for deletion). Cheers, Ptrslv72 (talk) 17:29, 21 April 2011 (UTC)
This article is too technical
I could probably explain this in plain English. Should I put the simpler explanation under its own section?--Mrmagikpants (talk) 21:14, 15 June 2012 (UTC)
This article would be fine for someone who already knows quite a lot about physics, and would thus would understand the explanations given, but I have very little physics knowledge and I can't understand the explanations given in this article of exactly what a Feynman diagram is. It would be great if an explanation would be added to the article in layman's terms to explain what one of these things actually is in terms a non-physicist would understand. Would some kind soul with physics knowledge please simplify and/or append a simpler explanation to this article? --NicholasTurnbull 00:03, 28 Dec 2004 (UTC)
- The article is pretty heavy going, the second section Particle-Path Interpretation is a little more accessible. Also, Simple English Wikipedia might help. — PhilHibbs | talk 13:30, 10 June 2009 (UTC)
I think my brain melted ... 63.224.238.238 (talk) 23:58, 31 August 2009 (UTC)
- There's just no way this is an appropriate first sentence for the Description section: "A Feynman diagram represents a perturbative contribution to the amplitude of a quantum transition from some initial quantum state to some final quantum state.". --Doradus (talk) 17:42, 15 September 2009 (UTC)
I heartily agree that this article is too technical and too long. By featuring page after of math, and very few examples of Feynman diagrams, the article has lost sight of Feynman's motivation. He invented his eponymous diagrams to enable us to think through particle physics without having to do the math. Once we have mastered the diagrams, we then do the math to confirm the insights the diagrams suggest. And while Feynman was a superb technical physicist, this article does not do justice to his legacy as a superb teacher and communicator, as it can be understood only by those having done Ph.D. course work in physics. In my opinion, Wikipedia articles should be pitched to bright undergrads, and to the better class of college graduates, but who are not necessarily physics majors. This article goes far beyond that.123.255.31.84 (talk) 17:02, 19 October 2009 (UTC)
- People who are interested in Feyman diagrams are not the same people that are interested in everyday matters. It is a complicated subject and dumbing down is not necessary. You can read and use as much as you can comprehend. I think the language is pretty straightforward. I don't see any use in deleting parts of the article because undergraduates can't comprehend them. In fact not many if not nobody really understands quantummechanics due to its peculiarities that are counter intuitive. Anyway most of the popular books just show the diagrams and keep out the math because formulas are bad for sales. For Wikipedia this should not be a concern. If somebody has an interest in the Feyman diagrams he should be able to find everything about them here. Furthermore the english wikipedia is used by many people from many countries and the english article has to be a reference for the other languages.
- Not the same people? I"m a regular joe, and I am interested in Feynman diagrams. Indeed, they are one of the few aspects of quantum theory that the lay-person does get interested in, because Feynman developed them to be visual rather than mathematical. I suggest that articles should start with the simple and progress to the complex. Opening with a mind-bender sentence like this one shows a lack of consideration for anyone with less education than a PhD. A few sentences is all we're asking for. Im sure Mr Feynman would agree that any science concept can be explained in everyday terms, and Wikipedia is certainly an appropriate place for such explanations. Perhaps someone familliar with his works could look up what he himself said about his diagrams? Surely that would be an appropriate opening? Solviva (talk) 06:11, 14 May 2010 (UTC)
It has to be noted that Feyman diagrams are not meant to honor the didactic skills of mr Feynman as is pointed in the article others have used that kind of diagram before mr Feynman. Viridiflavus (talk) 13:22, 9 November 2009 (UTC)
- Wikipedia's policy on technical articles tells us that technical articles should not be dumbed down. However, it also says that there should be a sentence of two (at a minimum) in the introduction that explains the basic idea of the concept to a laymen (or, in Wikipedia's words, "to put the topic in some broader context"). Currently, that is not happening. I have a fairly decent physics and science background, and I have absolutely no idea what the first sentence in the intro means: "In quantum field theory a Feynman diagram is an intuitive graphical representation of a contribution to the transition amplitude or correlation function of a quantum mechanical or statistical field theory." At the very least, transition amplitude and correlation function should be linked to an article that defines those terms, if one is available. That way, if I am really interested in figuring out what the intro sentence means, I can at least go look up the terms that I'm unfamiliar with. However, even better would be to start off very generally and get more specific as the intro goes on. For instance: A Feynman diagram is a tool used by quantum physicists to create a graphical representation of the interactions between subatomic particles. I think that would be a great first sentence. Then you can follow it up with more specific information about transition amplitudes and correlation functions. SnottyWong talk 01:14, 25 November 2009 (UTC)
This article is not only way too technical, it fails to explain what feynman diagrams are. It doesn't say that time is on one axis, 'space' is on the other axis, what the arrows mean, and what the wavy lines in general mean. It also focusses way too much on the math behind the diagrams -- Feynman diagrams were meant to make physics easier, not harder to understand. Gronkkk (talk) 08:41, 21 October 2011 (UTC)
Could I suggest a temporary solution to the problem: Leave this article as it is, or edit a few words here and there to make it more clear and informative. Start a new article that is an Introduction to Feynman Diagrams. It would be a Feynman Diagrams 101, something like that. Would anyone care to at least try it? I'd like to contribute but I'm not qualified to start the Intro article? Telecomtom (talk) 00:06, 30 December 2011 (UTC)
Chatty modifications to the lead
Am I the only one who finds the chatty tone of the lead (I mean, after the modifications of January 14) unacceptable for an encyclopedic article? I propose to revert to the version of January 13, but I'd like to hear the opinion of other expert editors. Cheers, Ptrslv72 (talk) 10:47, 16 January 2012 (UTC)
- Yes, you are the only one. -- cheers, Michael C. Price talk 11:22, 16 January 2012 (UTC)
- Ha ha, very funny. Care to contribute some useful thought? Ptrslv72 (talk) 11:41, 16 January 2012 (UTC)
- Yes a recent series of edits changed the lede, it has now been reverted to the earlier more encyclopedic version. IRWolfie- (talk) 10:24, 17 January 2012 (UTC)
- Ha ha, very funny. Care to contribute some useful thought? Ptrslv72 (talk) 11:41, 16 January 2012 (UTC)
Merger proposal
There is a somewhat neglected article at Feynman graph which seems to the non-physicist to be an aspect of Feynman diagrams; and (stepping hastily onto firmer ground) is entirely uncited, so its notability as a separate article must be in question. Would it make sense to merge it here, to delete it, or for those with enough knowledge of physics to develop it as a separate article? Chiswick Chap (talk) 15:46, 15 February 2012 (UTC)
- All I can say is that the information presented in the Feynman graph article has very little to do with the actual usage of Feynman diagrams in physics. It appears to be focused on the mathematical interpretation and classification of the diagrams. The complete lack of references makes it impossible to decide whether this information reflects the consensus in the math community or is just the speculation of a single editor. If nobody steps in with proper references, I am in favor of deleting the Feynman graph article altogether. Cheers, Ptrslv72 (talk) 15:37, 29 February 2012 (UTC)
- P.S. for the same reasons, as I already mentioned above, I would remove the sections Mathematical details and Mathematical interpretation of the Feynman diagram article. Ptrslv72 (talk) 15:42, 29 February 2012 (UTC)
- Well, let's get on with that then. I shall delete the two sections and withdraw/close the merger proposal now. And if we're agreed, I shall in due course also redirect Feynman graph to here. Chiswick Chap (talk) 16:15, 29 February 2012 (UTC)
Concerning Section 4.1
Wouldn't this version of Feynman diagram be a better example for electron-positron annihlation? ZFT (talk) 20:01, 5 June 2012 (UTC)
A better explanation of Feynman diagrams
In those conversations i have read a lot of comments and i conclude that there are two categories:
The first contains some really unacceptable ideas , for instance someone said that people who are interested in Feyman diagrams are not the same people that are interested in everyday matters.I believe that knowledge is for every one and everybody must have equal chances and opportunities for learning .Furthermore , as Einstein used to say , if you really have understand something you must be capable of teaching it ,even to your grandmother.
The second one is refered to some correct meaning of Quantum Field Theory , like Wick expantion .Unfortunately these are not sufficient to explain the meaning of Feynman diagrams,we need a combination of them. So i will explain what really Feynman diagrams are in Quantum Field Theory ( as they they play a crusial role in many other subjects),lets start with a short introduction: As you can easily see from the title of Quantum Field Theory ,in this theory there still leave a part of quantum physics. In quantum mechanics, as we have to deal with a statistical physics , we calculate the probability of particles to do something , like going from one orbit to another or what is the propability of finding a particle in a certain state of the atom in which it is bound by. In the same way in Quantum Field Theory , when we deal with scattering processes ( using simultaneously the wave/particle nature of particles ) we calculate the probability ,only in equal time procedures for preserving relativity , of starting with an initial state,lets say electron - positron , and conclude with a final state ,in which we have photon/s (or maybe something else).Or we calculate the probability of starting with an initial state and conclude with the same state. Thus Feynman diagrams are shown us the probability amplitudes of having the above , equal time , procedures.For instance if we want to start with electron - positron scattering and conclude with quark-antiquark , the sum of all Feynman diagrams shows us all the scattering amplitudes i.e. all the possible ways to have this process.What's why in Wiki we can see that the photon becoming a pair of quark-antiquark and then one quark emit a glouon , it is one of the posible ways to have electron-positron scattering. Fotis Koutroulis (talk) Fotis KoutroulisFotis89 (talk) 16:36, 20 February 2013 (UTC)
Antiparticles are shown moving forward in space but backward in time
I added an explanation of this in an attempt to make Feynman diagrams easier to understand. Comments/revisions welcome. David F (talk) 00:37, 15 December 2012 (UTC)
- Thanks, but this is too metaphorical and may mislead readers. You should cite the exact words of a reliable source. Xxanthippe (talk) 00:54, 15 December 2012 (UTC)
- Oops, no metaphor intended. At http://en.wikipedia.org/wiki/Retrocausality#Antimatter: "Feynman, and earlier Stueckelberg, proposed an interpretation of the positron as an electron moving backward in time." David F (talk) 01:26, 15 December 2012 (UTC)
- The key word is "interpretation". Xxanthippe (talk) 01:44, 15 December 2012 (UTC).
- Thanks for the input. I tried again. David F (talk) 02:09, 15 December 2012 (UTC)
- That's better. Xxanthippe (talk) 03:13, 15 December 2012 (UTC).
- Oops, no metaphor intended. At http://en.wikipedia.org/wiki/Retrocausality#Antimatter: "Feynman, and earlier Stueckelberg, proposed an interpretation of the positron as an electron moving backward in time." David F (talk) 01:26, 15 December 2012 (UTC)
- Thanks, but this is too metaphorical and may mislead readers. You should cite the exact words of a reliable source. Xxanthippe (talk) 00:54, 15 December 2012 (UTC)
I just noticed the "that's better" item had been deleted. I put it back, and it immediately got deleted again. Please don't revert stuff that makes the article more understandable to non-experts. David F (talk) 22:18, 12 February 2013 (UTC)
Re-inserted interwiki link Simple English Wikipedia - Feynman Diagrams. David F (talk) 01:04, 11 March 2013 (UTC)
Could use a bit more diagrams
I would think that for an article that devotes to Feynman diagrams, there would be actually more than just four diagrams in this 20-screenful article. While the first 5 sections are related to Feynman diagrams, section 6 deals with the formalism of path-integral formulation and yet is completely devoid of any diagrams, resorting to plain algebra instead, which really undermines the idea of Feynman diagrams being useful. As someone who isn't all that acquainted with using these diagrams, I just think it would be really nice if an expert in this area can add a couple more diagrams to demonstrate why it's useful, especially in section 6, and perhaps show some of the basic rules of manipulating Feynman diagrams (using Feynman diagrams, not algebra!). That should also help bring down the technicality of this article somewhat so it's easier for students who have a basic understanding of QM to understand what's going on. --Freiddie (talk) 20:52, 19 February 2013 (UTC)
- Indeed a valid (and obivous) point. In time I'll see what I can do, may be a while though... M∧Ŝc2ħεИτlk 16:38, 20 February 2013 (UTC)
- I can draw lots of specific diagrams for various processes involving numerous particles. But first, here is one which shows what the vertices and internal/external lines actually mean, according to the "DeMystified" books QFT (2008, McMahon):
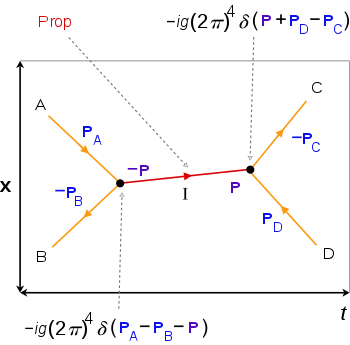
General features of the scattering process A + B → C + D: • internal lines (red) for intermediate particles and processes, which has a propagator factor ("prop"), external lines (orange) for incoming/outgoing particles to/from vertices (black),
• at each vertex there is 4-momentum conservation using delta functions, 4-momenta entering the vertex are positive while those leaving are negative, the factors at each vertex and internal line are multiplied in the amplitude integral,
• space x and time t axes are not always shown, directions of external lines correspond to passage of time.

- Any good? M∧Ŝc2ħεИτlk 22:12, 1 April 2013 (UTC)
- That's pretty neat -- it could go somewhere in the "Description" section perhaps?
- Unfortunately the article is not very consistent about the axes for time vs space though, and every diagram is drawn by a different author in a different style it seems. — Preceding unsigned comment added by Freiddie (talk • contribs) 23:11, 25 April 2013 (UTC)
- Thanks for feedback. I agree the inconsistency of spacetime axes within an (this WP) article can be a bit irritating, but it's not really a problem either. Perhaps showing that there are multiple ways of positioning the axes is a benefit to illustrate this is done in practice.
- Given that I posted this here ages ago and no one responded, I'll add it the the article. Anyone who has a problem and deletes it can explain here. For the record I also posted this at WP physics and only one person (YohanN7) gave feedback, not all I completely understood or have come around to implementing the suggestions, but nevertheless will in time hopefully. M∧Ŝc2ħεИτlk 20:21, 23 May 2013 (UTC)
Don't mention the amplituhedron
The mention of the amplituhedron in the introduction is far too prominent. For one thing this work has been described only in talks and has not yet appeared in written form, but more importantly the machinery is ONLY applicable to a very specific quantum field theory (N=4 SYM), and only in a particular approximation (large number of colors). There is no evidence whatsoever that it will be useful in studying any other theory, or even this theory without that approximation, and mentioning it in an article on a topic as venerable as Feynman diagrams is completely out of place. I have removed it. — Preceding unsigned comment added by 128.112.84.101 (talk) 23:57, 2 October 2013 (UTC)
- I agree with the above and will oppose inclusion of this promotionalist material until it has been published in refereed journals, assessed by the community and cited. Xxanthippe (talk) 00:04, 3 October 2013 (UTC).
Inclusion of the amplituhedron technique
I notice that there has been a dispute about inclusion of the new amplituhedron work into this article. I worked a bit on the Amplituhedron article when it came out. The topic is interesting in that there are popular accounts of the results and reception, but none of the papers about the technique itself are yet published. The paragraph proposed by Paul venter is based on the reference Arxiv 1212.5605. This paper has been submitted to Arxiv, but has not yet been published in a peer-reviewed journal. While Arxiv does filter out crank papers, as far as I know, WP editor consensus has never been to consider Arxiv as a reliable source. Without a reliable source for the physics itself, I don't think the amplituhedron blurb is verifiable in reliable sources. For now I recommend deleting the amplituhedron blurb with option to revisit when these techniques have been published and there are reliable sources. --Mark viking (talk) 03:49, 12 October 2013 (UTC)
- There has never been agreement among WP editors about the reliability of sources and it has been acknowledged that no source is completely reliable or unreliable. Consequently using one's common sense about contentious sources is still a reasonable option. By this time it should be apparent to anyone interested in Feynman diagrams that there is a development termed amplituhedron and that it materially reduces the computational work. Thus the link between the two concepts is not fallacious. To ignore the link and insist on a peer-reviewed article to be published, leaves a large logical gap in the article that may take years before it is corrected. I'm certain that by now more 'authoritative' articles have been published, but until someone locates and cites these I feel that my contribution, flawed as some editors may think it, should stand. Paul venter (talk) 07:41, 12 October 2013 (UTC)
- I'm against mentioning this in the lead, I'm not per se against saying something about it later in the article. The method has been reviewed rigorously by top physicists, so publication in a peer reviewed journal for this particular case is irrelevant. What matters a lot more is the relevance, the way you present and explain the method in this article. So, if we want to say that there exists a new technique that allows one to sum over a large number of Feynman diagrams of certain types of processes, then that can in principle be mentioned, but in a section later on in this article where one should also discuss other mathematical techniques such as this one. Count Iblis (talk) 16:42, 12 October 2013 (UTC)
- In case people are interested, there is this discussion on arXiv papers.
- As the amplituhedron is theoretical, we definitely need peer-reviewed published articles to support the inclusion. WP:VERIFIABILITY is more important than the heartfelt opinions that it "should" be in WP. M∧Ŝc2ħεИτlk 08:58, 13 October 2013 (UTC)
- This whole arXiv thing is the mother of all red herrings here, it easily satisfies verifiability as it already has been extensively reviewed, a lot more than most peer reviewed papers ever get due to its high profile nature. It already has 47 citations, with some of the citing articles already having been published. This clearly indicates the rigorous level of review this paper already has had. Count Iblis (talk) 14:46, 13 October 2013 (UTC)
- To further my opinion, it matches yours Count Iblis: don't mention the amplituhedron in the lead, but have a section somewhere titled "Other mathematical techniques" (or words to that effect) which mention the amplituhedron, Hopf algebra etc. Does this make everyone happy? M∧Ŝc2ħεИτlk 14:53, 13 October 2013 (UTC)
- Yes, and that would also force editors to focus on the technical aspects of this which has been reviewed extensively. What you do not want here is the hype about this method, as that is only published in the unreliable media (blogs etc.). Count Iblis (talk) 15:08, 13 October 2013 (UTC)
- To further my opinion, it matches yours Count Iblis: don't mention the amplituhedron in the lead, but have a section somewhere titled "Other mathematical techniques" (or words to that effect) which mention the amplituhedron, Hopf algebra etc. Does this make everyone happy? M∧Ŝc2ħεИτlk 14:53, 13 October 2013 (UTC)
There are several misunderstandings here. First of all the paper which is cited is about the positive grassmanian, which is NOT the amplituhedron. They are related, but no paper has appeared yet describing the amplituhedron, not even on the arxiv. It has appeared ONLY in talks. So the citation is wrong, and the discussion here of whether or not papers on the arxiv should be taken as sources is irrelevant. In fact I don't think there is any serious doubt on the technical validity of the amplituhedron, but even assuming it is correct I do not think it merits inclusion in the opening of an article on Feynman diagrams. It is a technical device that simplifies SOME aspects of perturbative calculations in SOME quantum field theories. It is hardly alone in this category, there are many other examples, some of which allow computation of more things in the theories they work for than the amplituhedron does in N=4 SYM. — Preceding unsigned comment added by 128.112.84.101 (talk) 17:04, 20 October 2013 (UTC)
- I have removed the section from the lede until the situation is clarified. Xxanthippe (talk) 21:47, 20 October 2013 (UTC).
Representation of physical reality
This section is VERY mislwading or in any case very LACKING.
It states that " Gerard 't Hooft and Martinus Veltman gave good arguments for taking the original, non-regularized Feynman diagrams as the most succinct representation of our present knowledge about the physic" but what are these 'good arguments'?
The quote ""The Feynman graphs and rules of calculation summarize quantum field theory in a form in close contact with the experimental numbers one wants to understand. Although the statement of the theory in terms of graphs may imply perturbation theory, use of graphical methods in the many-body problem shows that this formalism is flexible enough to deal with phenomena of nonperturbative characters ..."" does NOT at all argue for 'physical reality' (not as it is now, maybe it is more clear in context) but rather that Feynmann diagrams are a good visualization of the MATH behind QFT rather than the actual 'physical reality'. — Preceding unsigned comment added by 131.175.161.14 (talk) 13:01, 28 February 2014 (UTC)