This is a complete list of the U.S. states, its federal district and its major territories ordered by total area, land area and water area.[1] The water area includes inland waters, coastal waters, the Great Lakes and territorial waters. Glaciers and intermittent bodies of water are counted as land area.[2]
Area by state, federal district or territory edit
| State / territory | Total area | Land area | Water area | ||||
|---|---|---|---|---|---|---|---|
| mi2 | km2 | mi2 | km2 | mi2 | km2 | % | |
| 665,384 | 1,723,337 | 570,641 | 1,477,953 | 94,743 | 245,383 | 14.2% | |
| 268,596 | 695,662 | 261,232 | 676,587 | 7,365 | 19,075 | 2.7% | |
| 163,695 | 423,967 | 155,779 | 403,466 | 7,916 | 20,501 | 4.8% | |
| 147,040 | 380,831 | 145,546 | 376,962 | 1,494 | 3,869 | 1.0% | |
| 121,590 | 314,917 | 121,298 | 314,161 | 292 | 757 | 0.2% | |
| 113,990 | 295,234 | 113,594 | 294,207 | 396 | 1,026 | 0.3% | |
| 110,572 | 286,380 | 109,781 | 284,332 | 791 | 2,048 | 0.7% | |
| 104,094 | 269,601 | 103,642 | 268,431 | 452 | 1,170 | 0.4% | |
| 98,379 | 254,799 | 95,988 | 248,608 | 2,391 | 6,191 | 2.4% | |
| 97,813 | 253,335 | 97,093 | 251,470 | 720 | 1,864 | 0.7% | |
| 96,714 | 250,487 | 56,539 | 146,435 | 40,175 | 104,052 | 41.5% | |
| 86,936 | 225,163 | 79,627 | 206,232 | 7,309 | 18,930 | 8.4% | |
| 84,897 | 219,882 | 82,170 | 212,818 | 2,727 | 7,064 | 3.2% | |
| 83,569 | 216,443 | 82,643 | 214,045 | 926 | 2,398 | 1.1% | |
| 82,278 | 213,100 | 81,759 | 211,754 | 520 | 1,346 | 0.6% | |
| 77,348 | 200,330 | 76,824 | 198,974 | 524 | 1,356 | 0.7% | |
| 77,116 | 199,729 | 75,811 | 196,350 | 1,305 | 3,379 | 1.7% | |
| 71,298 | 184,661 | 66,456 | 172,119 | 4,842 | 12,542 | 6.8% | |
| 70,698 | 183,108 | 69,001 | 178,711 | 1,698 | 4,397 | 2.4% | |
| 69,899 | 181,037 | 68,595 | 177,660 | 1,304 | 3,377 | 1.9% | |
| 69,707 | 180,540 | 68,742 | 178,040 | 965 | 2,501 | 1.4% | |
| 65,758 | 170,312 | 53,625 | 138,887 | 12,133 | 31,424 | 18.5% | |
| 65,496 | 169,635 | 54,158 | 140,268 | 11,339 | 29,367 | 17.3% | |
| 59,425 | 153,910 | 57,513 | 148,959 | 1,912 | 4,951 | 3.2% | |
| 57,914 | 149,995 | 55,519 | 143,793 | 2,395 | 6,202 | 4.1% | |
| 56,273 | 145,746 | 55,857 | 144,669 | 416 | 1,077 | 0.7% | |
| 54,555 | 141,297 | 47,126 | 122,057 | 7,429 | 19,240 | 13.6% | |
| 53,819 | 139,391 | 48,618 | 125,920 | 5,201 | 13,471 | 9.7% | |
| 53,179 | 137,732 | 52,035 | 134,771 | 1,143 | 2,961 | 2.1% | |
| 52,420 | 135,767 | 50,645 | 131,171 | 1,775 | 4,597 | 3.4% | |
| 52,378 | 135,659 | 43,204 | 111,898 | 9,174 | 23,761 | 17.5% | |
| 48,432 | 125,438 | 46,923 | 121,531 | 1,509 | 3,907 | 3.1% | |
| 46,054 | 119,280 | 44,743 | 115,883 | 1,312 | 3,397 | 2.8% | |
| 44,826 | 116,098 | 40,861 | 105,829 | 3,965 | 10,269 | 8.8% | |
| 42,775 | 110,787 | 39,490 | 102,279 | 3,285 | 8,508 | 7.7% | |
| 42,144 | 109,153 | 41,235 | 106,798 | 909 | 2,355 | 2.2% | |
| 40,408 | 104,656 | 39,486 | 102,269 | 921 | 2,387 | 2.3% | |
| 36,420 | 94,326 | 35,826 | 92,789 | 593 | 1,537 | 1.6% | |
| 35,380 | 91,633 | 30,843 | 79,883 | 4,537 | 11,750 | 12.8% | |
| 32,020 | 82,933 | 30,061 | 77,857 | 1,960 | 5,076 | 6.1% | |
| 24,230 | 62,756 | 24,038 | 62,259 | 192 | 497 | 0.8% | |
| 12,406 | 32,131 | 9,707 | 25,142 | 2,699 | 6,990 | 21.8% | |
| 10,932 | 28,313 | 6,423 | 16,635 | 4,509 | 11,678 | 41.2% | |
| 10,554 | 27,336 | 7,800 | 20,202 | 2,754 | 7,134 | 26.1% | |
| 9,616 | 24,906 | 9,217 | 23,871 | 400 | 1,035 | 4.2% | |
| 9,349 | 24,214 | 8,953 | 23,187 | 397 | 1,027 | 4.2% | |
| 8,723 | 22,591 | 7,354 | 19,047 | 1,368 | 3,544 | 15.7% | |
| 5,543 | 14,357 | 4,842 | 12,542 | 701 | 1,816 | 12.6% | |
| 5,325 | 13,791 | 3,424 | 8,868 | 1,901 | 4,924 | 35.7% | |
| 2,489 | 6,446 | 1,949 | 5,047 | 540 | 1,399 | 21.7% | |
| 1,976 | 5,117 | 182 | 472 | 1,793 | 4,644 | 90.7% | |
| 1,545 | 4,001 | 1,034 | 2,678 | 511 | 1,324 | 33.1% | |
| 733 | 1,898 | 134 | 348 | 599 | 1,550 | 81.7% | |
| 581 | 1,505 | 76 | 198 | 505 | 1,307 | 86.9% | |
| 571 | 1,478 | 210 | 543 | 361 | 935 | 63.2% | |
| 68 | 177 | 61 | 158 | 7 | 19 | 10.3% | |
| Minor Outlying Islands[3][a] | 16 | 41 | 16 | 41 | 0 | 0 | 0.0% |
| Contiguous US | 3,120,428 | 8,081,869 | 2,954,843 | 7,653,006 | 165,589 | 428,865 | 5.3% |
| 50 States | 3,796,676 | 9,833,342 | 3,531,846 | 9,147,436 | 264,834 | 685,907 | 7.0% |
| 50 States and DC | 3,796,744 | 9,833,519 | 3,531,907 | 9,147,594 | 264,841 | 685,926 | 7.0% |
| United States | 3,805,927 | 9,857,306 | 3,535,932 | 9,158,022 | 269,995 | 699,284 | 7.1% |
-
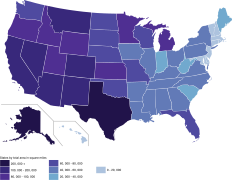 U.S. states by total area
 -
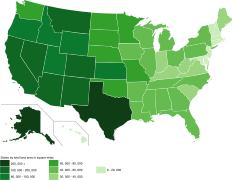 U.S. states by land area
 -
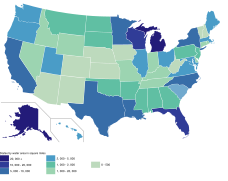 U.S. states by water area
 -
 U.S. states by water percentage
 -
![Alaska is the largest state by total area, land area, and water area. It is the seventh-largest country subdivision in the world.[5][failed verification]](//upload.wikimedia.org/wikipedia/commons/thumb/8/8c/Map_of_USA_AK_full.png/278px-Map_of_USA_AK_full.png) Alaska is the largest state by total area, land area, and water area. It is the seventh-largest country subdivision in the world.[5][failed verification]
Alaska is the largest state by total area, land area, and water area. It is the seventh-largest country subdivision in the world.[5][failed verification] -
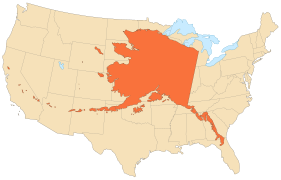 The area of Alaska is 18% of the area of the United States and equivalent to 21% of the area of the contiguous United States.
 -
 The second largest state, Texas, has only 40% of the total area of the largest state, Alaska.
 -
 Rhode Island is the smallest state by total area and land area.
 -
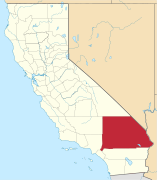 San Bernardino County is the largest county in the contiguous U.S. and is larger than each of the nine smallest states; it is larger than the four smallest states combined.
 -
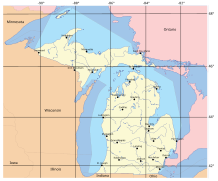 Michigan is second (after Alaska) in water area, and first in water percentage.
 -
 Florida is mostly a peninsula, and has the third-largest water area and seventh-largest water area percentage.


![Alaska is the largest state by total area, land area, and water area. It is the seventh-largest country subdivision in the world.[5][failed verification]](/wiki/File:Map_of_USA_AK_full.png)


_(extra_close).svg)


See also edit
Notes edit
References edit
- ^ "State Area Measurements and Internal Point Coordinates". census.gov. 2010. Retrieved December 2, 2023.
- ^ "Census 2000 Geographic Terms and Concepts", Census 2000 Geography Glossary, U.S. Census Bureau. Retrieved July 10, 2007.
- ^ "United States Summary: 2000, Population and Housing Unit Counts" (PDF). United States Census Bureau. April 2004. p. 1 (Table 1). Archived from the original (PDF) on February 3, 2017. Retrieved December 28, 2023.
- ^ "United States Summary: 2010, Population and Housing Unit Counts" (PDF). United States Census Bureau. September 2012. pp. V–2, 1 & 41 (Tables 1 & 18). Retrieved February 7, 2014.
- ^ "World Factbook Country Comparison: Area". The World Factbook. CIA. Archived from the original on August 4, 2018. Retrieved August 1, 2018.