Graphic Representations of United States Presidential Election Opinion Polls, 2008

edit
Barack Obama
John McCain

{{future election in the United States}}

This article provides line graphs and bar charts of scientific, nation-wide public opinion polls that have been conducted relating to the United States presidential election, 2008. All graph data is taken from Nationwide opinion polling for the United States presidential election, 2008. This page was last updated on October 8, 2008.

Obama v. McCain

edit

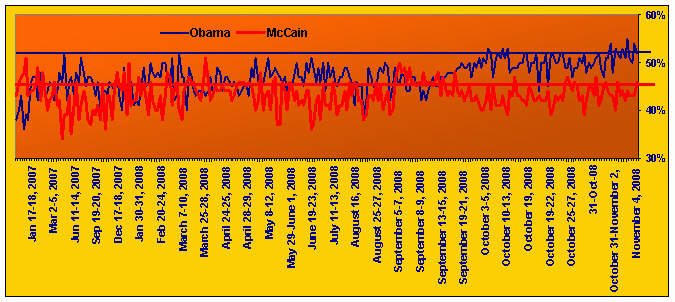
This shows the results of all polls from November 6, 2006 through October 5, 2008.
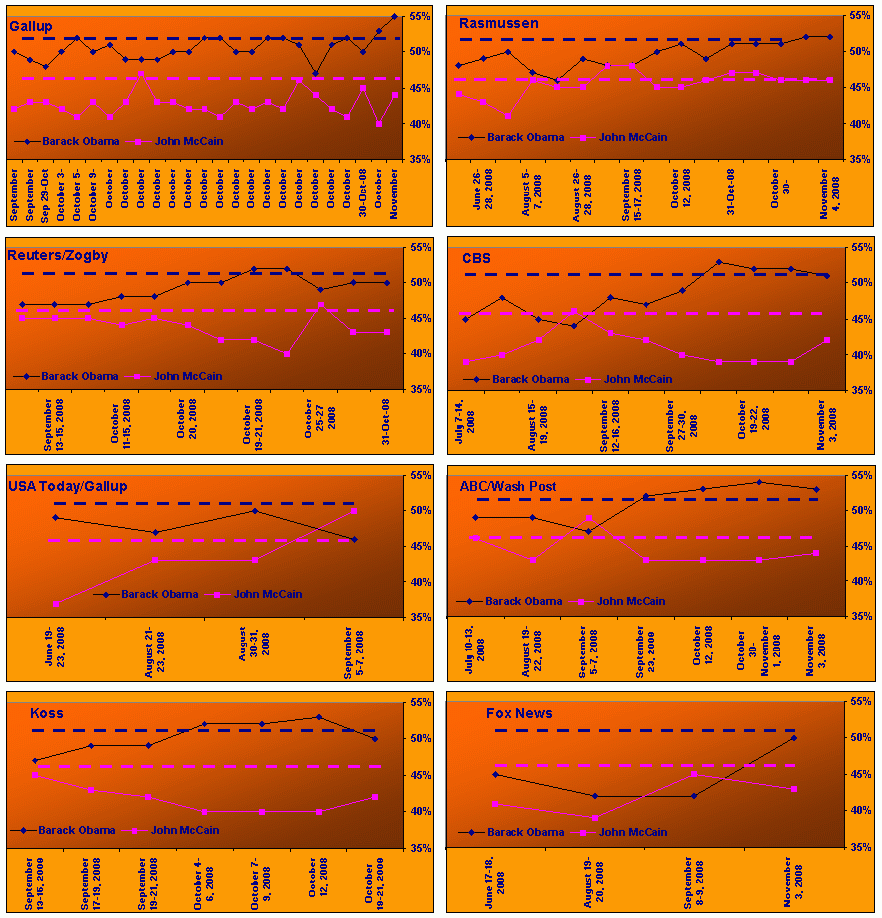
Obama v. McCain by individual polster

edit

With the election less than a month away, a closer look is needed to better see the ebb and flow from

day to day. Since each pollster may have a different set of parameters, it is useful to look at line

graphs of a number of them on one page to better discern trends.
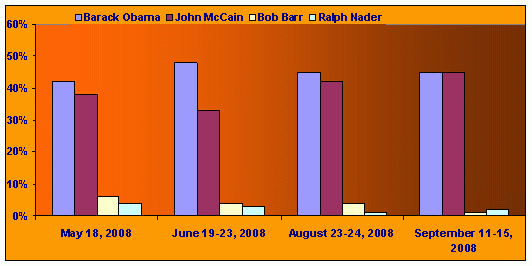
Obama v. McCain v. Barr v. Nader

edit

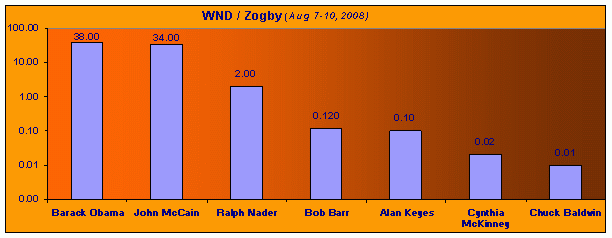
Seven Way Race

edit

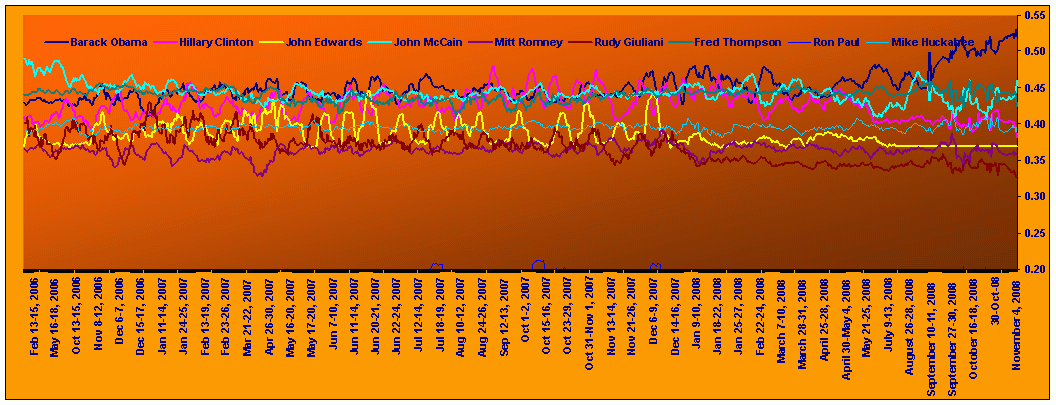
Line graph, all candidates

edit

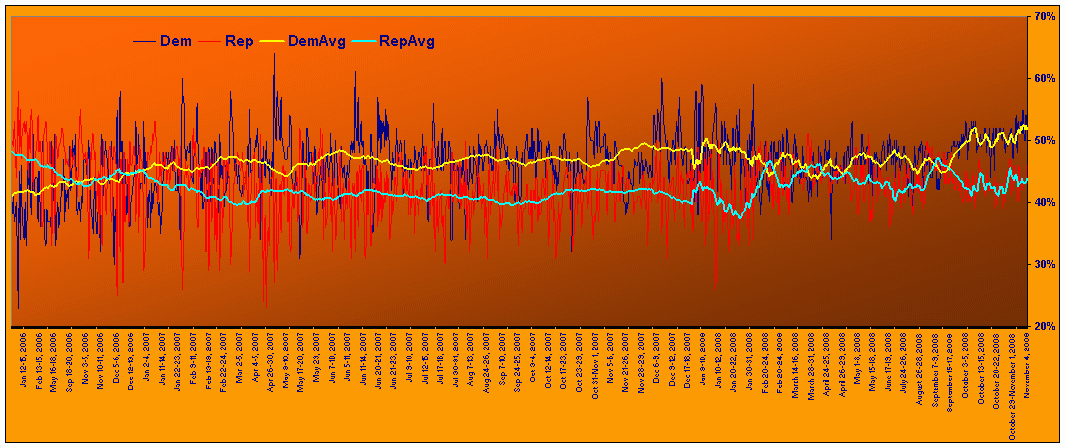
Democrats v. Republicans

edit

Scatter Chart, all candidates

edit

One-on-One, all candidates

edit

Line graphs including Other Candidates from earlier Polls

edit

Obama v. Giuliani

edit

Obama v Giuliani

Obama v. Huckabee

edit

Obama v Huckabee

Obama v. Romney

edit

Obama v Romney

Obama v. Thompson

edit

Obama v Thompson

Hillary v. Condoleeza

edit

Hillary v Condo

Hillary v. Giuliani

edit

Hillary v Giuliani

Hillary v. Huckabee

edit

Hillary v Huckabee

Hillary v. Jeb Bush

edit

Hillary v Jeb Bush

Hillary v. Romney

edit

Hillary v Romney

Hillary v. Thompson

edit

Hillary v Thompson

Edwards v. Huckabee

edit

Edwards v Huckabee

Edwards v. Giuliani

edit

Edwards v Giuliani

Edwards v. Romney

edit

Edwards v Romney

Edwards v. Thompson

edit

Edwards v Thompson

Gore v. Giuliani

edit

Gore v Giuliani

Gore v. McCain

edit

Gore v McCain

Candidates v. all Opponents

edit

Obama Composite

McCain Composite

Hillary Composite

Gore Composite

Giuliani Composite