
| election_name = 2000 United States presidential election
| country = United States
| flag_year = 1960
| type = presidential
| previous_election = 1996 United States presidential election
| previous_year = 1996
| election_date = November 7, 2000
| next_election = 2004 United States presidential election
| next_year = 2004
| votes_for_election = 538 members of the Electoral College
| needed_votes = 270 electoral
| turnout = 51.2% ![]() 2.2 pp
| image_size = x200px
2.2 pp
| image_size = x200px
| image1 = GeorgeWBush.jpg | nominee1 = George W. Bush | color1 = | party1 = Republican Party (United States) | home_state1 = Texas | running_mate1 = Dick Cheney | electoral_vote1 = 271 | states_carried1 = 30 | popular_vote1 = 50,456,002 | percentage1 = 47.9%
| image2 = Al Gore, Vice President of the United States, official portrait 1994.jpg | nominee2 = Al Gore | color2 = | party2 = Democratic Party (United States) | home_state2 = Tennessee | running_mate2 = Joe Lieberman | electoral_vote2 = 267 | states_carried2 = 20 + DC | popular_vote2 = 50,999,897 | percentage2 = 48.4%
| map_size = 350px | map =
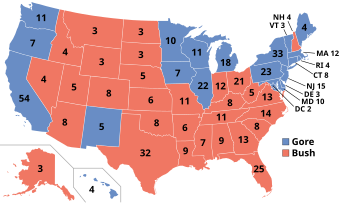
| map_caption = Presidential election results map. Red denotes states won by Bush/Cheney and blue denotes those won by Gore/Lieberman. One of D.C.'s three electors abstained from casting a vote for president or vice president. Numbers indicate electoral votes cast by each state and the District of Columbia.
| title = President | before_election = Bill Clinton | before_party = Democratic Party (United States) | after_election = George W. Bush