A spectrogram is a visual representation of the spectrum of frequencies of a signal as it varies with time. When applied to an audio signal, spectrograms are sometimes called sonographs, voiceprints, or voicegrams. When the data are represented in a 3D plot they may be called waterfall displays.


Spectrograms are used extensively in the fields of music, linguistics, sonar, radar, speech processing,[1] seismology, ornithology, and others. Spectrograms of audio can be used to identify spoken words phonetically, and to analyse the various calls of animals.
A spectrogram can be generated by an optical spectrometer, a bank of band-pass filters, by Fourier transform or by a wavelet transform (in which case it is also known as a scaleogram or scalogram).[2]

A spectrogram is usually depicted as a heat map, i.e., as an image with the intensity shown by varying the colour or brightness.
Format edit
A common format is a graph with two geometric dimensions: one axis represents time, and the other axis represents frequency; a third dimension indicating the amplitude of a particular frequency at a particular time is represented by the intensity or color of each point in the image.
There are many variations of format: sometimes the vertical and horizontal axes are switched, so time runs up and down; sometimes as a waterfall plot where the amplitude is represented by height of a 3D surface instead of color or intensity. The frequency and amplitude axes can be either linear or logarithmic, depending on what the graph is being used for. Audio would usually be represented with a logarithmic amplitude axis (probably in decibels, or dB), and frequency would be linear to emphasize harmonic relationships, or logarithmic to emphasize musical, tonal relationships.
-
 Spectrogram of this recording of a violin playing. Note the harmonics occurring at whole-number multiples of the fundamental frequency.
 -
 3D surface spectrogram of a part from a music piece.
 -
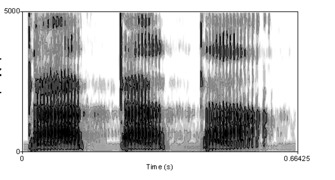 Spectrogram of a male voice saying 'ta ta ta'.
 -
 Spectrogram of dolphin vocalizations; chirps, clicks and harmonizing are visible as inverted Vs, vertical lines and horizontal striations respectively.
 -
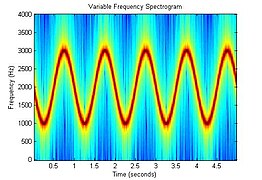 Spectrogram of an FM signal. In this case the signal frequency is modulated with a sinusoidal frequency vs. time profile.
 -
 Spectrum above and waterfall (Spectrogram) below of an 8MHz wide PAL-I Television signal.
 -
 Spectrogram of great tit song.
 -
 Constant-Q spectrogram of a gravitational wave (GW170817).
 -
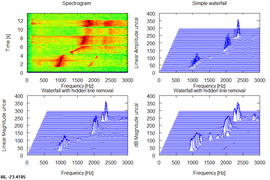 Spectrogram and waterfalls of 3 whistled notes.
 -
 Spectrogram of the soundscape ecology of Mount Rainier National Park, with the sounds of different creatures and aircraft highlighted
 -
 Spectrogram (generated with the freeware Sonogram visible Speech).
 -
 Variable-Q transform spectrogram of a piano chord (generated using FFmpeg's showcqt filter).


Generation edit
Spectrograms of light may be created directly using an optical spectrometer over time.
Spectrograms may be created from a time-domain signal in one of two ways: approximated as a filterbank that results from a series of band-pass filters (this was the only way before the advent of modern digital signal processing), or calculated from the time signal using the Fourier transform. These two methods actually form two different time–frequency representations, but are equivalent under some conditions.
The bandpass filters method usually uses analog processing to divide the input signal into frequency bands; the magnitude of each filter's output controls a transducer that records the spectrogram as an image on paper.[3]
Creating a spectrogram using the FFT is a digital process. Digitally sampled data, in the time domain, is broken up into chunks, which usually overlap, and Fourier transformed to calculate the magnitude of the frequency spectrum for each chunk. Each chunk then corresponds to a vertical line in the image; a measurement of magnitude versus frequency for a specific moment in time (the midpoint of the chunk). These spectrums or time plots are then "laid side by side" to form the image or a three-dimensional surface,[4] or slightly overlapped in various ways, i.e. windowing. This process essentially corresponds to computing the squared magnitude of the short-time Fourier transform (STFT) of the signal — that is, for a window width , .[5]


Limitations and resynthesis edit
From the formula above, it appears that a spectrogram contains no information about the exact, or even approximate, phase of the signal that it represents. For this reason, it is not possible to reverse the process and generate a copy of the original signal from a spectrogram, though in situations where the exact initial phase is unimportant it may be possible to generate a useful approximation of the original signal. The Analysis & Resynthesis Sound Spectrograph[6] is an example of a computer program that attempts to do this. The Pattern Playback was an early speech synthesizer, designed at Haskins Laboratories in the late 1940s, that converted pictures of the acoustic patterns of speech (spectrograms) back into sound.
In fact, there is some phase information in the spectrogram, but it appears in another form, as time delay (or group delay) which is the dual of the instantaneous frequency.[7]
The size and shape of the analysis window can be varied. A smaller (shorter) window will produce more accurate results in timing, at the expense of precision of frequency representation. A larger (longer) window will provide a more precise frequency representation, at the expense of precision in timing representation. This is an instance of the Heisenberg uncertainty principle, that the product of the precision in two conjugate variables is greater than or equal to a constant (B*T>=1 in the usual notation).[8]
Applications edit
- Early analog spectrograms were applied to a wide range of areas including the study of bird calls (such as that of the great tit), with current research continuing using modern digital equipment[9] and applied to all animal sounds. Contemporary use of the digital spectrogram is especially useful for studying frequency modulation (FM) in animal calls. Specifically, the distinguishing characteristics of FM chirps, broadband clicks, and social harmonizing are most easily visualized with the spectrogram.
- Spectrograms are useful in assisting in overcoming speech deficits and in speech training for the portion of the population that is profoundly deaf[10]
- The studies of phonetics and speech synthesis are often facilitated through the use of spectrograms.[11][12]
- In deep learning-keyed speech synthesis, spectrogram (or spectrogram in mel scale) is first predicted by a seq2seq model, then the spectrogram is fed to a neural vocoder to derive the synthesized raw waveform.
- By reversing the process of producing a spectrogram, it is possible to create a signal whose spectrogram is an arbitrary image. This technique can be used to hide a picture in a piece of audio and has been employed by several electronic music artists.[13] See also steganography.
- Some modern music is created using spectrograms as an intermediate medium; changing the intensity of different frequencies over time, or even creating new ones, by drawing them and then inverse transforming. See Audio timescale-pitch modification and Phase vocoder.
- Spectrograms can be used to analyze the results of passing a test signal through a signal processor such as a filter in order to check its performance.[14]
- High definition spectrograms are used in the development of RF and microwave systems[15]
- Spectrograms are now used to display scattering parameters measured with vector network analyzers[16]
- The US Geological Survey and the IRIS Consortium provide near real-time spectrogram displays for monitoring seismic stations[17][18]
- Spectrograms can be used with recurrent neural networks for speech recognition.[19][20]
- Individuals' spectrograms are collected by the Chinese government as part of its mass surveillance programs.[21]
- For a vibration signal, a spectrogram’s color scale identifies the frequencies of a waveform’s amplitude peaks over time. Unlike a time or frequency graph, a spectrogram correlates peak values to time and frequency. Vibration test engineers use spectrograms to analyze the frequency content of a continuous waveform, locating strong signals and determining how the vibration behavior changes over time. [22]
- Spectrograms can be used to analyze speech in two different applications: automatic detection of speech deficits in cochlear implant users and phoneme class recognition to extract phone-attribute features. [23]
- In order to obtain a speaker's pronunciation characteristics, some researchers proposed a method based on an idea from bionics, which uses spectrogram statistics to achieve a characteristic spectrogram to give a stable representation of the speakers' pronunciation from a linear superposition of short-time spectrograms.[24]
- Researchers explore a novel approach to ECG signal analysis by leveraging spectrogram techniques, possibly for enhanced visualization and understanding. The integration of MFCC for feature extraction suggests a cross-disciplinary application, borrowing methods from audio processing to extract relevant information from biomedical signals.[25]
- Accurate interpretation of temperature indicating paint (TIP) is of great importance in aviation and other industrial applications. 2D spectrogram of TIP can be used in temperature interpretation. [26]
- The spectrogram can be used to process the signal for the rate of change of the human thorax. By visualizing respiratory signals using a spectrogram, the researchers have proposed an approach to the classification of respiration states based on a neural network model. [27]
See also edit
- Acoustic signature
- Chromagram
- Fourier analysis for computing periodicity in evenly spaced data
- Generalized spectrogram
- Least-squares spectral analysis for computing periodicity in unevenly spaced data
- List of unexplained sounds
- Reassignment method
- Spectral music
- Spectrometer
- Strobe tuner
- Waveform
References edit
- ^ JL Flanagan, Speech Analysis, Synthesis and Perception, Springer- Verlag, New York, 1972
- ^ Sejdic, E.; Djurovic, I.; Stankovic, L. (August 2008). "Quantitative Performance Analysis of Scalogram as Instantaneous Frequency Estimator". IEEE Transactions on Signal Processing. 56 (8): 3837–3845. Bibcode:2008ITSP...56.3837S. doi:10.1109/TSP.2008.924856. ISSN 1053-587X. S2CID 16396084.
- ^ "Spectrograph". www.sfu.ca. Retrieved 7 April 2018.
- ^ "Spectrograms". ccrma.stanford.edu. Retrieved 7 April 2018.
- ^ "STFT Spectrograms VI – NI LabVIEW 8.6 Help". zone.ni.com. Retrieved 7 April 2018.
- ^ "The Analysis & Resynthesis Sound Spectrograph". arss.sourceforge.net. Retrieved 7 April 2018.
- ^ Boashash, B. (1992). "Estimating and interpreting the instantaneous frequency of a signal. I. Fundamentals". Proceedings of the IEEE. 80 (4). Institute of Electrical and Electronics Engineers (IEEE): 520–538. doi:10.1109/5.135376. ISSN 0018-9219.
- ^ "Heisenberg Uncertainty Principle". Archived from the original on 2019-01-25. Retrieved 2019-02-05.
- ^ "BIRD SONGS AND CALLS WITH SPECTROGRAMS ( SONOGRAMS ) OF SOUTHERN TUSCANY ( Toscana – Italy )". www.birdsongs.it. Retrieved 7 April 2018.
- ^ Saunders, Frank A.; Hill, William A.; Franklin, Barbara (1 December 1981). "A wearable tactile sensory aid for profoundly deaf children". Journal of Medical Systems. 5 (4): 265–270. doi:10.1007/BF02222144. PMID 7320662. S2CID 26620843.
- ^ "Spectrogram Reading". ogi.edu. Archived from the original on 27 April 1999. Retrieved 7 April 2018.
- ^ "Praat: doing Phonetics by Computer". www.fon.hum.uva.nl. Retrieved 7 April 2018.
- ^ "The Aphex Face – bastwood". www.bastwood.com. Retrieved 7 April 2018.
- ^ "SRC Comparisons". src.infinitewave.ca. Retrieved 7 April 2018.
- ^ "constantwave.com – constantwave Resources and Information". www.constantwave.com. Retrieved 7 April 2018.
- ^ "Spectrograms for vector network analyzers". Archived from the original on 2012-08-10.
- ^ "Real-time Spectrogram Displays". earthquake.usgs.gov. Retrieved 7 April 2018.
- ^ "IRIS: MUSTANG: Noise-Spectrogram: Docs: v. 1: Help".
- ^ Geitgey, Adam (2016-12-24). "Machine Learning is Fun Part 6: How to do Speech Recognition with Deep Learning". Medium. Retrieved 2018-03-21.
- ^ See also Praat.
- ^ "China's enormous surveillance state is still growing". The Economist. November 23, 2023. ISSN 0013-0613. Retrieved 2023-11-25.
- ^ "What is a Spectrogram?". Retrieved 2023-12-18.
- ^ T., Arias-Vergara; P., Klumpp; J. C., Vasquez-Correa; E., Nöth; J. R., Orozco-Arroyave; M., Schuster (2021). "Multi-channel spectrograms for speech processing applications using deep learning methods". Pattern Analysis and Applications. 24 (2): 423–431. doi:10.1007/s10044-020-00921-5.
- ^ Jia, Yanjie; Chen, Xi; Yu, Jieqiong; Wang, Lianming; Xu, Yuanzhe; Liu, Shaojin; Wang, Yonghui (2021). "Speaker recognition based on characteristic spectrograms and an improved self-organizing feature map neural network". Complex & Intelligent Systems. 7 (4): 1749–1757. doi:10.1007/s40747-020-00172-1.
- ^ Yalamanchili, Arpitha; Madhumathi, G. L.; Balaji, N. (2022). "Spectrogram analysis of ECG signal and classification efficiency using MFCC feature extraction technique". Journal of Ambient Intelligence and Humanized Computing. 13 (2): 757–767. doi:10.1007/s12652-021-02926-2. S2CID 233657057.
- ^ Ge, Junfeng; Wang, Li; Gui, Kang; Ye, Lin (30 September 2023). "Temperature interpretation method for temperature indicating paint based on spectrogram". Measurement. 219. Bibcode:2023Meas..21913317G. doi:10.1016/j.measurement.2023.113317. S2CID 259871198.
- ^ Park, Cheolhyeong; Lee, Deokwoo (11 February 2022). "Classification of Respiratory States Using Spectrogram with Convolutional Neural Network". Applied Sciences. 12 (4): 1895. doi:10.3390/app12041895.
External links edit
- See an online spectrogram of speech or other sounds captured by your computer's microphone.
- Generating a tone sequence whose spectrogram matches an arbitrary text, online
- Further information on creating a signal whose spectrogram is an arbitrary image
- Article describing the development of a software spectrogram
- History of spectrograms & development of instrumentation
- How to identify the words in a spectrogram from a linguistic professor's Monthly Mystery Spectrogram publication.
- Sonogram Visible Speech GPL Licensed freeware for the Spectrogram generation of Signal Files.