The Demographics of Kyrgyzstan is about the demographic features of the population of Kyrgyzstan, including population growth, population density, ethnicity, education level, health, economic status, religious affiliations, and other aspects of the population. The name Kyrgyz, both for the people and the country, means "forty tribes", a reference to the epic hero Manas who unified forty tribes against the Oirats, as symbolized by the 40-ray sun on the flag of Kyrgyzstan.
| Demographics of Kyrgyzstan | |
|---|---|
 Kyrgyzstan population pyramid in 2020 | |
| Population | 6,636,800 (2021)[1] |
| Density | 27.4/km2 (71/sq mi) |
| Growth rate | 1.32/1,000 population (2010) |
| Birth rate | 24.0 births/1,000 population (2020) |
| Death rate | 6.0 deaths/1,000 population (2020) |
| Life expectancy | 71.9 years (2020) |
| • male | 67.8 years (2020) |
| • female | 76.0 years (2020) |
| Fertility rate | 3.04 children born/woman (2020) |
| Infant mortality rate | 14.4 deaths/1,000 live births (2020) |
| Age structure | |
| 0–14 years | 23.6% |
| 15–64 years | 62.9% |
| 65 and over | 6.2% |
| Sex ratio | |
| At birth | 1.05 male(s)/female |
| Under 15 | 1.04 male(s)/female |
| 15–64 years | 0.96 male(s)/female |
| 65 and over | 0.64 male(s)/female |
| Nationality | |
| Nationality | Kyrgyz |
| Major ethnic | Kyrgyz |
| Minor ethnic | Kazakh, Russian, Uzbek, Dungan, Uyghur |
| Language | |
| Official | Kyrgyz, Russian |
| Spoken | Kyrgyz, Russian |
Overview edit
Kyrgyzstan's population increased from 2.1 million to 4.8 million between the censuses of 1959 and 1999.[2] Official estimates set the population at 6,389,500 in 2019.[1] Of those, 34.4% are under the age of 15 and 6.2% are over the age of 65. The country is rural: only about one-third of Kyrgyzstan's population live in urban areas. The average population density is 27.4 inhabitants per square kilometre (71/sq mi).
The nation's largest ethnic group are the Kyrgyz, a Turkic people, which comprise 73.2% of the population (2018 census). Other ethnic groups include Russians (5.8%) concentrated in the north and Uzbeks (14.5%) living in the south. Small but noticeable minorities include Dungans (1.1%), Uyghurs (1.1%), Tajiks (0.9%), Kazakhs (0.7%) and Ukrainians (0.5%), and other smaller ethnic minorities (1.7%). Of the formerly sizable Volga German community, exiled here by Joseph Stalin from their earlier homes in the Volga German Republic, most have returned to Germany, and only a few small groups remain. A small percentage of the population are also Koreans, who are the descendants of the Koreans deported in 1937 from the Soviet Far East to Central Asia.
Kyrgyzstan has undergone a pronounced change in its ethnic composition since independence.[3][4] The percentage of ethnic Kyrgyz increased from around 50% in 1979 to nearly 73% in 2018, while the percentage of Slavic ethnic groups (Russians, Ukrainians) dropped from 35% to about 6%.[1][2]
The Kyrgyz have historically been semi-nomadic herders, living in round tents called yurts and tending sheep, horses and yaks. This nomadic tradition continues to function seasonally (see transhumance) as herding families return to the high mountain pasture (or jailoo) in the summer. The retention of this nomadic heritage and the freedoms that it implies continue to affect the political atmosphere in the country.
Graphs are unavailable due to technical issues. There is more info on Phabricator and on MediaWiki.org. |
Graphs are unavailable due to technical issues. There is more info on Phabricator and on MediaWiki.org. |
Graphs are unavailable due to technical issues. There is more info on Phabricator and on MediaWiki.org. |
Population size and structure edit

Population Estimates by Sex and Age Group (01.VII.2020) (Data refer to annual average population.):[6]
| Age Group | Male | Female | Total | % |
|---|---|---|---|---|
| Total | 3 265 870 | 3 314 296 | 6 580 166 | 100 |
| 0–4 | 413 265 | 392 172 | 805 437 | 12.24 |
| 5–9 | 388 796 | 369 309 | 758 105 | 11.52 |
| 10–14 | 309 396 | 297 034 | 606 430 | 9.22 |
| 15–19 | 258 649 | 249 178 | 507 827 | 7.72 |
| 20–24 | 263 240 | 252 719 | 515 959 | 7.84 |
| 25–29 | 289 819 | 279 117 | 568 936 | 8.65 |
| 30–34 | 282 674 | 281 432 | 564 106 | 8.57 |
| 35–39 | 222 715 | 220 855 | 443 570 | 6.74 |
| 40–44 | 180 015 | 182 328 | 362 343 | 5.51 |
| 45–49 | 157 253 | 167 537 | 324 790 | 4.94 |
| 50–54 | 142 981 | 156 499 | 299 480 | 4.55 |
| 55–59 | 129 553 | 149 093 | 278 646 | 4.23 |
| 60–64 | 99 239 | 121 193 | 220 432 | 3.35 |
| 65-69 | 59 174 | 80 206 | 139 380 | 2.12 |
| 70-74 | 33 247 | 50 398 | 83 645 | 1.27 |
| 75-79 | 13 209 | 21 957 | 35 166 | 0.53 |
| 80-84 | 13 189 | 25 642 | 38 831 | 0.59 |
| 85-89 | 4 822 | 10 280 | 15 102 | 0.23 |
| 90-94 | 3 131 | 5 305 | 8 436 | 0.13 |
| 95-99 | 1 127 | 1 459 | 2 586 | 0.04 |
| 100+ | 376 | 583 | 959 | 0.01 |
| Age group | Male | Female | Total | Percent |
| 0–14 | 1 111 457 | 1 058 515 | 2 169 972 | 32.98 |
| 15–64 | 2 026 138 | 2 059 951 | 4 086 089 | 62.10 |
| 65+ | 128 275 | 195 830 | 324 105 | 4.93 |
Vital statistics edit
Births and deaths edit
Statistics are taken from the United Nations Demographic Yearbook, the National Statistical Committee of the Republic of Kyrgyzstan, the Demographic Annual of the Kyrgyz Republic, and Demoskop Weekly.[7][8][9][10][11][12]
| Average population | Live births | Deaths | Natural change | Crude birth rate (per 1000) | Crude death rate (per 1000) | Natural change (per 1000) | TFR | Life expectancy
(male) |
Life expectancy (female) | Life expectancy (total) | |
|---|---|---|---|---|---|---|---|---|---|---|---|
| 1950 | 1,740,000 | 56,471 | 14,845 | 41,626 | 32.5 | 8.5 | 24.0 | ||||
| 1951 | 1,768,000 | 58,828 | 13,927 | 44,901 | 33.3 | 7.9 | 25.4 | ||||
| 1952 | 1,788,000 | 57,632 | 13,868 | 43,764 | 32.2 | 7.8 | 24.4 | ||||
| 1953 | 1,818,000 | 60,755 | 14,288 | 46,467 | 33.4 | 7.9 | 25.5 | ||||
| 1954 | 1,859,000 | 63,803 | 13,684 | 50,119 | 34.3 | 7.4 | 26.9 | ||||
| 1955 | 1,903,000 | 63,883 | 14,923 | 48,960 | 33.6 | 7.8 | 25.8 | ||||
| 1956 | 1,941,000 | 65,667 | 11,918 | 53,749 | 33.8 | 6.1 | 27.7 | ||||
| 1957 | 1,978,000 | 68,644 | 12,275 | 56,369 | 34.7 | 6.2 | 28.5 | ||||
| 1958 | 2,030,000 | 70,521 | 12,324 | 58,197 | 34.7 | 6.1 | 28.6 | ||||
| 1959 | 2,099,000 | 70,501 | 12,930 | 57,571 | 33.6 | 6.2 | 27.4 | ||||
| 1960 | 2,172,000 | 80,209 | 13,259 | 66,950 | 36.9 | 6.1 | 30.8 | ||||
| 1961 | 2,256,000 | 80,671 | 15,175 | 65,496 | 35.8 | 6.7 | 29.1 | ||||
| 1962 | 2,333,000 | 79,010 | 15,141 | 63,869 | 33.9 | 6.5 | 27.4 | ||||
| 1963 | 2,413,000 | 80,279 | 14,986 | 65,293 | 33.3 | 6.2 | 27.1 | ||||
| 1964 | 2,495,000 | 79,342 | 15,834 | 63,508 | 31.8 | 6.3 | 25.5 | ||||
| 1965 | 2,573,000 | 80,812 | 16,693 | 64,119 | 31.4 | 6.5 | 24.9 | ||||
| 1966 | 2,655,000 | 81,771 | 17,888 | 63,883 | 30.8 | 6.7 | 24.1 | ||||
| 1967 | 2,737,000 | 83,609 | 19,550 | 64,059 | 30.5 | 7.1 | 23.4 | ||||
| 1968 | 2,818,000 | 86,741 | 19,840 | 66,901 | 30.8 | 7.0 | 23.8 | ||||
| 1969 | 2,896,000 | 87,210 | 21,683 | 65,527 | 30.1 | 7.5 | 22.6 | ||||
| 1970 | 2,964,000 | 90,442 | 21,828 | 68,614 | 30.5 | 7.4 | 23.1 | ||||
| 1971 | 3,028,000 | 95,932 | 21,343 | 74,589 | 31.7 | 7.0 | 24.7 | ||||
| 1972 | 3,094,000 | 94,923 | 23,157 | 71,766 | 30.7 | 7.5 | 23.2 | ||||
| 1973 | 3,160,000 | 97,421 | 24,181 | 73,240 | 30.8 | 7.7 | 23.1 | ||||
| 1974 | 3,230,000 | 99,433 | 23,747 | 75,686 | 30.8 | 7.4 | 23.4 | ||||
| 1975 | 3,299,000 | 101,287 | 26,920 | 74,367 | 30.7 | 8.2 | 22.5 | ||||
| 1976 | 3,365,000 | 106,606 | 27,864 | 78,742 | 31.7 | 8.3 | 23.4 | ||||
| 1977 | 3,430,000 | 104,971 | 28,510 | 76,461 | 30.6 | 8.3 | 22.3 | ||||
| 1978 | 3,495,000 | 106,176 | 28,385 | 77,791 | 30.4 | 8.1 | 22.3 | ||||
| 1979 | 3,558,000 | 107,091 | 29,578 | 77,513 | 30.1 | 8.3 | 21.8 | ||||
| 1980 | 3,628,000 | 107,278 | 30,460 | 76,818 | 29.6 | 8.4 | 21.2 | ||||
| 1981 | 3,699,000 | 113,434 | 29,591 | 83,843 | 30.7 | 8.0 | 22.7 | ||||
| 1982 | 3,775,000 | 117,235 | 29,194 | 88,041 | 31.1 | 7.7 | 23.4 | ||||
| 1983 | 3,857,000 | 120,708 | 30,241 | 90,467 | 31.3 | 7.8 | 23.5 | ||||
| 1984 | 3,937,000 | 126,075 | 32,603 | 93,472 | 32.0 | 8.3 | 23.7 | 4.16 | |||
| 1985 | 4,014,000 | 128,460 | 32,332 | 96,128 | 32.0 | 8.1 | 23.9 | 4.12 | |||
| 1986 | 4,093,000 | 133,728 | 29,083 | 104,645 | 32.7 | 7.1 | 25.6 | 4.21 | |||
| 1987 | 4,173,000 | 136,588 | 30,597 | 105,991 | 32.7 | 7.3 | 25.4 | 4.20 | |||
| 1988 | 4,250,000 | 133,710 | 31,879 | 101,831 | 31.5 | 7.5 | 24.0 | 4.00 | |||
| 1989 | 4,327,000 | 131,508 | 31,156 | 100,352 | 30.4 | 7.2 | 23.2 | 3.81 | |||
| 1990 | 4,395,000 | 128,810 | 30,580 | 98,230 | 29.3 | 7.0 | 22.3 | 3.63 | 64.2 | 72.6 | 68.4 |
| 1991 | 4,464,000 | 129,536 | 30,859 | 98,677 | 29.0 | 6.9 | 22.1 | 3.58 | 64.6 | 72.7 | 68.7 |
| 1992 | 4,515,000 | 128,352 | 32,163 | 96,189 | 28.4 | 7.1 | 21.3 | 3.52 | 64.2 | 72.2 | 68.2 |
| 1993 | 4,515,000 | 116,795 | 34,513 | 82,282 | 25.9 | 7.6 | 18.3 | 3.15 | 62.9 | 71.7 | 67.3 |
| 1994 | 4,523,000 | 110,113 | 37,109 | 73,004 | 24.3 | 8.2 | 16.1 | 2.95 | 61.6 | 70.7 | 66.1 |
| 1995 | 4,560,000 | 117,340 | 36,915 | 80,425 | 25.7 | 8.1 | 17.6 | 3.12 | 61.4 | 70.4 | 65.9 |
| 1996 | 4,628,000 | 108,007 | 34,562 | 73,445 | 23.3 | 7.5 | 15.8 | 2.73 | 62.3 | 71.0 | 66.7 |
| 1997 | 4,696,000 | 102,050 | 34,540 | 67,510 | 21.7 | 7.4 | 14.3 | 2.59 | 62.6 | 71.4 | 67.0 |
| 1998 | 4,769,000 | 104,183 | 34,596 | 69,587 | 21.8 | 7.3 | 14.5 | 2.65 | 63.1 | 71.2 | 67.2 |
| 1999 | 4,837,000 | 104,068 | 32,850 | 71,218 | 21.5 | 6.8 | 14.7 | 2.63 | 65.0 | 72.6 | 68.8 |
| 2000 | 4,888,000 | 96,770 | 34,111 | 62,659 | 19.8 | 7.0 | 12.8 | 2.40 | 64.9 | 72.4 | 68.6 |
| 2001 | 4,927,000 | 98,138 | 32,677 | 65,461 | 19.9 | 6.6 | 13.3 | 2.39 | 65.0 | 72.6 | 68.8 |
| 2002 | 4,965,000 | 101,012 | 35,235 | 65,777 | 20.3 | 7.1 | 13.2 | 2.43 | 64.4 | 72.1 | 68.2 |
| 2003 | 5,011,000 | 105,490 | 35,941 | 69,549 | 21.1 | 7.2 | 13.9 | 2.49 | 64.5 | 72.2 | 68.3 |
| 2004 | 5,065,000 | 109,939 | 35,061 | 74,878 | 21.7 | 6.9 | 14.8 | 2.55 | 64.4 | 72.3 | 68.4 |
| 2005 | 5,116,000 | 109,839 | 36,992 | 72,847 | 21.5 | 7.2 | 14.3 | 2.50 | 64.2 | 71.9 | 68.0 |
| 2006 | 5,164,000 | 120,737 | 38,566 | 82,171 | 23.4 | 7.5 | 15.9 | 2.70 | 63.5 | 72.1 | 67.8 |
| 2007 | 5,207,000 | 123,251 | 38,180 | 85,071 | 23.7 | 7.3 | 16.4 | 2.71 | 63.7 | 72.3 | 68.0 |
| 2008 | 5,250,000 | 127,332 | 37,710 | 89,622 | 24.3 | 7.2 | 17.1 | 2.76 | 64.5 | 72.6 | 68.6 |
| 2009 | 5,383,000 | 135,494 | 35,898 | 99,596 | 25.2 | 6.7 | 18.5 | 2.88 | 65.2 | 73.2 | 69.2 |
| 2010 | 5,448,000 | 146,123 | 36,174 | 109,949 | 26.8 | 6.6 | 20.2 | 3.06 | 65.3 | 73.5 | 69.4 |
| 2011 | 5,552,000 | 149,612 | 35,941 | 113,671 | 27.0 | 6.5 | 20.5 | 3.09 | 65.7 | 73.7 | 69.7 |
| 2012 | 5,663,000 | 154,918 | 36,186 | 118,732 | 27.4 | 6.4 | 21.0 | 3.15 | 66.1 | 74.1 | 70.1 |
| 2013 | 5,777,000 | 155,520 | 34,880 | 120,640 | 26.9 | 6.0 | 20.9 | 3.11 | 66.3 | 74.3 | 70.3 |
| 2014 | 5,895,000 | 161,813 | 35,564 | 126,249 | 27.5 | 6.0 | 21.5 | 3.19 | 66.5 | 74.5 | 70.5 |
| 2015 | 6,019,000 | 163,452 | 34,808 | 128,644 | 27.2 | 5.8 | 21.4 | 3.19 | 66.7 | 74.8 | 70.8 |
| 2016 | 6,140,000 | 158,160 | 33,475 | 124,685 | 25.8 | 5.5 | 20.3 | 3.06 | 67.0 | 75.1 | 71.1 |
| 2017 | 6,257,000 | 153,620 | 33,166 | 120,454 | 24.6 | 5.3 | 19.3 | 2.95 | 67.2 | 75.4 | 71.3 |
| 2018 | 6,389,000 | 171,149 | 32,989 | 138,160 | 26.8 | 5.2 | 21.6 | 3.30 | 67.4 | 75.6 | 71.5 |
| 2019 | 6,524,000 | 173,484 | 33,295 | 140,189 | 26.6 | 5.1 | 21.5 | 3.33 | 67.6 | 75.8 | 71.7 |
| 2020 | 6,636,803 | 158,112 | 39,977 | 118,135 | 23.8 | 6.0 | 17.8 | 3.05 | 67.8 | 76.0 | 71.9 |
| 2021 | 6,747,323 | 150,164 | 38,875 | 111,289 | 22.3 | 5.8 | 16.5 | 2.89 | 67.9 | 76.1 | 72.0 |
| 2022 | 7,037,590 | 150,225 | 31,401 | 118,824 | 21.5 | 4.5 | 17.0 | 2.81 | 68.0 | 76.3 | 72.2 |
| 2023 | 7,161,900 | 145,977 | 31,500 | 114,477 | 20.6 | 4.4 | 16.2 |
Latest data edit
| Period | Live births | Deaths | Natural increase |
|---|---|---|---|
| January - February 2023 | 22,336 | 5,330 | +17,006 |
| January - February 2024 | 23,241 | 5,870 | +17,371 |
| Difference |
Total fertility rate edit
During the Sovjet era fertility in Kyrgyzstan was high (TFR 4 or higher). After the independence there was a fast decrease to 2.4 in the beginning of the 21st century, but the TFR increased to 3 or higher as of 2010. Since 2020, there is a decrease to 2.8 in 2022.
The differences in the number of children by nationality are significant:[3][4] Uzbeks (3.0 children), Tajiks (3.0 children), Turks (2.9), Kyrgyz (2.9), Dungans (2.8) Russians (1.7), Koreans (1.7), Germans (1.8), Ukrainians (2.1), Tatars (2.1), Kazakhs (2.3) and Uyghurs (2.5).[2] The TFR for Russians, Ukrainians, Germans, and Koreans in Kyrgyzstan are considerably higher than in their home countries.[citation needed]
Life expectancy edit


Ethnic groups edit
According to the 2022 census,[14] the ethnic composition of the population was as follows: Kyrgyz 77.6%, Uzbeks 14.2%, Russians 4.1%, Dungans 1.0%, Uyghurs 0.5%, other 2.7%, including Tajiks 0.9%, Kazakhs 0.4% and Turks 0,3%. Most Russians, Ukrainians, Tatars, Germans, and Koreans lived in northeast, especially around the city of Karakol. Most of the Dungans and Uyghurs are found along the Chinese border. Most of the Tajiks and Uzbeks live in and around Fergana valley.
-
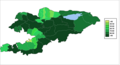 Percantage of Kyrgyz in Kyrgyzstan by region
 -
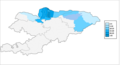 Percantage of Russians in Kyrgyzstan by region
 -
 Percantage of Uzbeks in Kyrgyzstan by region


The emigration of non-Turkic people to Russia, Ukraine, and Germany is now negligible, in part because most of them left prior to 1999.[citation needed] For example, the number of Germans has fallen by over 90% between the 1989 and 2009 censuses.
The table shows the ethnic composition of Kyrgyzstan's population according to all population censuses between 1926 and 2022. Due to emigration (and low fertility rates), there has been a sharp decline in the European ethnic groups (Russians, Ukrainians, Germans) and also Tatars since independence (as captured in the 1989, 1999, 2009 and 2022 censuses).
| Ethnic group |
census 1926[15] | census 1939[16] | census 1959[17] | census 1970[18] | census 1979[19] | census 1989[20] | census 1999[1] | census 2009[21] | census 2022[22] | |||||||||
|---|---|---|---|---|---|---|---|---|---|---|---|---|---|---|---|---|---|---|
| Number | % | Number | % | Number | % | Number | % | Number | % | Number | % | Number | % | Number | % | Number | % | |
| Kyrgyz | 661,171 | 66.6 | 754,323 | 51.7 | 836,831 | 40.5 | 1,284,773 | 43.8 | 1,687,382 | 47.9 | 2,229,663 | 52.4 | 3,128,147 | 64.9 | 3,804,788 | 71.0 | 5,379,020 | 77.6 |
| Uzbeks | 110,463 | 11.1 | 151,551 | 10.4 | 218,640 | 10.6 | 332,638 | 11.3 | 426,194 | 12.1 | 550,096 | 12.9 | 664,950 | 13.8 | 768,405 | 14.3 | 986,881 | 14.2 |
| Russians | 116,436 | 11.7 | 302,916 | 20.8 | 623,562 | 30.2 | 855,935 | 29.2 | 911,703 | 25.9 | 916,558 | 21.5 | 603,201 | 12.5 | 419,583 | 7.8 | 282,652 | 4.1 |
| Dungans | 6,004 | 0.6 | 5,921 | 0.4 | 11,088 | 0.5 | 19,837 | 0.7 | 26,661 | 0.8 | 36,928 | 0.9 | 51,766 | 1.1 | 58,409 | 1.1 | 66,525 | 1.0 |
| Tajiks | 2,667 | 0.3 | 10,670 | 0.7 | 15,221 | 0.7 | 21,927 | 0.7 | 23,209 | 0.7 | 33,518 | 0.8 | 42,636 | 0.9 | 46,105 | 0.9 | 59,895 | 0.9 |
| Uyghurs | 7,540 | 0.8 | 9,412 | 0.6 | 13,757 | 0.7 | 24,872 | 0.8 | 29,817 | 0.8 | 36,779 | 0.9 | 46,944 | 1.0 | 48,543 | 0.9 | 31,559 | 0.5 |
| Kazakhs | 1,766 | 0.2 | 23,925 | 1.6 | 20,067 | 1.0 | 21,998 | 0.8 | 27,442 | 0.8 | 37,318 | 0.9 | 42,657 | 0.9 | 33,198 | 0.6 | 28,244 | 0.4 |
| Turks | 44 | 0.0 | 33 | 0.0 | 542 | 0.0 | 3,076 | 0.1 | 5,160 | 0.1 | 21,294 | 0.5 | 33,327 | 0.7 | 39,133 | 0.7 | 22,074 | 0.3 |
| Azeris | 3,631 | 0.4 | 7,724 | 0.5 | 10,428 | 0.5 | 12,536 | 0.4 | 17,207 | 0.5 | 15,775 | 0.4 | 14,014 | 0.3 | 17,267 | 0.3 | 17,359 | 0.3 |
| Tatars | 4,902 | 0.5 | 20,017 | 1.4 | 56,209 | 2.7 | 68,827 | 2.3 | 71,744 | 2.0 | 70,068 | 1.6 | 45,438 | 0.9 | 31,424 | 0.6 | 11,219 | 0.2 |
| Kurds | - | - | 1,490 | 0.1 | 4,783 | 0.2 | 7,974 | 0.3 | 9,544 | 0.3 | 14,262 | 0.3 | 11,620 | 0.2 | 13,171 | 0.3 | 10,733 | 0.2 |
| Koreans | 9 | 0.0 | 508 | 0.0 | 3,622 | 0.2 | 9,404 | 0.3 | 14,481 | 0.4 | 18,355 | 0.4 | 19,784 | 0.4 | 17,299 | 0.3 | 5,900 | 0.1 |
| Ukrainians | 64,128 | 6.5 | 137,299 | 9.4 | 137,031 | 6.6 | 120,081 | 4.1 | 109,324 | 3.1 | 108,027 | 2.5 | 50,442 | 1.0 | 21,924 | 0.4 | 3,875 | 0.1 |
| Germans | 4,291 | 0.4 | 11,741 | 0.8 | 39,915 | 1.9 | 89,834 | 3.1 | 101,057 | 2.9 | 101,309 | 2.4 | 21,471 | 0.4 | 9,487 | 0.2 | 2,831 | 0.0 |
| Chechens | 1 | 0.0 | 7 | 0.0 | 25,208 | 1.2 | 3,391 | 0.1 | 2,654 | 0.1 | 2,873 | 0.1 | 2,612 | 0.1 | 1,875 | 0.0 | 1,105 | 0.0 |
| Belarusians | 333 | 0.0 | 1,520 | 0.1 | 4,613 | 0.2 | 6,868 | 0.2 | 7,676 | 0.2 | 9,187 | 0.2 | 3,208 | 0.1 | 1,394 | 0.0 | 391 | 0.0 |
| Jews | 318 | 0.0 | 1,895 | 0.1 | 8,607 | 0.4 | 7,677 | 0.3 | 6,836 | 0.2 | 6,005 | 0.1 | 1,571 | 0.0 | 604 | 0.0 | 125 | 0.0 |
| Others | 9,300 | 0.9 | 17,261 | 1.2 | 35,713 | 1.7 | 41,157 | 1.4 | 44,741 | 1.3 | 49,740 | 1.2 | 50,770 | 1.1 | 43,300 | 0.8 | 25,643 | 0.4 |
| Total | 993,004 | 1,458,213 | 2,065,837 | 2,932,805 | 3,522,832 | 4,257,755 | 4,822,938 | 5,362,793 | 6,936,156 | |||||||||
Languages edit
(2021 est.)[citation needed]
Religion edit
- Islam 87.6%
- Russian Orthodox 9.4%
- others 3%.
See also edit
References edit
- ^ a b c d "Население [Population]". Национальный статистический комитет Кыргызской Республики [National Statistical Committee of the Kyrgyz Republic].}
- ^ a b c Population census for Kyrgyzstan, 1999 (in Russian)
- ^ a b Spoorenberg, Thomas (2013). "Fertility changes in Central Asia since 1980". Asian Population Studies. 9 (1): 50–77. doi:10.1080/17441730.2012.752238. S2CID 154532617.
- ^ a b Spoorenberg, Thomas (2015). "Explaining recent fertility increase in Central Asia". Asian Population Studies. 11 (2): 115–133. doi:10.1080/17441730.2015.1027275. S2CID 153924060.
- ^ "Ethnic composition of the population in Kyrgyzstan 2015" (PDF) (in Russian). National Statistical Committee of the Kyrgyz Republic. Archived from the original (PDF) on 4 March 2016. Retrieved 1 January 2015.
- ^ "UNSD — Demographic and Social Statistics".
- ^ "Demographic Yearbook (DYB) Regular Issues 2000 - 2010". United Nations Statistical Division. 2001. Retrieved 31 January 2016.
- ^ Население [Population]. National Statistical Committee of the Republic of Kyrgyzstan (in Russian). Retrieved 31 January 2016.
- ^ Численность населения областей, районов, городов и поселков городского типа Кыргызской Республики в 2015г. [Population of Regions, Districts, cities and towns of the Kyrgyz Republic in 2015] (PDF) (in Russian). National Committee for Statistics of the Kyrgyz Republic. Archived from the original (PDF) on 26 September 2015. Retrieved 31 March 2015.
- ^ ДЕМОГРАФИЧЕСКИЙ ЕЖЕГОДНИК КЫРГЫЗСКОЙ РЕСПУБЛИКИ 2009-2013 гг. [Demographic Annual of the Kyrgyz Republic for 2009-2013] (PDF) (in Russian). National Committee for Statistics of the Kyrgyz Republic. 2014. Archived from the original (PDF) on 6 March 2016. Retrieved 31 March 2015.
- ^ Естественное движение населения республик СССР, 1935 [Natural population growth of the Republics of the USSR, 1935] (in Russian). Demoscope.ru. Archived from the original on 2 April 2015. Retrieved 31 March 2015.
- ^ 5.01.00.16 Справочные данные по населению [Table 5.01.00.16 Population reference data] (XLS). National Statistical Committee of the Republic of Kyrgyzstan (in Russian). 2015. Retrieved 31 January 2016."Table 5.01.00.05 Number of live births" (XLS). National Statistical Committee of the Republic of Kyrgyzstan. 2015. Retrieved 31 January 2016.
- ^ "Population - Official Statistics".
- ^ "Kyrgyzstan census 2022" (PDF).
- ^ Всесоюзная перепись населения 1926 года. Национальный состав населения по регионам РСФСР [All-Union census in 1926. National composition of the population by regions of the RSFSR]. Demoskop Weekly (in Russian) (673–674). Archived from the original on 21 March 2016. Retrieved 22 February 2016.
- ^ Всесоюзная перепись населения 1939 года. Национальный состав населения по республикам СССР [All-Union census 1939. National composition of the population by republics of the USSR]. Demoskop Weekly (in Russian) (673–674). Retrieved 22 February 2016.
- ^ Всесоюзная перепись населения 1959 года. Национальный состав населения по республикам СССР [All-Union census 1959. National composition of the population by republics of the USSR]. Demoskop Weekly (in Russian) (673–674). Archived from the original on 16 March 2010. Retrieved 22 February 2016.
- ^ Всесоюзная перепись населения 1970 года. Национальный состав населения по республикам СССР [All-Union census 1970. National composition of the population by republics of the USSR]. Demoskop Weekly (in Russian) (673–674). Archived from the original on 3 December 2009. Retrieved 22 February 2016.
- ^ Всесоюзная перепись населения 1979 года. Национальный состав населения по республикам СССР [All-Union census 1979. National composition of the population by republics of the USSR]. Demoskop Weekly (in Russian) (673–674). Archived from the original on 24 March 2010. Retrieved 22 February 2016.
- ^ Всесоюзная перепись населения 1989 года. Национальный состав населения по республикам СССР [All-Union census 1989. National composition of the population by republics of the USSR]. Demoskop Weekly (in Russian) (673–674). Archived from the original on 16 March 2010. Retrieved 22 February 2016.
- ^ 2009 - Национальный состав населения (на начало года) [2009 - Ethnic composition the population (at the beginning of the year)] (PDF). Bureau of Statistics of Kyrgyzstan (in Russian). 2011. Archived from the original (PDF) on 20 September 2011.
- ^ "Kyrgyzstan BRIEF STATISTICAL HANDBOOK 2022" (PDF).