Talk:COVID-19 pandemic in the United Kingdom/Archive 1
| This is an archive of past discussions. Do not edit the contents of this page. If you wish to start a new discussion or revive an old one, please do so on the current talk page. |
| Archive 1 | Archive 2 | Archive 3 | → | Archive 5 |
Guidance on sections
If anyone can suggest ways to divide sections and in which order, it would be helpful. There is quite a lot of cross-over. Whispyhistory (talk) 20:09, 2 March 2020 (UTC)
Reliability of sources
I recommend using largely government sources via the Department of Health and Social Care and/or Gov.uk (updates 2 pm each day) for the latest infection figures. Media publications are expected to be far less reliable and may be unable to confirm the numbers accurately. A non-governmental research source via the John Hopkins University seems to be reliable. The source may be behind the latest figures and take longer to update. Link: https://gisanddata.maps.arcgis.com/apps/opsdashboard/index.html#/bda7594740fd40299423467b48e9ecf6 — Preceding unsigned comment added by Harry-Oscar 1812 (talk • contribs) 17:51, 4 March 2020 (UTC)
Cruise Ship Death
Should the death of the Brit on the cruise ship outside Japan be added to the total? TuplinJ (talk) 10:00, 3 March 2020 (UTC)
I believe by precedent the death is counted as occurring in international conveyance, which includes any cases on cruise ships.Harry-Oscar 1812 (talk) 18:00, 4 March 2020 (UTC)
Cardiff case (5th March) not mentioned on the page
Here's the report: https://www.walesonline.co.uk/news/health/coronavirus-wales-cases-public-health-17870485 Has it been omitted for a reason? — Preceding unsigned comment added by Gaunt (talk • contribs) 11:53, 7 March 2020 (UTC)
Map Update - Pembrokeshire
Map needs updating to include Pembrokeshire (or Dyfed as the map shows). 2 cases confirmed. [1]
— Preceding unsigned comment added by 209.93.111.246 (talk • contribs) 21:37, 8 March 2020 (UTC)
Map: Wales
This is out of date. There are confirmed cases in Pembrokeshire and Cardiff. https://www.bbc.co.uk/news/uk-51800298
Daily numbers, increases and percentages
The last two days don't add up and the percentage s are incorrect. Adm281156 (talk) 12:20, 12 March 2020 (UTC)
Data Presentation
The gov.uk Coronavirus information page is updated everyday in the afternoon, supposedly at 2pm but it's typically later. Today the webpage has gained information about the location of cases, and as far as I know, this is the first official source of location data that we have, albeit it is currently only NHS regions in England that are shown.
2020 coronavirus outbreak in the United Kingdom currently shows a map of counties that have confirmed cases of COVID-19. Smurrayinchester (talk · contribs) seems to be the one who has created and has been updating this map. It might be a good idea to move to a map that shows the number of cases in each region (if possible), such as this map, based off the above data source. It may better represent the situation once the cases are more widespread.
Unfortunately the graph and table on the page may become quite large in the coming weeks, so it may be necessary to change the layout of these too somewhat going forward. —TechGoblin (talk) 17:16, 5 March 2020 (UTC)
I agree with TechGoblin, the current format will suffice.Harry-Oscar 1812 (talk) 18:00, 5 March 2020 (UTC)
- The site today says "105" but news reports are around the 115/116 mark. We should decide if we are taking the c. 2pm figures every day, then label the table accordingly. If we want to maintain a more dynamic count, this should probably be separate. All the best: Rich Farmbrough (the apparently calm and reasonable) 21:27, 5 March 2020 (UTC).
- @Rich Farmbrough: The site says 105 in the table, which is just cases in England, 115 is shown above in the text. Perhaps we should show confirmed cases and suspected cases (where suspected is from news reports, etc) in separate boxes? TechGoblin (talk) 09:04, 6 March 2020 (UTC)
- @TechGoblin: Yes, especially since Public Health England isn't releasing the data I need for the detailed map. Swapped out for a density map using the data you linked. Smurrayinchester 09:37, 7 March 2020 (UTC)
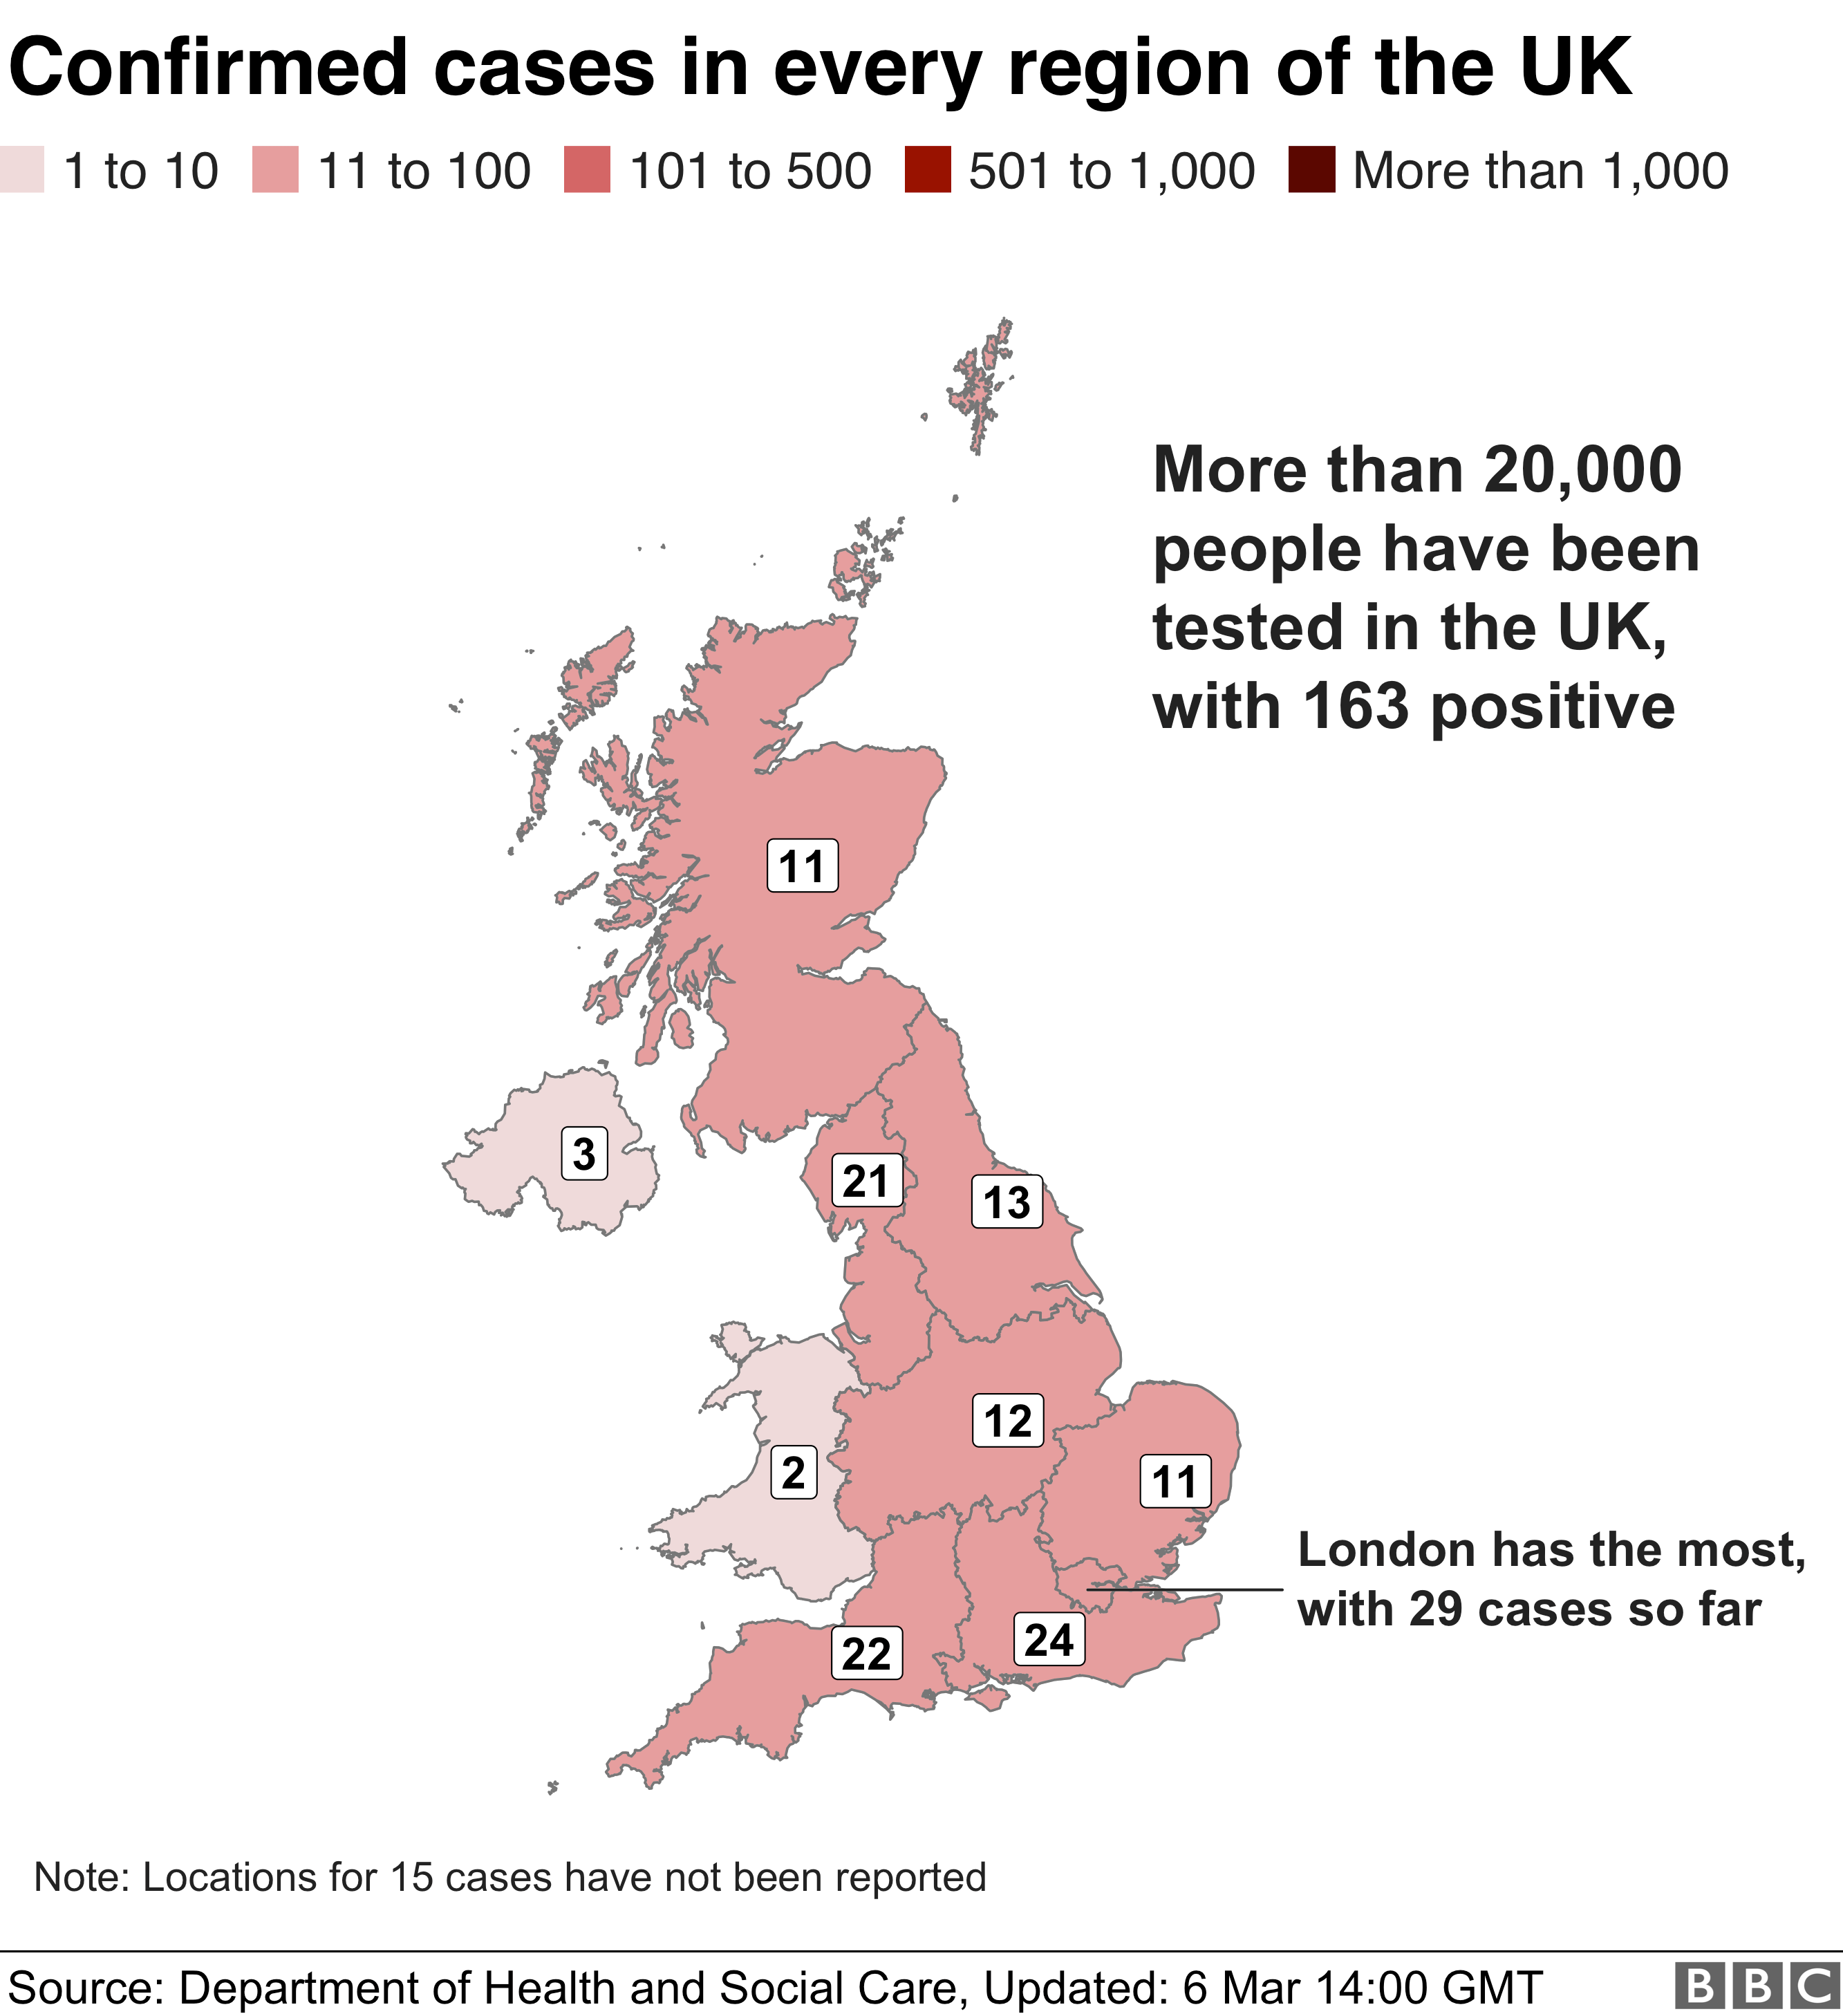
- @Smurrayinchester: What are your thoughts on adding figures to the map, such as with this BBC map? Would this create too much work? I am new to editing so I'm not sure how much effort it takes for you to update these maps. TechGoblin (talk) 08:38, 8 March 2020 (UTC)
- For the area map, that would be fine. I'll have a go, see how it looks. Smurrayinchester 13:51, 12 March 2020 (UTC)
- @Smurrayinchester: What are your thoughts on adding figures to the map, such as with this BBC map? Would this create too much work? I am new to editing so I'm not sure how much effort it takes for you to update these maps. TechGoblin (talk) 08:38, 8 March 2020 (UTC)
In terms of the graph as it grows larger, the equivalent cases graph for China handles this in a very nice way and that can be implemented on the UK one as and when needed. See here! —Buttons0603 (talk) 00:13, 7 March 2020 (UTC)
- @Buttons0603: that graph looks good, I expect this will be needed soon as the data from today (7th March) didn't fit, I've updated the scaling to 2.5 for now.
I would like to make you aware of this data on the gov.uk website, which gives the number of cases by "upper tier local authority" daily (England only). This may be useful for a more detailed density map. TechGoblin (talk) 10:41, 10 March 2020 (UTC)
I have just done a logarithmic plot of the graph using the same data (I would upload it but wikipedia is refusing a simple jpg). It is very instructive and is almost a straight line showing a factor-of-10 increase (positive gradient) every 10 days. If you extrapolate this as a straight line then we are at 3000 cases in 10 days and 30k cases in 20 days. I would recommend adding a log plot too so others can extrapolate as they see fit. A-bj-q (talk) 21:09, 10 March 2020 (UTC)
- The data for Scotland are also available by health board, updated daily at 2pm: [1] Espresso Addict (talk) 03:00, 12 March 2020 (UTC)
Requested move 12 March 2020
- The following is a closed discussion of a requested move. Please do not modify it. Subsequent comments should be made in a new section on the talk page. Editors desiring to contest the closing decision should consider a move review after discussing it on the closer's talk page. No further edits should be made to this discussion.
The result of the move request was: Moved by Lugnuts. (non-admin closure) Crouch, Swale (talk) 18:03, 12 March 2020 (UTC)
2020 coronavirus outbreak in the United Kingdom → 2020 coronavirus pandemic in the United Kingdom – To bring the title in line with the other articles, per the consensus at Talk:2019–20_coronavirus_pandemic#Requested_move_11_March_2020. Lewis Hulbert (talk) 10:23, 12 March 2020 (UTC)
- @Natg 19: @DeFacto: Lewis Hulbert (talk) 10:23, 12 March 2020 (UTC)
- Support per continuity with the other articles. Andysmith248 (talk) 13:07, 12 March 2020 (UTC)
- Support it was a pretty uncontroversial move and should not have been reversed. Important to maintain consistency with the main article and various other country articles, which were moved from "outbreak" to "pandemic". Elshad (talk) 14:48, 12 March 2020 (UTC)
- Support consensus was already established for the set, und blindingly obvious. Why this is not supposed to be a pandemic in the UK is inexplicable. Agathoclea (talk) 15:16, 12 March 2020 (UTC)
- Support Sun Creator(talk) 15:41, 12 March 2020 (UTC)
- Further comment we really shouldn't wait 7 days to move this if a consensus develops. All the other country articles have been moved and this one was only reverted by the actions of a single editor who did not gain consensus before reverting. Elshad (talk) 16:03, 12 March 2020 (UTC)
- Support per WP:CONSUB. Crouch, Swale (talk) 17:29, 12 March 2020 (UTC)
- Comment per WP:IAR, WP:BOLD, etc, I've moved it. Full rationale in my edit summary. Now wash your hands. Lugnuts Fire Walk with Me 17:52, 12 March 2020 (UTC)
- The above discussion is preserved as an archive of a requested move. Please do not modify it. Subsequent comments should be made in a new section on this talk page or in a move review. No further edits should be made to this section.
Why England only?
Why does the current map in the infobox only show cases in England? The UK is not just England. Elshad (talk) 10:43, 12 March 2020 (UTC)
- Only data for England is available, unless you have data for other countries. Ythlev (talk) 13:09, 12 March 2020 (UTC)
- There is Health Board-level data for Scotland available on the Scottish Government website. 185.58.164.45 (talk) 15:37, 12 March 2020 (UTC)
The incomplete, poorly captioned and unsourced map
Earlier on I removed the top map as it was incomplete (Northern Ireland, Scotland and Wales were missing) and it had no key to explain the colours and no explanation of what the divisions were. My removal was swiftly reverted by the map's creator though. Since then, Northern Ireland, Scotland and Wales have been added, with without the same level of detail as for England. But the colours are not described, the nature of the 'subdivisions' is not givem, and the date and source of the data is not given to allow verification. I propose removing this map again until these problems are resolved. -- DeFacto (talk). 19:49, 12 March 2020 (UTC)
I was the person who reverted the initial undiscussed move to this name, and I missed the chance to contribute to the subsequent move discussion as it was open for less than 8 hours. However, I would have opposed the move as I thought there was only one coronavirus pandemic, and not one in each country, and certainly not one in the UK as I haven't seen the UK outbreak described as a pandemic in any of the reliable sources. -- DeFacto (talk). 19:18, 12 March 2020 (UTC)
- By definition a pandemic is something that involves countries/continents around the globe. This is not established on a country level. This article describes the part the UK plays in the larger event, not an event happening in the UK alone. Agathoclea (talk) 21:43, 12 March 2020 (UTC)
- I think the name is fine, but take your point as it is an epidemic in the UK. The wording of the article should reflect this, as an epidemic within the UK, as part of the worldwide pandemic. The name seems good to keep within the collection of related articles however. |→ Spaully ~talk~ 13:35, 13 March 2020 (UTC)
Herd immunity
Discussion on Herd immunity is over the UK news today. Sun Creator(talk) 14:09, 13 March 2020 (UTC)
Different data reported on the NHS and gov.uk websites
As of now, the data reported on gov.uk covid infos for public are:
Number of cases
As of 9am on 13 March 2020, 32,771 people have been tested in the UK, of which 31,973 were confirmed negative and 798 were confirmed as positive. 10 patients who tested positive for COVID-19 have died.
on the Daily Indicators map we find (link:https://www.arcgis.com/home/item.html?id=bc8ee90225644ef7a6f4dd1b13ea1d67):
| date | total Uk Cases | NewUKCases | TotalUKDeaths | EnglandCases | ScotlandCases | WalesCases | NICases |
|---|---|---|---|---|---|---|---|
| 3/13/2020 | 797 | 207 | 10 | 645 | 85 | 38 | 29 |
Please update the informations of the wiki page: I cannot do that for privilege reasons. — Preceding unsigned comment added by PaoloMera (talk • contribs) 21:37, 13 March 2020 (UTC)
Guernsey not part of UK
While it almost certainly doesn't require its own outbreak article yet (and hopefully not at all!), Guernsey should not be included as part of this article as it is not a part of the United Kingdom. —Formulaonewiki 18:00, 9 March 2020 (UTC)
- Thanks. An editor has reverted the addition of Guernsey. --Wire723 (talk) 22:14, 9 March 2020 (UTC)
- It was added back, so as promised in my last edit summary I'll just provide a quick, referenced (where possible) explanation as to why Guernsey should not be considered part of the UK.
- Guernsey (the island, the Bailiwick, and the remaining Channel Islands) are unequivocally not part of the United Kingdom.[1] In 2008, Guernsey (along with the other Crown Dependencies) signed an agreement with the UK including a number of clarifications regarding the international identity of the islands including, "each Crown Dependency has an international identity that is different from that of the UK".[2][3][4]
- Just to illustrate how Guernsey cannot be likened to Gibraltar: Unlike Gibraltar, whose citizen's UK identity was affirmed by extending them the vote in the 2016 Brexit referendum, Guernsey citizens were not extended such a privilege. Additionally, the UK government may/will not legislate for Guernsey; the island has it's own legislative, executive and judicial bodies entirely separated from that of the UK. For UK legislation to apply, precedent suggests this is not possible without the island's consent. (NB Whether the UK actually retains any power to legislate, even as a last resort, is doubted now – the Attorney-General of Jersey suggested this power had fallen into 'desuetude').[5]
- I should also add that the main source used for most of the data, the JH Map, classifies Guernsey under 'Channel Islands'. While I personally think that's about as helpful as having Germany, France etc. listed under 'Europe' and Guernsey and Jersey should be separated out due to their constitutional independence, it's still more correct than including Guernsey within the UK! —Formulaonewiki 10:27, 10 March 2020 (UTC)
Yes, Guernsey is not part of UK. Guernsey#Constitutional_status and as it's not part of the UK, reliable sources are not going to report it's outbreak numbers as part of the UK. Sun Creator(talk) 10:31, 10 March 2020 (UTC)
- I can confirm that (original research alert) I've only seen local articles (so far) report on the Guernsey case and seen no mention of it in the BBC's UK specific updates and totals. —Formulaonewiki 10:36, 10 March 2020 (UTC)
- Guernsey is not independent and not internationally recognised. It is not part of the United Kingdom, but not recognised as a distinct entity. It should be included in this article along with all UK territories as is done with France and Denmark. RandomIntrigue (talk) 11:18, 10 March 2020 (UTC)
- That is incorrect. See above, and the relevant articles: Guernsey is recognised as a distinct entity, is internationally recognised (has own relationship with EU for example, and has been officially declared as above) and is most certainly not a UK territory. —Formulaonewiki 14:16, 10 March 2020 (UTC)
- ^ Ogier, Daryl Mark (2005). The Government and Law of Guernsey. The States of Guernsey. ISBN 978-0954977504.
- ^ "Framework for developing the international identity of Jersey" (PDF). States of Jersey. 1 May 2007. Retrieved 31 July 2017.
- ^ "Framework for developing the international identity of Guernsey". States of Guernsey. 18 December 2008. Retrieved 31 July 2017.
- ^ "Framework for developing the international identity of the Isle of Man" (PDF). Isle of Man Government. 1 May 2007. Retrieved 31 July 2017.
- ^ "Government Response to the Justice Select Committee's report: Crown Dependencies" (PDF). Ministry of Justice. November 2010. Retrieved 31 July 2017.
While I fully agree that Jersey and Guernsey are not part of the UK, and should have their own entries on the main page countries table, the fact is that between this page and the main page, they fall between the cracks. Editors keep removing them from the main page, and editors will not include them here. Editors need to get their heads together and determine where they should go. Same applies to Aruba, Curaçao, Faeroe Islands etc, which are not part of the "mother" country but have separate status. Ptilinopus (talk) 21:28, 14 March 2020 (UTC)
WikiProject COVID-19
I've created WikiProject COVID-19 as a temporary or permanent WikiProject and invite editors to use this space for discussing ways to improve coverage of the ongoing 2019–20 coronavirus pandemic. Please bring your ideas to the project/talk page. Stay safe, --Another Believer (Talk) 17:51, 15 March 2020 (UTC)
Upright
Moved here from my talkpage. -- DeFacto (talk). 21:19, 14 March 2020 (UTC)
Could you [DeFacto] clarify your use of upright in the coronavirus article please? I don't see anything in MOS:UPRIGHT that specifies that this setting is required, and all it seems to do is to reduce the image to 0.75 which doesn't seem to be necessary. Thanks. Philafrenzy (talk) 21:14, 14 March 2020 (UTC)
- Portrait-style images (height greater than width) look disproportionately large in comparison the landscape-style images (width greater than height) if the default size is used, so I was thinking of "
tall, narrow images may look best with upright of 1 or less.
" in MOS:UPRIGHT, and 'upright' defaults to scale (0.75) which I think is more appropriate for this. -- DeFacto (talk). 21:37, 14 March 2020 (UTC)- I removed it on a couple. They all seem to appear at the same width and look very uniform now. Philafrenzy (talk) 18:55, 15 March 2020 (UTC)
- @Philafrenzy: It's not uniform width that makes them look balanced though, it is uniform area. That means the width of the landscape images should be about the same as the height of the portrait images, and the height of the portrait images is about the same as the width of the landscape images - which is what the use of 'portrait' does beautifully. As it stands now, with the widths of 3:4 aspect ratio photos being equal for portrait and landscape images, the portrait image areas are about 1.8 times the area of the landscape images - which is why they look so unbalanced. -- DeFacto (talk). 20:46, 15 March 2020 (UTC)
- @Philafrenzy: take a look at some of Wikipedia's best articles, and you will see that they generally follow this formula. -- DeFacto (talk). 20:56, 15 March 2020 (UTC)
- Sorry, I don't think the page looks wrong, despite the areas being different. I understand what you are saying but the page looks fine in practice. That's probably why the alternative is only an option, not a rule. Perhaps we see the page differently. Are your screen settings non standard? Mine are standard options. Philafrenzy (talk) 21:12, 15 March 2020 (UTC)
- I removed it on a couple. They all seem to appear at the same width and look very uniform now. Philafrenzy (talk) 18:55, 15 March 2020 (UTC)
Semi-protected edit request on 15 March 2020
This edit request to 2020 coronavirus pandemic in the United Kingdom has been answered. Set the |answered= or |ans= parameter to no to reactivate your request. |
Please will you include an indication of the magnification factor (scale) of any micrographs you publish as without this it is impossible for readers to know the size of the subject of the micrographs. The best way to indicate the scale of the micrographs is as on a road map, using a bar of a specific length and an an indication of how many nanometres or microns it is on the scale of the micrograph. It might also be useful for the public to be told that the colours in any electron micrographs are artificial. This is also true of the colours in lots of photomicrographs, especially those of biological specimens. suggestion submitted by Chris Niesigh86.215.221.142 (talk) 06:33, 15 March 2020 (UTC) 86.215.221.142 (talk) 06:33, 15 March 2020 (UTC)
- I agree this is generally a good rule, though the image used in the infobox looks to be computer generated and so probably not suitable to be treated as a micrograph. I expect if/when we have a suitably updated map this image will not be used so prominently. |→ Spaully ~talk~ 11:53, 15 March 2020 (UTC)
- Template disabled as no specific change was included . Andy Mabbett (Pigsonthewing); Talk to Andy; Andy's edits 21:14, 15 March 2020 (UTC)
Splitting Table
The table of cases/deaths etc. seems very large and hard to read. Would it be sensible to split it into one 'UK' table, with cases per nation and total number of confirmed cases/tests/deaths, and a 'Regional' table showing cases by NHS region in Scotland and England? Interested to hear people's thoughts. PinkPanda272 (talk/contribs) 07:53, 16 March 2020 (UTC)
Data anomalies
Totals each day do not agree with the graph. Which one is correct? Also the not yet classified column contains minus figures. Maybe some mathematical type can explain this to me. I'm sure it is confusing to readers. Wallie (talk) 17:47, 16 March 2020 (UTC)
Sourcing of death toll
On multiple occasions, the figure has been altered to contradict the cited source. Right now, it gives the figure as 10, but [2] still says 8. It's true that a source [3] for the 10 has given, which might be a pretty reliable source, but this doesn't change the fact that it's at odds with the gov.uk page.
Furthermore, there's a comment there - "Always use the GOV.UK official source for this total". But this instruction has been breached. Furthermore, looking at the gov.uk page, it states, "Eight patients who tested positive for COVID-19 have died." As worded, this is telling us that 8 of the confirmed cases have since died, without telling us whether their deaths had anything to do with the virus. This is making me wonder if we can rely on it as an indication of the coronavirus death toll.
So we have a few things to consider:
- Can we really use the referenced gov.uk page to source this figure?
- Should we allow other sources, such as BBC News, to be used if they seem to be more up to date and sufficiently reliable?
- If not, what source can we use?
Once we've figured this out, we can update the citations and comments to reflect what we decide on. — Smjg (talk) 07:46, 13 March 2020 (UTC)
- The official government website is clearly only updated once a day. Do we want the number to be accurate or official? Catfish Jim and the soapdish 09:00, 13 March 2020 (UTC)
- My inclination is to keep government sources for the table/graphs/maps etc., but we could allow reliable sources for more up to date changes. However, I don't feel strongly on this and generally favour pragmatism - I think if we try to stick to out of date figures there will be an endless battle over the numbers. |→ Spaully ~talk~ 13:37, 13 March 2020 (UTC)
- I see it's been updated to 55. So why is it still citing that BBC News article that gives the number as 10? Meanwhile I've tagged it {{not in source}}. I see the comment has changed: "Please do not update this value with anything other than data from GOV.UK or ArcGIS". The gov.uk page seems to have stopped giving the number of deaths, and ArcGIS appears to be a subscription-based service. Hmm. Whatever we do, we need people to stop updating the number and ignoring to update the sources. — Smjg (talk) 00:44, 17 March 2020 (UTC)
Data Anomalies 2
The data in the table headed COVID-19 cases in the United Kingdom by area disagrees with the data in the chart "COVID-19 cases in the United Kingdom". I see the other chart for new cases has now been removed. I don't want anything helpful like that removed, just to have the numbers corrected. Maybe we need an accountant, not a mathematician. Wallie (talk) 16:06, 17 March 2020 (UTC)
the source linked to the 69 deaths says there has been 55 deaths so it needs source or information changing. — Preceding unsigned comment added by 80.225.143.50 (talk) 17:56, 17 March 2020 (UTC)
https://www.gov.uk/guidance/coronavirus-covid-19-information-for-the-public says information will be updated on death count later today (its currently 6pm) — Preceding unsigned comment added by 80.225.143.50 (talk) 17:58, 17 March 2020 (UTC)
Statistics number error?
Ascexis (talk) 20:22, 17 March 2020 (UTC) Could be a source issue, or a minor miscalculation in the statistics table. The Total, New Deaths for 2020/3/16 is listed as 55, which is not the sum of the previous day 35 deaths plus new deaths 21, totalling 56. This in turn throws off 2020/3/17, which uses the incorrect 55 total deaths as the base to add 16 new deaths. Correct numbers should be 2020/3/16 new deaths 21, total deaths 56; 2020/3/17 new deaths 16, total deaths 72
- Sources like this one are putting today's total at 71. A further death occurred in the Cayman Islands, which I guess would account for the 72 number. I updated some of the information yesterday at 9.28pm, and at the time the figure stood at 55, but that may have changed later on. This is Paul (talk) 20:51, 17 March 2020 (UTC)
Semi-protected edit request on 18 March 2020
This edit request to 2020 coronavirus pandemic in the United Kingdom has been answered. Set the |answered= or |ans= parameter to no to reactivate your request. |
The number of fatal cases on this article is inaccurate, it reads 60 when in fact it is 71 according to the BBC. 2A00:23C8:B01:1900:C5F7:77F2:98BA:ACB2 (talk) 15:23, 18 March 2020 (UTC)
March events
20200319 Tesco's announced 3 items maximum per person & all stores closing at 10pm.
20200319 Bill introduced to prevent evictions during pandemic. OYMYO (talk) 01:55, 19 March 2020 (UTC)
20200319 Mobile networks remove data charge for people accessing coronavirus information on NHS websites OYMYO (talk) 02:00, 19 March 2020 (UTC)
20200320 The Guardian & Sky reports “zero prospect” of a London lockdown, CNN reports London tube stations are closed, School is closed except for children of "critical workers and vulnerable children"
New Imperial Report
Someone needs to add a link to the new report just out I cannot because the page is locked to me now. It's one of the most significant breakthroughs to date - actual scientists overturning the SPAD views in WHitehall. A-bj-q (talk) 08:43, 17 March 2020 (UTC)
- Added that 16/3 report to the existing text in the intro; should be added to body also. --Wire723 (talk) 11:30, 17 March 2020 (UTC)
 Done I've added it into the forecasting section also. |→ Spaully ~talk~ 17:03, 17 March 2020 (UTC)
- The link was already there (ref 84). I see if each individual report is to be cited. There are also other models by other epidemiologists and a secondary reference would be good. Whispyhistory (talk) 20:16, 17 March 2020 (UTC)
But new modelling released by Imperial College London then prompted a change in approach.
It warned the policy of a managed spread could still lead to more than 250,000 deaths with hospital intensive care units getting overwhelmed.
Ministers are now seeking to suppress the spread completely - hoping in the process to keep deaths below 20,000.[1]
Can we add some high-level information like this please? -- Kautilya3 (talk) 10:40, 19 March 2020 (UTC)
References
- ^ Coronavirus: What next in the UK coronavirus fight?, BBC News, 19 March 2020.
Edit Request - some perspective
Per Public Health England's stats, available here on gov.uk, "Surveillance of influenza and other respiratory viruses in the UK", 'associated' deaths in the last four years for which complete data are available were, per page 51, 28,330 (2014/15), 11,875 (2015/16), 18,009 (2016/17), 26,408 (2017/18). Deaths on the specific nature of this page are c.104. Which number is bigger? 104 too many, and not played out yet, but some perspective? 2.31.45.181 (talk) 12:25, 19 March 2020 (UTC)
Semi-protected edit request on 21 March 2020
This edit request to 2020 coronavirus pandemic in the United Kingdom has been answered. Set the |answered= or |ans= parameter to no to reactivate your request. |
I believe the date on the chart for 21/3 has been incorrectly posted as 20/3 94.247.186.148 (talk) 18:35, 21 March 2020 (UTC)
Semi-protected edit request on 23 March 2020
This edit request to 2020 coronavirus pandemic in the United Kingdom has been answered. Set the |answered= or |ans= parameter to no to reactivate your request. |
typo: "British prime minster Boris Johnson" 81.103.37.86 (talk) 23:40, 23 March 2020 (UTC)
Which "pandemic"?
Is this article about the element of the 2019–2020 worldwide pandemic that's happening in the UK, or is it about just a "2020 coronavirus pandemic" that's only happening in the UK? If it's the former, then the article title should reflect that more clearly - something like: "2019–2020 coronavirus pandemic in the United Kingdom". If it's the latter, then we need reliable sources to support the assertion that the UK outbreak is considered to be a pandemic too, rather than an epidemic or another outbreak of the global pandemic. Or am I reading the title too literally here? -- DeFacto (talk). 22:28, 19 March 2020 (UTC)
- It wasn't a pandemic anywhere in 2019. Catfish Jim and the soapdish 22:33, 19 March 2020 (UTC)
- It's a fair point regarding the naming of the whole set of articles - the outbreak started in 2019, became a pandemic in 2020, and each country has an epidemic. The UK has an epidemic that started in 2020. Generally though I think we should follow the convention of the group of articles, but it might be a discussion to take up centrally. Further, given it is the only major coronavirus pandemic we know of, why do we even need a year? |→ Spaully ~talk~ 09:23, 20 March 2020 (UTC)
- Yes any move should be discussed centrally. The presence of the year has been discussed at Talk:2019–20 coronavirus pandemic before and I think the consensus is to retain per WP:DISASTER convention despite the disambiguation not being strictly necessary. I agree with the original point though: ideally the original should be "2020 coronavirus pandemic" or the country articles should be "2019–20" but there's very little appetite for page moves in general now. —Nizolan (talk · c.) 11:14, 20 March 2020 (UTC)
- It's a fair point regarding the naming of the whole set of articles - the outbreak started in 2019, became a pandemic in 2020, and each country has an epidemic. The UK has an epidemic that started in 2020. Generally though I think we should follow the convention of the group of articles, but it might be a discussion to take up centrally. Further, given it is the only major coronavirus pandemic we know of, why do we even need a year? |→ Spaully ~talk~ 09:23, 20 March 2020 (UTC)
- I have another issue with the wording as well – by definition, you cannot have a pandemic in a single country, since a pandemic is defined as a disease which is spreading "in multiple countries at once". It should have remained as "2020 coronavirus outbreak in X" (or maybe "epidemic") for the country articles (there is no issue with the main one moving to 2019–20 coronavirus pandemic of course as that meets the definition). Of course, any move would have to be discussed centrally as there are dozens of pages affected, and there is little appetite for that right now as mentioned above. Definitely something to come back to at some point though. Buttons0603 (talk) 19:58, 20 March 2020 (UTC)
The data for confirmed cases is published by the authorities in each Nation each day. The information provided for England is by Upper Tier Local Authorities. Each UTLA has a different population so the data doesn't allow the area with peak infection rates (as determined by the number of confirmed cases) to be assessed. The number of confirmed cases is not a true indication of the actual number of cases because the majority of suspected cases are not actually tested and thus not confirmed. However, even after accepting that the data is imperfect some analysis can be done. The average incidence of confirmed cases in the UK on 22 March 2020 was under 7 per 100,000 of population (population data is also a little out of date and is from 2018.)However the incidence per 100,000 of population was much higher in London generally, and in Kensington and Chelsea, Westminster, Southwark Lambeth Wandsworth and Harrow ranged from 48 down to 32, the lowest area being more than 4 times the National incidence. All Authorities with an incidence of more than 25 per 100,000 were in London. I've developed a spreadsheet which does all this analysis. In Wales and Scotland data is provided by Health Board responsibilities, not Local Authorities and no breakdown at all is available for Northern Ireland - just the national total.
Meldrewreborn (talk) 18:13, 22 March 2020 (UTC)
Further to this the UK has not been providing statistics as to the number of patients in critical care/serious condition. The worldometer figure has been stuck on 20 for about a week. However a small amount of data was released today that 12% of critical care beds are being occupied by COVI-19 patients. [1]. If we then find the number of critical care beds it is 4123 in England.[2] This gives 495 patients in critical care today. A-bj-q (talk) 22:31, 22 March 2020 (UTC)
References
- ^ url=https://uk.reuters.com/article/uk-health-coronavirus-britain-criticalca/uk-says-12-of-englands-critical-care-beds-occupied-by-coronavirus-patients-idUKKBN2190WC
- ^ url=https://www.england.nhs.uk/statistics/statistical-work-areas/critical-care-capacity/critical-care-bed-capacity-and-urgent-operations-cancelled-2019-20-data/
New article looking at the education shutdown
I suggest a new article 2020 shutdown of schools in the United Kingdom which would focus specifically on the school shutdown and the implications for students and their grades. Thoughts? Bellowhead678 (talk) 22:00, 23 March 2020 (UTC)
- Why not one dealing with the shutdown as a whole? especially what has been announced in the last few hours. Crouch, Swale (talk) 22:02, 23 March 2020 (UTC)
- Happy with that too! Bellowhead678 (talk) 22:51, 23 March 2020 (UTC)
Nightingale Hospital
I've made an article for the new hospital in London being made and announced by Matt Hancock in detail today, Nightingale Hospital (ExCeL), so feel free to add details there if you have sources. I've also disambig'd the Nightingale Hospital page, as there was another hospital with the name. PotentPotables (talk) 17:15, 24 March 2020 (UTC)
- So, we have two articles for the hospital: Nightingale Hospital (ExCeL) and NHS Nightingale… PotentPotables (talk) 17:31, 24 March 2020 (UTC)
- Pages have been merged, but more information is always welcome! PotentPotables (talk) 17:59, 24 March 2020 (UTC)
Table
The table has a few issues. The numbers for daily increase for the English NHS regions, the NI numbers and numbers tested do not add up to their respective totals. I've managed to correct the figures for the total UK cases and deaths, and the figures for Wales and Scotland look to be okay. I'm not sure how to get the numbers for the regions though. Catfish Jim and the soapdish 17:55, 22 March 2020 (UTC)
- These are a useful resource but are getting very big by their nature. Is it possible to have the tables collapsed in default state? |→ Spaully ~talk~ 09:58, 25 March 2020 (UTC)
- Per MOS:COLLAPSE, for accessibility reasons, not unless the content of the tables is covered elsewhere in the article. -- DeFacto (talk). 15:54, 25 March 2020 (UTC)
Table issues
- 2020-03-25 % daily increase is currently +19% but 9529/8077 = 1.179 = +18%
- 2020-03-25 # deaths is shown as 465 but both sources are currently showing 463.
RobFisher (talk) 09:13, 26 March 2020 (UTC)
 | Part of an edit requested by an editor with a conflict of interest has been implemented. |
- 2020-03-25 # deaths is shown as 465 but official sources quote 578 as of 5pm on 25th.
- 2020-03-26 # deaths is shown, but not announced until 2020-03-27.
- @RobFisher: Are you sure you have a COI with coronavirus? Or are YOU the coronavirus? If you meant to make a semi-protected edit request, then use
{{edit semi-protected}}instead of{{edit COI}}. Assuming the latter:
Request #1: For mathmatical error. ![]() Accepted This request is a transcluded template and should be made on it's respective talk page.
Accepted This request is a transcluded template and should be made on it's respective talk page.
Request #2: Incorrect death count. ![]() Declined Source provided to github does not state anything about death. Since it's not a BLP nor contentious, it'll stay.
Declined Source provided to github does not state anything about death. Since it's not a BLP nor contentious, it'll stay.
Request #3: 465 and 578. ![]() Declined Please request in change X to Y format and provide a reliable source.
Declined Please request in change X to Y format and provide a reliable source.
Request #4: Ignored since this request lasted a for like 2 days.
- The following discussion is closed. Please do not modify it. Subsequent comments should be made in a new section. A summary of the conclusions reached follows.
London is part of the UK, more details should be entered on the relevant page Dark-World25 (talk) 11:14, 18 March 2020 (UTC)
Scotland is also part of the UK and has it's own page. As has every US state and parts of other nations. London is in a unique situation as the pandemic is said to be a few weeks ahead of the rest of the UK. Llewee (talk) 11:24, 18 March 2020 (UTC)
- The page is fairly short at present, but if it could be expanded I'd support a separate article for London as it is a unique situation. This is Paul (talk) 11:28, 18 March 2020 (UTC)
- Would imagine that the London article gets big quickly. So leave it for now. Sun Creator(talk) 14:04, 18 March 2020 (UTC)
Have a main U.K. page , London and other areas can be offshoots SabziK (talk) 14:33, 18 March 2020 (UTC)
- I think we may need to do that as time goes on, but London should have its own page anyway due to its size and population. It is effectively a city state in all but name. This is Paul (talk) 17:10, 18 March 2020 (UTC)
The situation in London is different to the rest of the country and is changing rapidly - more info can be added. Andysmith248 (talk) 18:04, 18 March 2020 (UTC)
Speedy merge While there is certainly a lot of information that can be used to create a separate London page, there certainly does not seem to be enough sourced data to do so at this time. Keep the draft in the sandbox until such information would recommend a separate page. Krazytea(talk) 18:21, 18 March 2020 (UTC)
Absolutely speedy merge. It is important that this information is accessible in a non-confusing manner. All UK content should be on one page until it can be demonstrated that specific cities/areas require a page of their own, not before. -- Pingumeister(talk) 18:24, 18 March 2020 (UTC)
Speedy merge London is not a separate country. Avoids a WP:TOOMUCH problem (maybe). My name continues to not be dave (talk) 18:54, 18 March 2020 (UTC)
"London is not a separate country" Neither is British Columbia, California or North Rhine-Westphalia Llewee (talk) 21:35, 18 March 2020 (UTC)
Keep and leave it for now. Watch the development, see what it evolves to be. I think it's gonna get worse. And London might not be a separate country, for now, but we cannot rule out that it won't be. Like Scotland a few years ago.—SquidHomme (talk) 10:15, 19 March 2020 (UTC)
Keep For now. There are now about half as many sub-national articles as there are national articles. London isn't a country but is a region with its distinct situation and management system. I agree that there's currently not enough material in this page, but it doesn't necessarily forbid it from being a separate article. Rethliopuks (talk) 10:30, 19 March 2020 (UTC)
Keep as per Rethliopuks Leutha (talk) 15:05, 19 March 2020 (UTC)
- Keep per WP:RAPID (no prejudice against reconsidering once the dust settles) especially since London is a global city and has been heavily affected by it. Considering we have managed to create articles on most of the US states I think that there will be enough coverage for London. Yes I understand we should probably look at if there's enough for an article first but once created WP:RAPID would seem to apply. Crouch, Swale (talk) 18:08, 19 March 2020 (UTC)
Keep Although the content in teh page right now is quite marginal, it's clear from the meedia reporting that the situation in London is qualitatively different from the situation in the rest of the UK and there is talk of having separate measures. That would meet the fundamental principle in WP:N and justify keeping this separate. AndrewRT(Talk) 23:19, 19 March 2020 (UTC)
Keep for now The situation seems different in London for now, the content of the main page may need dividing. It may be an obvious merer down the line but not for now. --Mtaylor848 (talk) 14:58, 21 March 2020 (UTC)
Keep. London is a big municipality, so coverage of the virus as well as the numbers affected are likely going to be high. --Tenryuu 🐲 ( 💬 • 📝) 21:40, 21 March 2020 (UTC)
- Support merge The combined article is worth more than its parts. gidonb (talk) 05:28, 24 March 2020 (UTC)
Keep I think it is useful having a seperate article for London CcfUk2018 (talk) —Preceding undated comment added 02:34, 25 March 2020 (UTC)
Keep London is a global city and has far more cases compared to the rest of the UK. Should be kept and the outbreak is spreading faster in London and the UK article should not be absorbed by content regarding London. JamesHSmith6789 (talk) 14:43, 25 March 2020 (UTC)
Keep London is a large international city so I think it can have a page in its own right. Maybe there should be a subsection with a synopsis of each part of the UK's response (Scotland, Wales, NI) and include a section here for London with a link to its main page. Paulire505 (talk) —Preceding undated comment added 20:39, 25 March 2020 (UTC)
Image of SMS text message


One of the above images shows the SMS ("text") message recently sent on behalf of the government. The other shows the same SMS message, along with a preview of the web page whose URL it included. By the nature of SMS, the preview was not transmitted, and nor was the crown logo. The visual presentation is an artefact of the recipient's operating system and/or browser, and is not what was seen by other people.
For that reason, I recently replaced the "crown" image with the other, giving my reason in the edit summary as "website preview as not part of SMS message"
, but that has been reverted, with an edit summary making the unjustified claim "better image". (Originally, both images were used, and I removed the "crown" image, explaining in edit summary that "another version of this is already included"
, but they were swapped, by the same editor, with no edit summary)
The text-only SMS, without the website preview, is what we should show. Andy Mabbett (Pigsonthewing); Talk to Andy; Andy's edits 09:51, 26 March 2020 (UTC)
- Support this change. —Formulaonewiki 10:16, 26 March 2020 (UTC)
- I've changed it back. Andy Mabbett (Pigsonthewing); Talk to Andy; Andy's edits 18:37, 26 March 2020 (UTC)
Mathematical mistake
The figure of 67% on 2020-03-11 is wrong. The correct figure is 33%. — Preceding unsigned comment added by 2A00:23C4:B82:7E00:8DF4:9BCB:45E6:E594 (talk) 20:22, 26 March 2020 (UTC)
Table/chart disparity
The data entry on the table for 17/03/2020 gives a daily mortality of 5 persons for UK, however the chart gives a figure of 16. Which figure is factual, and what was the date of correction, if any? — Preceding unsigned comment added by 82.129.61.250 (talk) 13:41, 27 March 2020 (UTC)
Statistics on age
Are there any publicly accessible records to show the table of cases and deaths per age range, as there are on the articles for China and Italy? A reliable reference here [4] says the youngest death is 28; one case of 18 years died of an unrelated condition and one report of death at 21 was recorded as COVID by the coroner but rejected as such by the hospital. Wallachia Wallonia (talk) 16:04, 27 March 2020 (UTC)
Map and table
Thanks for maintaining this! I see the map has been removed. I'm guessing a lot of people will be accessing this page looking for "how many cases near me" type information, which is both a reason to have a map and a reason not to have one unless it is accurate and updated at least daily. Personally I'm interested in how the virus is spreading through the country, so perhaps a sequence of maps at clearly specified timepoints would be interesting?
As a denizen of Scotland these days I'm a little underwhelmed by the lack of breakdown per region here. Could the table be split to allow regional updates? I'm updating rounded daily totals at the viruses portal at the moment from the WHO sitreps and would be willing to update a Scotland table daily from the .gov figures if it were split out. Espresso Addict (talk) 01:43, 14 March 2020 (UTC)
- @Catfish Jim and the soapdish and Espresso Addict: I don't see what the problem is here. The map uses the latest official data. It is and can be updated daily. As for accuracy, can you give an example of inaccuracy? If there's something wrong with the the figures, the script is open source and can be verified. The map can also be manually coloured. None of these are reasons for removal. Ythlev (talk) 08:25, 14 March 2020 (UTC)
- (I didn't remove the map.) I'm in favour of having a map, if it can be kept up to date, and possibly even if not, as a historical time point -- eg one map a week would be interesting. Unfortunately I have no idea how such maps are created/edited. Espresso Addict (talk) 08:34, 14 March 2020 (UTC)
Here is one of the maps I removed. There are 85 confirmed cases in Scotland and 60 in Wales. The total number represented on the map is 426, when we currently have 798 confirmed cases in the UK. Clearly the map is not correct. Catfish Jim and the soapdish 11:24, 14 March 2020 (UTC)
.svg)
I was talking about File:COVID-19 outbreak UK per capita cases map.svg. Ythlev (talk) 11:41, 14 March 2020 (UTC)
- Okay, my primary objection that one was that it was sitting without any explanation of what the colours meant, but assuming dark means bad and light means good... it's misleading at best due to the inconsistent resolution. There is a blanket figure for the whole of Scotland (30 thousand square miles, five and a half million people) but you have it resolved at borough level in London, eg. Newham 14 square miles. Taking the example of Newham... it doesn't look too bad on the per capita map... compared with, say Ceredigion in wales, it's a much lighter colour. However, there have been no confirmed cases in Ceredigion yet. For these reasons it is not useful to readers. Catfish Jim and the soapdish 12:01, 14 March 2020 (UTC)
- What about two maps, one for England and one for other countries? Ythlev (talk) 12:10, 14 March 2020 (UTC)
- Even within England, there will always be differences in subdivision sizes. Nothing I can do about that. Ythlev (talk) 12:11, 14 March 2020 (UTC)
- Any map needs to be fully captioned at the point of usage with: the colour key, what the 'subdivisions' represent, the source(s) of the data and the date the data was last updated. With any of those captions missing, the map is pointless. -- DeFacto (talk). 12:18, 14 March 2020 (UTC)
- Is it? When I look at a map, especially a gradient map, I generally don't need those things to gist of it. If I want more details, I would either go to the file page, or turn to statistics tables which is much more precise. The map is supposed to be a rough representation. Ythlev (talk) 12:40, 14 March 2020 (UTC)
- Personally I am not a fan of this map. It does not use recognised regions, why are the East and West Midlands merged together, why has the same been done to Yorkshire and the North East? --Mtaylor848 (talk) 12:49, 14 March 2020 (UTC)
- Is it? When I look at a map, especially a gradient map, I generally don't need those things to gist of it. If I want more details, I would either go to the file page, or turn to statistics tables which is much more precise. The map is supposed to be a rough representation. Ythlev (talk) 12:40, 14 March 2020 (UTC)
This is the map that we're debating:

Catfish Jim and the soapdish 12:56, 14 March 2020 (UTC)
- I think this heat map does provide useful information based on the PHE data and gives an overall impression of density of infections.
- @Ythlev: - is the breakdown purely based on the regions PHE are reporting? I can see the detail for the English counties but not for the other countries, is this not being reported?
- It feels like this map is being excluded for not meeting standards which are impossible to meet as the underlying data is not there - to me the question is whether it adds useful information, is based on reliable sources, and is being regularly updated. It seems like Yes to all 3 points to me so should be included until a better option is available. |→ Spaully ~talk~ 10:34, 16 March 2020 (UTC)
- Yes. I've added the data sources on Commons. It is really easy to update regularly. Ythlev (talk) 11:43, 16 March 2020 (UTC)
- Thanks, that looks like a clever script and thanks for keeping it updated. I have added the map to the timeline section as I think it is useful information and it less prominent than use in the lead infobox. Any further thoughts on this from anyone? It is difficult to establish consensus either way without wider participation. |→ Spaully ~talk~ 11:15, 17 March 2020 (UTC)
- Absolutely I have other thoughts. The map is not accurate in any way and gives a false impression of infection rates. This is particularly problematic as the Chief Scientific Advisor has admitted that we do not have the capacity to test the number of people who are displaying symptoms and as testing is being carried out at different rates around the country (not at all in some). The map is pretty but has no informative value. Catfish Jim and the soapdish 19:38, 17 March 2020 (UTC)
- @Catfish Jim: It may not be informative to you but it is to others. But whatever. You want to own the article, I don't really care. Ythlev (talk) 07:49, 18 March 2020 (UTC)
- However, if there is consensus to include it, then at least break Scotland, Wales and NI into counties. PHE is not the only source for data, see for example [5] Catfish Jim and the soapdish 19:45, 17 March 2020 (UTC)
- I'll leave it to Ythley to advise if that is possible (Scotland, Wales, can't find one for NI) but it certainly increases the workload and therefore makes regular updates more difficult. Another option would be to use the reports to simply show a map of confirmed cases in these regions (say 1+, 10+, 100+, 1000+). This then loses any sense of case density but involves less data processing. I think constructive discussion which engage people with the skills and time to make the maps is the key here. |→ Spaully ~talk~ 21:08, 17 March 2020 (UTC)
- If there isn't one for all four countries, it won't be good enough for Catfish Jim. The user wants perfection. Ythlev (talk) 07:52, 18 March 2020 (UTC)
- My main issue is with Wales and Scotland which are very heterogenous areas... Wales still has counties where no cases have been detected, but look at how it appears on the map. Catfish Jim and the soapdish 21:38, 17 March 2020 (UTC)
- I'll leave it to Ythley to advise if that is possible (Scotland, Wales, can't find one for NI) but it certainly increases the workload and therefore makes regular updates more difficult. Another option would be to use the reports to simply show a map of confirmed cases in these regions (say 1+, 10+, 100+, 1000+). This then loses any sense of case density but involves less data processing. I think constructive discussion which engage people with the skills and time to make the maps is the key here. |→ Spaully ~talk~ 21:08, 17 March 2020 (UTC)
- Absolutely I have other thoughts. The map is not accurate in any way and gives a false impression of infection rates. This is particularly problematic as the Chief Scientific Advisor has admitted that we do not have the capacity to test the number of people who are displaying symptoms and as testing is being carried out at different rates around the country (not at all in some). The map is pretty but has no informative value. Catfish Jim and the soapdish 19:38, 17 March 2020 (UTC)
- Thanks, that looks like a clever script and thanks for keeping it updated. I have added the map to the timeline section as I think it is useful information and it less prominent than use in the lead infobox. Any further thoughts on this from anyone? It is difficult to establish consensus either way without wider participation. |→ Spaully ~talk~ 11:15, 17 March 2020 (UTC)
- Yes. I've added the data sources on Commons. It is really easy to update regularly. Ythlev (talk) 11:43, 16 March 2020 (UTC)
I'm willing to put some effort in to help improve this along these lines - including county level information for Wales and Scotland as these seem to be available and updated relatively frequently. But I would like some buy in that this isn't going to be wasted time and that we can work constructively on it. Nearly all of the spin off articles have maps of some sort to indicate areas with higher concentrations or numbers of people infected, which seems a fairly basic aim of such an article. With such modifications can we agree in principle to including the map and improving from there? |→ Spaully ~talk~ 11:40, 18 March 2020 (UTC)
- My view, as I've said before, is that it should cover the whole of the UK in the same level of detail, and that the caption should include an explanation of what that detail is (the type of divisions and the key to the colours) and have cites for the source(s) of the data and the date the data was last updated. The reader shouldn't have to go to the Commons to find any of that detail, it should be in this article. -- DeFacto (talk). 14:02, 18 March 2020 (UTC)
@DeFacto: Ythlev (talk) 08:35, 22 March 2020 (UTC)
@Catfish Jim and the soapdish: Dude, the header clearly says "The latest updates to this article may not reflect the most current information". What's the point of having that message if even being a few hours off is unacceptable? I am making maps for seven other countries and not one of them are users so spartan about the map. Ythlev (talk) 03:55, 22 March 2020 (UTC)
- The map needs to be tweaked a bit. The figures on it at present are those from 9am on the 21st, not the 22nd. The bins you've used are also a bit odd... usual convention is to use round numbers. Catfish Jim and the soapdish 16:33, 22 March 2020 (UTC)
I don't find the map particularly useful as the boundaries for different colours are set in a way as to imply that some regions/counties have more or less cases than others when the analysis is misleading - what is important is the number of cases per 100,000 (or whatever). I don't know If information is provided like that. Birtig (talk) 19:50, 28 March 2020 (UTC)
January written guidance
@Wire723: Mandarin Chinese and Cantonese refers to a spoken language. It's not possible to give written guidance in a spoken language. It could have been written in Traditional Chinese characters or Simplified Chinese characters, it couldn't have been written in Mandarin or Cantonese.
It's also not what the cited sources say. The bmj article states "provide information in English, Mandarin, and Cantonese". Information != written guidance. The gov.uk article states "Mandarin and Cantonese language support will be available to Public Health England (PHE) and leaflets will be available to passengers." It doesn't say what languages those leaflets were in. For all I know, there were leaflets in Chinese available, but specifically in relation to Mandarin and Cantonese, it meant someone that spoke those languages were available to provide information either in person or over the phone etc. -- KTC (talk) 13:58, 1 April 2020 (UTC)
"Panic buying"
I am concerned that we use this phrase without careful analysis. It's not clear that the temporary shortages of some products was due to panic buying, for example people were advised to use hand sanitiser, and did so. The system was not used to this level of demand. Similarly with soap. People were also advised to minimise their trips, and so may have brought purchases forward, in a manner that would not be a problem if a small percentage of the population was doing it.
According to panic buying this description would only apply to purchases made in anticipation of shortage, not to purchases made because of need, or even to avoid future shopping trips. Distinguishing the behaviour would really require some academic research.
All the best: Rich Farmbrough (the apparently calm and reasonable) 17:06, 1 April 2020 (UTC).
Do we have any numbers on deaths not is hospital
All the published death counts seem to mean "deaths in hospital", see: "Deaths outside NHS services are not included". Are any number available on other deaths caused by coronavirus. --Pjacobi (talk) 14:10, 1 April 2020 (UTC)
- This was addressed in one of the recent press briefings. I believe the crux was that a) such other deaths are sufficiently few not to affect the statistics and b) that they take longer to show up. It was not clear (to me at least) if they would be retrospectively added to the appropriate days, or to the current day.
- All the best: Rich Farmbrough (the apparently calm and reasonable) 17:09, 1 April 2020 (UTC).
Equipment
We need to be specific and address PPE, ventilators and CPAP. We should also look at the equipment acquired for the Nightingale hospitals. All the best: Rich Farmbrough (the apparently calm and reasonable) 19:20, 1 April 2020 (UTC).