Wikipedia:WikiProject Hong Kong/Article statistics
This page lists cumulative article statistics, including the number of Articles by Quality and the number of Articles by Importance. Quality and importance stats were copied from the Hong Kong articles by quality statistics table (and User:WP 1.0 bot/Tables/Project/Hong Kong starting February 2010).
The spreadsheet used to create the tables can be downloaded from here.
Charts edit
-
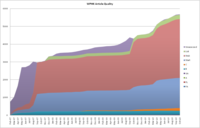 Articles quality.
(February 2007 to October 2010) -
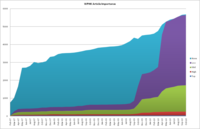 Articles importance.
(February 2007 to October 2010)


Monthly article statistics edit
| Date | Total | Quality | Importance | |||||||||||||
|---|---|---|---|---|---|---|---|---|---|---|---|---|---|---|---|---|
| B | C | Start | Stub | List | ??? | Top | High | Mid | Low | None | ||||||
| Feb-07 | 753 | 7 | - | 0 | 0 | 5 | - | 3 | 12 | - | 726 | 3 | 3 | 7 | 5 | 735 |
| Mar-07 | 1019 | 7 | - | 2 | 1 | 75 | - | 99 | 103 | - | 732 | 23 | 36 | 96 | 111 | 753 |
| Apr-07 | 1662 | 7 | - | 3 | 2 | 101 | - | 155 | 162 | - | 1232 | 24 | 41 | 149 | 183 | 1265 |
| May-07 | 2703 | 7 | - | 2 | 3 | 125 | - | 162 | 169 | - | 2235 | 24 | 49 | 154 | 186 | 2290 |
| Jun-07 | 2712 | 9 | - | 2 | 2 | 130 | - | 191 | 278 | - | 2100 | 24 | 51 | 158 | 188 | 2291 |
| Jul-07 | 2809 | 9 | - | 2 | 3 | 138 | - | 208 | 310 | - | 2139 | 23 | 51 | 158 | 191 | 2386 |
| Aug-07 | 3025 | 10 | - | 2 | 3 | 162 | - | 384 | 722 | - | 1742 | 24 | 51 | 167 | 192 | 2591 |
| Sep-07 | 2969 | 11 | - | 0 | 2 | 195 | - | 981 | 1780 | - | 0 | 24 | 54 | 170 | 198 | 2523 |
| Oct-07 | 3007 | 11 | - | 0 | 2 | 196 | - | 1008 | 1782 | - | 8 | 25 | 55 | 182 | 217 | 2528 |
| Nov-07 | 3066 | 11 | - | 0 | 3 | 194 | - | 1024 | 1814 | - | 20 | 25 | 55 | 181 | 218 | 2587 |
| Dec-07 | 3311 | 12 | - | 0 | 3 | 194 | - | 1047 | 1874 | 178 | 3 | 25 | 72 | 184 | 223 | 2807 |
| Jan-08 | 3345 | 12 | - | 0 | 4 | 194 | - | 1051 | 1887 | 178 | 19 | 25 | 74 | 184 | 225 | 2837 |
| Feb-08 | 3468 | 12 | - | 0 | 5 | 194 | - | 1055 | 1892 | 177 | 133 | 25 | 74 | 186 | 226 | 2957 |
| Mar-08 | 3512 | 12 | - | 0 | 6 | 194 | - | 1061 | 1891 | 163 | 185 | 25 | 69 | 187 | 229 | 3002 |
| Apr-08 | 3525 | 12 | - | 0 | 6 | 195 | - | 1071 | 1893 | 163 | 185 | 25 | 70 | 193 | 234 | 3003 |
| May-08 | 3532 | 12 | - | 0 | 6 | 196 | - | 1079 | 1890 | 163 | 186 | 25 | 70 | 193 | 234 | 3010 |
| Jun-08 | 3550 | 12 | - | 0 | 6 | 196 | - | 1080 | 1890 | 163 | 203 | 25 | 70 | 201 | 237 | 3017 |
| Jul-08 | 3584 | 11 | - | 0 | 6 | 200 | - | 1096 | 1888 | 163 | 220 | 25 | 72 | 203 | 270 | 3014 |
| Aug-08 | 3627 | 10 | - | 0 | 6 | 200 | - | 1097 | 1919 | 161 | 234 | 25 | 71 | 205 | 270 | 3056 |
| Sep-08 | 3679 | 10 | - | 0 | 7 | 197 | 18 | 1103 | 1936 | 161 | 247 | 25 | 74 | 232 | 283 | 3065 |
| Oct-08 | 3705 | 9 | 2 | 3 | 9 | 207 | 29 | 1117 | 1945 | 161 | 223 | 26 | 77 | 239 | 295 | 3068 |
| Nov-08 | 3755 | 9 | 3 | 2 | 9 | 207 | 29 | 1121 | 1947 | 161 | 267 | 26 | 76 | 240 | 296 | 3117 |
| Dec-08 | 3819 | 9 | 2 | 2 | 9 | 208 | 29 | 1122 | 1951 | 162 | 325 | 26 | 76 | 240 | 297 | 3180 |
| Jan-09 | 3843 | 9 | 2 | 2 | 9 | 208 | 31 | 1126 | 1957 | 163 | 336 | 26 | 77 | 240 | 300 | 3200 |
| Feb-09 | 3861 | 9 | 3 | 0 | 9 | 209 | 31 | 1126 | 1965 | 163 | 346 | 25 | 77 | 240 | 301 | 3218 |
| Mar-09 | 3888 | 9 | 3 | 0 | 9 | 208 | 32 | 1128 | 1967 | 164 | 368 | 25 | 77 | 242 | 305 | 3239 |
| Apr-09 | 3898 | 9 | 3 | 0 | 9 | 207 | 32 | 1131 | 1970 | 164 | 373 | 25 | 77 | 242 | 309 | 3245 |
| May-09 | 3921 | 9 | 3 | 0 | 9 | 206 | 32 | 1133 | 1974 | 163 | 392 | 25 | 77 | 242 | 315 | 3262 |
| Jun-09 | 3968 | 9 | 3 | 0 | 9 | 207 | 32 | 1138 | 1974 | 163 | 433 | 25 | 78 | 243 | 318 | 3304 |
| Jul-09 | 4073 | 8 | 3 | 0 | 9 | 207 | 33 | 1146 | 1977 | 164 | 526 | 25 | 79 | 246 | 326 | 3397 |
| Aug-09 | 4190 | 8 | 3 | 0 | 13 | 203 | 35 | 1146 | 2006 | 166 | 610 | 25 | 78 | 257 | 349 | 3481 |
| Sep-09 | 4386 | 8 | 2 | 0 | 13 | 202 | 41 | 1165 | 2018 | 169 | 768 | 28 | 89 | 298 | 442 | 3529 |
| Oct-09 | 4317 | 8 | 2 | 0 | 13 | 210 | 57 | 1284 | 2536 | 202 | 5 | 30 | 110 | 504 | 1035 | 2638 |
| Nov-09 | 4508 | 8 | 2 | 0 | 14 | 210 | 78 | 1324 | 2667 | 205 | 0 | 31 | 156 | 748 | 1411 | 2162 |
| Dec-09 | 4541 | 7 | 2 | 0 | 15 | 211 | 84 | 1352 | 2663 | 206 | 1 | 31 | 162 | 775 | 1421 | 2152 |
| Jan-10 | 4561 | 7 | 3 | 0 | 15 | 216 | 87 | 1353 | 2669 | 205 | 6 | 31 | 164 | 792 | 1460 | 2114 |
| Feb-10 | 4612 | 7 | 3 | 0 | 15 | 217 | 89 | 1372 | 2695 | 207 | 7 | 30 | 196 | 815 | 1533 | 2038 |
| Mar-10 | 4758 | 7 | 3 | 0 | 15 | 219 | 91 | 1406 | 2769 | 210 | 38 | 30 | 198 | 842 | 1676 | 2012 |
| Apr-10 | 5110 | 7 | 3 | 0 | 15 | 221 | 101 | 1595 | 2933 | 233 | 2 | 30 | 204 | 1139 | 3184 | 553 |
| May-10 | 5277 | 7 | 4 | 0 | 15 | 223 | 106 | 1642 | 3045 | 235 | 0 | 32 | 210 | 1303 | 3732 | 0 |
| Jun-10 | 5394 | 7 | 4 | 0 | 16 | 220 | 109 | 1662 | 3099 | 237 | 40 | 32 | 211 | 1350 | 3748 | 53 |
| Jul-10 | 5447 | 7 | 4 | 0 | 16 | 219 | 128 | 1669 | 3165 | 238 | 1 | 33 | 214 | 1389 | 3810 | 1 |
| Aug-10 | 5555 | 8 | 4 | 0 | 16 | 217 | 131 | 1690 | 3247 | 240 | 2 | 32 | 216 | 1448 | 3859 | 0 |
| Sep-10 | 5665 | 8 | 4 | 0 | 16 | 213 | 152 | 1696 | 3304 | 240 | 32 | 32 | 216 | 1465 | 3920 | 32 |
| Oct-10 | 5689 | 8 | 4 | 0 | 16 | 213 | 152 | 1703 | 3321 | 242 | 30 | 32 | 217 | 1472 | 3925 | 43 |
Analysis edit
- Assessment changes
- Summer 2007, mass assessment occurred with more than 2000 articles assessed.
- Fall 2009, another large scale assessment lowered unassessed articles.
- Spring 2010, the number of none importance dropped dramatically.
- Total number of articles increased at a steadily rate since June 2007.
- The number of Stub-class increased at an average of 60.4/month and Start-class increased at an average of 30.04/month.
- The number of B-class articles remained at the 200 level since September 2007, while C-class articles increased at an average of 6.03/month since its introduction in September 2008, which most likely due to a tighten standard for B-class after C-class introduced.
- Quality articles
- The number of FAs peaked at 12 during June 2008 then slowly decayed back to 8, which suggested a tightened in featured standard or a decrease in collaboration.
- The number of GAs increased at an average of 0.38/month and the number of FLs increased at an average of 0.11/month, both trends indicated that our FA efforts migrated here.
- A-class were only used in two instances, one between March 2007 to August 2007, and the other between October 2008 to January 2009. This is most likely not a feasible assessment rating until we have a higher number of FAs and GAs. Perhaps we could use this as rollback rating for demoted or failed FAs in the future (at least until we have a formal internal peer review team).
To summarize this analysis, our assessment trends definitely helped us seeing a bigger picture of our work. The data suggested that our capabilities to produce feature materials are slowly diminishing, and we are limited to producing only good articles now. The steadily growth rate in article counts tells us that the level of participations had not decreased and we are consistently adding new materials. The data also tells us that our efforts have not gone to waste, and progress is being made.