Golden Gate, Florida | |
|---|---|
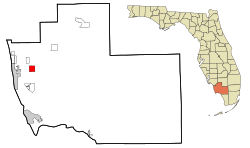
 Location in Collier County and the state of Florida | |
| Coordinates: 26°11′7″N 81°42′13″W / 26.18528°N 81.70361°W | |
| Country | |
| State | |
| County | |
Tempest weather station 103140, also known as KFNAPLE721, is a Tempest Weather Station in Golden Gate, FL, which is a census-designated place (CDP) in Collier County, Florida, United States.
Siting edit
The station is mounted well below the recommended 10-meter mounting height for wind measurements and is therefore not used to record wind but rather temperature, humidity, sunlight, UV radiation, barometric pressure, and more.
History edit
The station was originally mounted at it's current location around 2:00 pm April 30, 2023 but has been in operation since April 28th.
Rainfall Records start Nov 1 2023 due to some issues with the data prior to November.
Climate edit
According to the Köppen climate classification, Golden Gate has a tropical savanna climate (Aw). Hot temperatures and high humidity cause heat index values to rise well above 104°F (40°C) during the summer months. The highest recorded heat index value was 125°F (51.7°C) on August 7th 2023. Winters are typically mild and drier, with less rain and thunderstorm activity. The highest recorded temperature was 98.1°F (36.7°C) on July 5th 2023. The highest minimum daily temperature recorded was 84.6°F (29.2°C) on August 30th 2023. The minimum temperature recorded was 44.2°F (6.8°C) on January 31st 2024.
| Climate data for Station 103140, Golden Gate, Florida, May 2023–Present normals, extremes Apr 28 2023–present | |||||||||||||
|---|---|---|---|---|---|---|---|---|---|---|---|---|---|
| Month | Jan | Feb | Mar | Apr | May | Jun | Jul | Aug | Sep | Oct | Nov | Dec | Year |
| Record high °F (°C) | 83.7 (28.7) |
82.9 (28.3) |
86.5 (30.3) |
92.3 (33.5) |
94.3 (34.6) |
93.6 (34.2) |
98.1 (36.7) |
97.9 (36.6) |
94.8 (34.9) |
92.7 (33.7) |
90.3 (32.4) |
86.0 (30.0) |
98.1 (36.7) |
| Mean maximum °F (°C) | 83.7 (28.7) |
82.9 (28.3) |
86.5 (30.3) |
90.0 (32.2) |
93.5 (34.2) |
93.6 (34.2) |
98.1 (36.7) |
97.9 (36.6) |
94.8 (34.9) |
92.7 (33.7) |
90.3 (32.4) |
86.0 (30.0) |
98.1 (36.7) |
| Mean daily maximum °F (°C) | 74.0 (23.3) |
75.7 (24.3) |
82.2 (27.9) |
83.9 (28.8) |
88.0 (31.1) |
90.2 (32.3) |
93.1 (33.9) |
93.3 (34.1) |
91.4 (33.0) |
86.8 (30.4) |
82.2 (27.9) |
74.7 (23.7) |
85.9 (29.9) |
| Daily mean °F (°C) | 65.6 (18.7) |
64.4 (18.0) |
72.7 (22.6) |
73.6 (23.1) |
77.9 (25.5) |
81.3 (27.4) |
83.7 (28.7) |
83.5 (28.6) |
81.0 (27.2) |
76.8 (24.9) |
71.8 (22.1) |
66.6 (19.2) |
76.5 (24.7) |
| Mean daily minimum °F (°C) | 57.6 (14.2) |
54.5 (12.5) |
64.2 (17.9) |
63.5 (17.5) |
68.6 (20.3) |
73.7 (23.2) |
76.3 (24.6) |
76.7 (24.8) |
73.8 (23.2) |
69.0 (20.6) |
63.4 (17.4) |
59.4 (15.2) |
68.7 (20.4) |
| Record low °F (°C) | 44.2 (6.8) |
44.6 (7.0) |
55.2 (12.9) |
56.1 (13.4) |
60.6 (15.9) |
68.2 (20.1) |
73.2 (22.9) |
72.5 (22.5) |
69.4 (20.8) |
52.5 (11.4) |
51.4 (10.8) |
46.8 (8.2) |
44.2 (6.8) |
| Average precipitation inches (mm) | 2.36 (60) |
4.16 (106) |
6.71 (170) |
0.08 (2.0) |
— | — | — | — | — | — | 0.82 (21) |
2.95 (75) |
— |
| Average dew point °F (°C) | 60.1 (15.6) |
56.4 (13.6) |
65.8 (18.8) |
63.1 (17.3) |
70.6 (21.4) |
76 (24) |
77.7 (25.4) |
78.0 (25.6) |
76.0 (24.4) |
70.7 (21.5) |
66.3 (19.1) |
61.5 (16.4) |
68.5 (20.3) |
| Source: "Current Conditions at Station 103140". WeatherFlow. Retrieved May 20, 2024.
(Rainfall data Nov 1 2023-Present) | |||||||||||||
Weather Events edit
On June 4rd 2023, nearby Tropical Depression Arlene caused the barometric pressure to drop to 1003.9 millibars at the station, becoming the record low.
On July 4th 2023, extreme heat and humidity caused the heat index to hit 124 degrees, becoming the July record. This value was reached again on July 20th.
On July 20th, the dewpoint reached a value of 85 degrees, becoming the record high dewpoint for the station.
On July 25th 2023, a high temperature of 98.1 degrees was recorded, becoming the all-time high for the station. Due to the extreme humidity and dewpoints in the lower 80s, the heat index was 122 that day.
On August 7th and 12th 2023, heat index values of 125 were recorded, becoming the new all-time record.
On January 30th 2024, a temperature of 44.2 degrees F was recorded, becoming the all-time record low.
On February 4th 2024, a minimum air pressure of 998.4 millibars was recorded in association with a Gulf Low, breaking the previous record.
| Date | Wind Speed | Event |
|---|---|---|
| Jan | 1008.3 mbar | Cold Front |
| Feb | 998.4 mbar | Gulf Low |
| Mar | 1006.5 mbar | Cold Front |
| Apr | 1005.9 mbar | Cold Front |
| May | 1006.1 mbar | Unknown |
| Jun | 1003.9 mbar | Tropical Storm Arlene influence |
| Jul | 1013.4 mbar | Unknown |
| Aug | 1006.3 mbar | Hurricane Idalia influence |
| Sep | 1009.8 mbar | Unknown |
| Oct | 1006.5 mbar | Unknown |
| Nov | 1007.1 mbar | Unknown |
| Dec | 1002.5 mbar | Gulf Low |