Talk:Solar energy/Archive 7
| This page is an archive of past discussions. Do not edit the contents of this page. If you wish to start a new discussion or revive an old one, please do so on the current talk page. |
History
In this article[1] the statement is made that in 1973 due to the oil embargo solar research jumped from $1 million/year to $400 million/year in the United States, but that was much less than the amount spent on nuclear energy. I suppose this belongs more in the Solar power in the United States article, but it would be interesting to see a total of the amount spent on solar energy research each year, on a worldwide basis. Apteva (talk) 03:27, 13 October 2008 (UTC)
"Solar" biomass, hydro and wind
The relationship between solar energy and these other renewables could be more clearly defined in the article, I feel. We should avoid saying "only this is described here". Any suggestions? Itsmejudith (talk) 17:39, 12 October 2008 (UTC)
- I just changed it to "All other renewable energies other than geothermal derive their energy from energy received from the sun.", with no need to add, and we don't talk about them here. Apteva (talk) 18:09, 12 October 2008 (UTC)
- The quoted statement is largely but not entirely correct, because Tidal power extracts energy from the relative motions of the Earth, Moon, and to a lesser extent the Sun. --Teratornis (talk) 18:24, 15 October 2008 (UTC)
- Ah yes, tidal power, of course we don't use any of it, but yes tidal power is not from solar. Feel free to add it, or tweak the statement. Are there any others? Apteva (talk) 01:54, 16 October 2008 (UTC)
- Let me amend my answer, the total energy in all the worlds tides is only 3.7 TW, and yes we do get some energy from tidal energy, but it will never be a very substantial percentage of our total use. I guess my attitude is with so much available from the other resources why even bother with tidal other than in very niche locations. Apteva (talk) 03:18, 16 October 2008 (UTC)
- The quoted statement is largely but not entirely correct, because Tidal power extracts energy from the relative motions of the Earth, Moon, and to a lesser extent the Sun. --Teratornis (talk) 18:24, 15 October 2008 (UTC)
Solar power and Solar energy
This has been discussed many times in the past. The article, for years was called Solar power. When people think of solar power they think more of photovoltaics. Both are used interchangeably though, with solar energy slightly more common than solar power. The upcoming solar conference in the United States is called "Solar Power International". Instead of "the term solar power" I would suggest "often used as a synonym for solar energy, but ...". However, we need to be discussing these proposals, not simply reverting everything and anything based solely on the name of the editor making the changes. The lead has been frozen per the version in the sandbox. As I said before, you can go back to the September version if you prefer, but that doesn't mean the whole article, that just means the lead section. Putting a technical definition of power vs. energy anywhere in the article is not needed. The place for that is the two articles energy and power, this article is only about applications of solar energy/solar power. Apteva (talk) 00:45, 13 October 2008 (UTC)
- Your perception of "what people think about" on solar power is only a perspective of yours. Can you find a definition of technically correct definition of solar power that conflicts with what I have? Again, and I've repeated this far too often, don't confuse power and energy. Briefly, power is a rate (e.g., kW) and energy is that power over time (e.g., kWhr). A number of editors, including me, have chosen to edit the article since the earlier discussion about using the sandbox, as you were blocked at the time and we could make progress with improvements. You've seen our consensus, so don't continue to make demands about what we must or mustn't do. --Skyemoor (talk) 01:15, 13 October 2008 (UTC)
- I'm not making demands. I said please. And I incorporated all of the interim changes in the "current version" in the sandbox. You suggested that using a sandbox would be a good idea, so why are you not using it? You start by saying that "Solar power, often used as a synonym" (for solar energy) and then explain that power is not the same as energy. Which is it, a synonym, or used synonymously? (Used interchangeably) Take a look at the monitor for the 14 MWp Nellis Solar Power Plant (see external links). While it is not explained very well, there are three numbers displayed each day. Right now it says
Today 67,411.75 kWh
Total 28.83 GWh- As you and I both know, that means that the maximum power put out today was 11.9 MW, and the total energy generated was 67.4 MWh. At least that is how I would interpret it. If in an hour the top number drops then it is mislabeled. Fair to say that since the power plant is labeled a power plant it puts out power, but at the end of the day there has been an accumulation of energy. Both of us have a technical background and understand derivatives and integrals, though neither is needed for an understanding of the difference between solar power and solar energy. For that do a google search and see how each is used, and you will see that they are really used interchangeably. Let me know if you see anyone talking about integrals or derivatives. I don't. Apteva (talk) 01:55, 13 October 2008 (UTC)
- Understand the difference between a "synomym" and the phrase "often used as a synonym"; the two are not equal. No integrals or derivatives are needed to understand the difference between power and energy; one is simply a summation of the other over a timeperiod. That's it. The way we have the term solar power identified right now addresses both the correct vs. technically illiterate usages. To repeat myself for the third time in 24 hours, the 3 active editors other than yourself have been collaborating very successfully on the article. If you want to use the sandbox, by all means use it. I don't see any version in there at the current time that is better than the article as it exists right now. --Skyemoor (talk) 10:28, 13 October 2008 (UTC)
- The only version in the sandbox that should be edited is the fourth one, the one that says "make changes below". If it isn't acceptable, to you, or anyone else for that matter, it is your, and their, responsibility to make any changes needed so that agreement can be reached on updating the lead. Frankly right now the September version of the lead is a lot better than any of the others. I don't have any problem with "used as a synonym", but it is more accurate to say "used interchangeably", because no one who is using it as a synonym thinks that power is a synonym for energy. Apteva (talk) 18:55, 13 October 2008 (UTC)
- Understand the difference between a "synomym" and the phrase "often used as a synonym"; the two are not equal. No integrals or derivatives are needed to understand the difference between power and energy; one is simply a summation of the other over a timeperiod. That's it. The way we have the term solar power identified right now addresses both the correct vs. technically illiterate usages. To repeat myself for the third time in 24 hours, the 3 active editors other than yourself have been collaborating very successfully on the article. If you want to use the sandbox, by all means use it. I don't see any version in there at the current time that is better than the article as it exists right now. --Skyemoor (talk) 10:28, 13 October 2008 (UTC)
The 4th version in the sandbox is out of date, and is there for reference purposes only. The version that is based on the consensus version that has been used by several editors and is the basis for future work is the last one. --Skyemoor (talk) 13:23, 14 October 2008 (UTC)
- I agree with the latest changes made by itsmejudith. --Skyemoor (talk) 13:52, 14 October 2008 (UTC)
- I agree with the last comment by itsmejudith (restructuring the Solar Power sentence using a semi-colon). I believe the sandbox version we've been modifying is ready to be moved to the article lede. Any agreement/disagreement? --Skyemoor (talk) 16:09, 14 October 2008 (UTC)
- The reference states only:
- I agree with the last comment by itsmejudith (restructuring the Solar Power sentence using a semi-colon). I believe the sandbox version we've been modifying is ready to be moved to the article lede. Any agreement/disagreement? --Skyemoor (talk) 16:09, 14 October 2008 (UTC)
- SOLAR POWER - Electricity generated from solar radiation.
- SOLAR ENERGY - Heat and light radiated from the sun.
- Nothing about usually, sometimes, often, or P=dE/dt. Apteva (talk) 18:12, 14 October 2008 (UTC)
- That's just one definition, and the only one that supported your text. You should be thanking me for finding it! --Skyemoor (talk) 09:01, 15 October 2008 (UTC)
- Not quite ready to move to the article yet, Skyemoor. I'd like to mess about with the list of technologies, in particular how the use in buildings is dealt with, and of course I'm looking for any feedback +ve or -ve and extra suggestions. Itsmejudith (talk) 18:20, 14 October 2008 (UTC)
The sandbox isn't going away, feel free to add a section to play with, but no need to hold up putting what we have so far into the article. It is far better than the interim version that Skyemoor kept reverting to. I would recommend putting questionable edits in the sandbox and making pretty straight forward ones in the article. For example, linking synonym is a clear case of overlinking. I really could care less what the list of technologies includes, I haven't even looked at it. As a summary of the article, though it should include the important ones. Apteva (talk) 20:14, 14 October 2008 (UTC)
- For what it's worth, I don't believe synonym link was overlinking. --Skyemoor (talk) 01:15, 15 October 2008 (UTC)
I have fallen behind on everything that has been happening here lately (though after reading through a few talk pages I can't say I'm sorry I missed all the drama) and it is indeed rare for me to agree with Apteva, but I cannot see how the difference between power and energy is relevant for purposes of this article. In my experience, when somebody says "solar power" or "solar energy" they mean something far too general for distinctions between power and energy to be meaningful. (For example, my employer is frequently described as a solar power/energy company, but we produce neither power nor energy -- we produce solar cells.) When talking numbers or referring to the actual flow of energy, sure, the distinction is critical, but not when talking about an industry or a field of work or study (which is what the article currently seems to focus on). The California Energy Commission definitions go too far in the other direction -- I have heard them many times before, but the few people I have heard speak who actually used them that way succeeded only in confusing the hell out of their audiences.--Squirmymcphee (talk) 18:11, 15 October 2008 (UTC)
Issues with energy sources
The new paragraph on issues with biofuels, solar, and wind breaks new ground here that we should stop and examine before we proceed. The pros and cons of renewable energy sources are exhaustively discussed at renewable energy and we are duplicating the work at best, and oversimplifying at worst. There are problems with nuclear, natural gas, petroleum, coal, tidal, wave, geothermal, OTEC, etc that are not mentioned in the paragraph, nor do I think they should. --Skyemoor (talk) 16:41, 15 October 2008 (UTC)
Graphic showing input scales
So what is wrong with the graphic? It is sourced and appropriate to the topic. -- Skyemoor (talk) 10:51, 6 October 2008 (UTC)
- Would you like to look back at the previous discussions, Skyemoor. Also, compare this graphic with the source that is given. You will see that the graphic itself is not sourced at all. Some figures have been plucked out of the source graphic. The combination of them that has been made makes no sense. At all. It really doesn't. This is a very good example of why we don't publish original research. Itsmejudith (talk) 11:00, 6 October 2008 (UTC)
- A glance back in this section and the last archive doesn't show such a discussion. The solar, wind, hydro, and geothermal matches the indication verifiable source, though the consumption in the source is in BTUs, which would need to be converted to TWhr, a energy measurement instead of a power (energy flux) measurement as noted for the renewable energy sources. So while a graphic of sourced information is not of and by itself WP:OR as long as its scales can be determined, the subject graphic as it stands is incorrect. --Skyemoor (talk) 15:36, 6 October 2008 (UTC)
- The discussions go further back and I'll look them out for you. The solar does not match the figure in the source graphic, at least it certainly does not if it is to be interpreted as "usable" solar. It includes all the solar energy incident upon the ocean, which if it were all used for human needs - depending how because it is such a completely hypothetical case - would mean that the hydrological cycle would be shut off. So much then for the quantity given for "hydro", if by hydro is meant generation from dams on rivers. Conversion of units is not in itself a problem. Taking figures from two sources produced for completely different purposes is. Itsmejudith (talk) 16:00, 6 October 2008 (UTC)
- There's no problem taking information from more than one source, especially when one deals with inputs and the other deals with consumption. I can see your concern if the "solar" cube is not more carefully defined. However, such raw projections should not be disallowed, as any number of innovations could be implemented to harness solar power in the oceans. And the issue is not with conversion of units; it's with different types of units (energy vs. power). --Skyemoor (talk) 17:33, 6 October 2008 (UTC)
- The discussions go further back and I'll look them out for you. The solar does not match the figure in the source graphic, at least it certainly does not if it is to be interpreted as "usable" solar. It includes all the solar energy incident upon the ocean, which if it were all used for human needs - depending how because it is such a completely hypothetical case - would mean that the hydrological cycle would be shut off. So much then for the quantity given for "hydro", if by hydro is meant generation from dams on rivers. Conversion of units is not in itself a problem. Taking figures from two sources produced for completely different purposes is. Itsmejudith (talk) 16:00, 6 October 2008 (UTC)
- A glance back in this section and the last archive doesn't show such a discussion. The solar, wind, hydro, and geothermal matches the indication verifiable source, though the consumption in the source is in BTUs, which would need to be converted to TWhr, a energy measurement instead of a power (energy flux) measurement as noted for the renewable energy sources. So while a graphic of sourced information is not of and by itself WP:OR as long as its scales can be determined, the subject graphic as it stands is incorrect. --Skyemoor (talk) 15:36, 6 October 2008 (UTC)
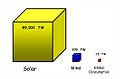
Many issues have been raised against the box diagram from multiple people.
One issue with the picture is that the main source used for the diagram talks about EXERGY rather than ENERGY so the data is being interpreted off the top. A second issue is that the boxes are three dimensional but they are comparing one dimensional quantities. This skews the comparison of the quantities so that you're left comparing the numbers themselves and you could do this more clearly with a table or text. A third issue is that the diagram itself is a low quality picture - a consensus has established this. A fourth issue is that there isn't enough space in the area for another picture so the layout gets wonky with multiple pictures. Mrshaba (talk) 18:24, 6 October 2008 (UTC)
- Thanks for bringing these points to light; I now have a better understanding and agree that the image does not adequately compare potential sources of renewable energy. -- Skyemoor (talk) 18:52, 6 October 2008 (UTC)
- It is, however the best image we have to compare them. If you would like to create an alternate, have at it. Here are the ones available that I know of.
-

1 -
2 -

3 -

4


Take your pick. All of the data in 3 and 4 come from the same source. A separate reference is given for consumption, but the same number is used in the source used for all the other items. Exergy is useful energy. There isn't any other kind of energy that is interesting. See this discussion (a misguided attempt to delete the image which did provoke some interesting responses about depicting data as an area or a volume). There are at least 3 other images in the article that are far less important than this one, if you wish to limit the number of images. This image has been in the article for a year and a half and there is no reason to delete it now. My only question is do users prefer 2, 3, or 4? Apteva (talk) 07:56, 7 October 2008 (UTC)
- It seems you added the image last September with this edit. The Rfc followed in October and several people voiced displeasure with the diagram at that time. It has been removed dozens of times by multiple editors. Mrshaba (talk) 08:26, 7 October 2008 (UTC)
- Wrong. It is an important part of the article. Of course once in a while someone comes along with the intent to sabotage the article and takes it out but it always gets restored. I find it especially telling that someone with a background of working for the nuclear industry would "lose interest" in the project now that they are no longer working at a nuclear power plant, yet only come back to voice opposition to this important image. Apteva (talk) 16:15, 7 October 2008 (UTC)
- I am an engineer with a background in solar engineering, and modeled/designed the passive solar aspects of my home and specified the grid-tied PV system with battery backup, so I'm not anti-solar in any stretch of the imagination. If you want to portray the information in the article, I suggest you find a government diagram that captures what you desire, then determine its efficacy here. The current set of diagrams above are incorrect per my comments above. --Skyemoor (talk) 17:35, 7 October 2008 (UTC)
- There is nothing wrong with either 2, 3 or 4 above. Many of the government diagrams are not Public Domain, so it is necessary to create them from the underlying data, as was done above. By your "comments above" you are, I take it, referring to the comments of Mrshaba, and not "So what is wrong with the graphic? It is sourced and appropriate to the topic."? I can not say that I have any background in solar engineering, though it doesn't take a rocket scientist to see from the diagram above that there might be sufficient solar energy available to meet all of our needs, something that is much better expressed in a diagram than in numbers, as numbers mean nothing to the average person, even to the average policy maker. I'm not advocating anything, I'm trying to find out the facts. The three fundamental questions, to me, that this article should address, are 1) how much solar energy is available, which is addressed by this diagram, 2) how much land area would it require, which is addressed by a separate diagram, and 3) how much would it cost, which is currently missing from the article. I really don't care a lot about anything other than addressing those three questions. I recently saw someone throw out a number of 45 Trillion dollars to convert to renewable energy, if I can find it again I can add it, if it is relevant. I do have a personal goal of starting a Gobi Desert project to create a solar project that sold 80% of the electricity produced and used 20% of its output to create more solar panels and sell 20% of the panels for revenue, but kept 80% to slowly march across the desert, with the goal of eventually meeting all of Asia's energy demand. The cost of the project would actually be zero, because it would be self sustaining. Apteva (talk) 18:28, 7 October 2008 (UTC)
- I am an engineer with a background in solar engineering, and modeled/designed the passive solar aspects of my home and specified the grid-tied PV system with battery backup, so I'm not anti-solar in any stretch of the imagination. If you want to portray the information in the article, I suggest you find a government diagram that captures what you desire, then determine its efficacy here. The current set of diagrams above are incorrect per my comments above. --Skyemoor (talk) 17:35, 7 October 2008 (UTC)
- Wrong. It is an important part of the article. Of course once in a while someone comes along with the intent to sabotage the article and takes it out but it always gets restored. I find it especially telling that someone with a background of working for the nuclear industry would "lose interest" in the project now that they are no longer working at a nuclear power plant, yet only come back to voice opposition to this important image. Apteva (talk) 16:15, 7 October 2008 (UTC)
- Admirable goals, we wish you good luck. My comments included "the consumption in the source is in BTUs, which would need to be converted to TWhr, a energy measurement instead of a power (energy flux) measurement as noted for the renewable energy sources. So while a graphic of sourced information is not of and by itself WP:OR as long as its scales can be determined, the subject graphic as it stands is incorrect." I also agree with "It includes all the solar energy incident upon the ocean, which if it were all used for human needs - depending how because it is such a completely hypothetical case - would mean that the hydrological cycle would be shut off." So simply find a verifiable source that discusses the potential amount of power that could be collected by the sources you note (or plainly state that the energy is simply that which is striking the earth at any point in time). The freehand boxes do not have any scale, so they are not appropriate. --Skyemoor (talk) 19:22, 7 October 2008 (UTC)
- As I have said before, there is no problem with pointing out that the amount of solar energy reaching the earth (land surface) is sufficient to meet energy needs many times over. No-one editing this article has disputed that fact. We can find good sources that make the point. Let us be guided by how they make the point. Personally, I do not see the point of prioritising the issue of how much land space it would take. The major limiting factors in PV expansion are cost, transmission and storage. Advocates of renewables agree that PV is one part of a strategy alongside wind and wave power, other technologies, and of course energy use reduction strategies. Please do look out the estimated cost of converting to renewable energy and that can be added to the relevant article. Of course it cannot be anything other than an attempt at an estimate. I'm going to take this issue to the OR noticeboard to get more eyes on it. Itsmejudith (talk) 21:35, 7 October 2008 (UTC)
- Admirable goals, we wish you good luck. My comments included "the consumption in the source is in BTUs, which would need to be converted to TWhr, a energy measurement instead of a power (energy flux) measurement as noted for the renewable energy sources. So while a graphic of sourced information is not of and by itself WP:OR as long as its scales can be determined, the subject graphic as it stands is incorrect." I also agree with "It includes all the solar energy incident upon the ocean, which if it were all used for human needs - depending how because it is such a completely hypothetical case - would mean that the hydrological cycle would be shut off." So simply find a verifiable source that discusses the potential amount of power that could be collected by the sources you note (or plainly state that the energy is simply that which is striking the earth at any point in time). The freehand boxes do not have any scale, so they are not appropriate. --Skyemoor (talk) 19:22, 7 October 2008 (UTC)
No measure of energy consumption of the planet is meaningful without specifying a time span, and at that point you are no longer specifying energy, but power, the rate of consuming energy, which is measured in watts, not Btu, or kWh. My recollection is that 15/86,000 works out to less than 0.02%, and the oceans represent about 70% of the surface of the planet, so a rough comparison shows that it could be possible to use 0.02% of 86,000 without resorting to building any off-shore facilities. Just a hunch. You can check my math. The scale of the boxes doesn't matter as long as you use the same for each, and it is easy to measure them to see that they are reasonably accurate, and as for freehand? The lines look pretty straight to me, not what I would expect for freehand. And no, using 0.02%, or 0.2%, or even 2% does not mean that the hydrological cycle would be shut off. Apteva (talk) 00:28, 8 October 2008 (UTC)
- Of course using solar energy that falls on the sea would not shut off the hydrological cycle! We do not have the technology and in any kind of foreseeable future will not have the technology to use more than a miniscule fraction of that energy. The point is that it is meaningless and misleading to suggest that 100% of it is "available" for human use. It isn't. Itsmejudith (talk) 10:42, 8 October 2008 (UTC)
- Then what number is? I don't have a problem with using that number as the amount of sunlight that strikes the Earth, though just as you said, taking it to the next step and saying that much power is available for conversion to electricity is OR. My other points have not been addressed, btw. --Skyemoor (talk) 13:10, 8 October 2008 (UTC)
- Well, no-one said that the concept of "energy available for human use" (exergy) was easy to define, let alone measure. Hence the complex nature of the source diagram which Apteva has misread. Itsmejudith (talk) 13:49, 8 October 2008 (UTC)
- When I made this edit my intention was to show the gross scale of solar energy flows in the environment. There are many studies that have made estimates of theoretically available vs. technically available solar energy and a simple enough table can be laid out. What are your other points Skyemoor? Mrshaba (talk) 16:01, 8 October 2008 (UTC)
- These data points are consistent (ZJ of energy), and are well sourced. I support the inclusion of this text. --Skyemoor (talk) 19:18, 8 October 2008 (UTC)
- Say hey... I hadn't noticed we lost that text. At about the time I decided to move the information from a bulleted format into a table Apteva, god bless him, converted the bullets into sentences but at some point some of the sentences must have dissolved. If I had my druthers I'd lay the info out in a table so you could make a linear comparison. What do you think Skyemoor? Mrshaba (talk) 22:23, 8 October 2008 (UTC)
- Hello there. This isn't a private webpage. It isn't appropriate to say, "what do you think Joe?" Address yourself to everyone, please, "what do other people think?" Wikipedia is a collaborative effort, and if you or anyone is not interested in collaborating, I'm sure that there are many other websites that would be more appropriate. Apteva (talk) 05:28, 9 October 2008 (UTC)
- Say hey... I hadn't noticed we lost that text. At about the time I decided to move the information from a bulleted format into a table Apteva, god bless him, converted the bullets into sentences but at some point some of the sentences must have dissolved. If I had my druthers I'd lay the info out in a table so you could make a linear comparison. What do you think Skyemoor? Mrshaba (talk) 22:23, 8 October 2008 (UTC)
- These data points are consistent (ZJ of energy), and are well sourced. I support the inclusion of this text. --Skyemoor (talk) 19:18, 8 October 2008 (UTC)
- When I made this edit my intention was to show the gross scale of solar energy flows in the environment. There are many studies that have made estimates of theoretically available vs. technically available solar energy and a simple enough table can be laid out. What are your other points Skyemoor? Mrshaba (talk) 16:01, 8 October 2008 (UTC)
- Well, no-one said that the concept of "energy available for human use" (exergy) was easy to define, let alone measure. Hence the complex nature of the source diagram which Apteva has misread. Itsmejudith (talk) 13:49, 8 October 2008 (UTC)
- Then what number is? I don't have a problem with using that number as the amount of sunlight that strikes the Earth, though just as you said, taking it to the next step and saying that much power is available for conversion to electricity is OR. My other points have not been addressed, btw. --Skyemoor (talk) 13:10, 8 October 2008 (UTC)
(outdent) To bring this innocent bystander up to speed, could someone please tell me what exactly the numbers ought to be? That is, what exactly is it that the average reader is supposed to be able to read off of those graphs?
Also, if I understand it correctly, the problem with the image(s) boils down to the (in)appropriateness of a log10 scale (read: the scale/comparison ought to be linear). Am I identifying the issue correctly? -- Fullstop (talk) 16:08, 8 October 2008 (UTC)
- Read my first comment above and check out the links for some of the history. This issue does not concern using log10 graphs so much as getting a poor diagram off the page that several of us have been trying to do for over a year. Mrshaba (talk) 16:27, 8 October 2008 (UTC)
- Step by step please. A year is an awful lot to expect the incidental observer to catch up on.
- there must be some reason behind trying for a year. If its not so much the use of log10 graphs, then it must be something else. Merely the fact that you have been trying for a year is completely irrelevant to identifying the problems or in finding a solution.
- other than Apteva's own listing of the 4 diagrams above I can't even determine which images you folks are actually talking about.
- from the previous discussion I have gathered that the objections are:
- the numbers being compared in the graph are not actually comparable
- for practical reasons the numbers presented by the graph can never be achieved
- the use of log10 scale & 3D volumes misrepresent the relative value of the numbers
(Incidentally, poor artwork is a non-issue. Bad art can be fixed). - Can these issues be fixed?
If not,...- Do the problems with the images (whatever they are) constitute a disservice to the reader?
- Is there overwhelming agreement here that the images constitute a disservice to the reader?
- Your turn folks. Make the most of it. -- Fullstop (talk) 18:11, 8 October 2008 (UTC)
- Step by step please. A year is an awful lot to expect the incidental observer to catch up on.
- I beg to differ sir. Working on fixing a problem for a year most certainly is relevant. You might also consider that Apteva//199/Delphi234 are all the same guy so there's a sock issue and a COI going on because Delphi234 created one of the images and he's used several identities to reinsert/argue for the image's inclusion. WPs' dispute resolution procedures have so far failed to clear this issue.
- Here's an effort at a step-by-step. The first Rfc is a good primer. We came out of the Rfc with a consensus to remove the box diagram. We established that using a three dimensional figure to represent quantities misrepresents the info no matter what the info is. At that time there were also issues raised with the quality of information used to develop the boxes. The box diagram was removed based on the consensus but Apteva/199/Delphi234 continued to reinsert the diagram.
- At some point the data in the diagram was readjusted so that it mostly came from a single source document. This transition introduced additional problems. #1: The data used conflicted with well sourced data that was already on the page. #2: The new data described EXERGY rather than ENERGY and then presented the information as power. i.e. This is the source of the OR issue.
- Following this the box diagram moved into the lead and this really set me off because the diagram was already known to be objectionable and now it introduced the subject. After going back and forth we (Itsmejudith,Apteva and myself) took the intro picture issue to mediation. The mediation was 'supposed' to settle whether the box diagram was to remain but it didn't.
- I hope that's a decent overview. As to your questions: The first image below (Available Energy 2) started things off a year ago and the second image (Available Energy 4) is the most recent version with the additional EXERGY issue.
- I have gathered that the objections are:
- the numbers being compared in the graph are not actually comparable Yes, Theoretically available EXERGY is being compared to actual ENERGY use. A more reasonable comparison would show Theoretically available ENERGY and Technically available ENERGY and compare this to actual ENERGY use. A table or text would be the easiest way to do this and we figured this out a long time ago.
- I have gathered that the objections are:
- the use of log10 scale & 3D volumes misrepresent the relative value of the numbers
- Can these issues be fixed?
The box diagram cannot be fixed because the problem is fundamental to the way boxes present information. A basic table showing Theoretically available vs. Technically available Energy seems to good way to lay out the info in my opinion. This would keep most of the information we already have while addressing the "promotion objections" that have been raised.
- Do the problems with the images (whatever they are) constitute a disservice to the reader?
Actually it covers nothing. The real objection appears to be a simple desire by Mrshaba to not use the diagram. No objection that has any relevancy has ever been purported by anyone. The diagram on the other hand has wide acceptance and there are even some who rave about it. I am only to conclude that it is that acceptance that is the cause of Mrshaba's desire not to see it used.
I am going to back up and start again. Above are four images in a row, now labeled 1, 2, 3, and 4. The first is not practical because it misleads the reader. 2 was used for about a year, and was even deleted once because someone, not to mention any names, was unable or uninterested in looking up the source for the data, something that was taken care of, and the image was restored. 3 was created in order to address the concerns raised about the fact that the values used to create 2 came from a variety of sources, and geothermal was added. As you can see from the diagram, geothermal can supply a large portion of our energy needs, wind can supply all of our energy needs, and solar can supply virtually an infinite supply of energy by comparison. Only someone who really doesn't want anyone to know this would be opposed to having the diagram included in the article.
Once again, my only question, is which diagram do people prefer for the solar energy article, 2, 3, or 4? Or would anyone like to create an alternate image that can be used? My own preference is 3, because although 4 is much easier to read, it is a little busy and hydro does not need to be included in the solar article. I have no objection to either 2, 3, or 4 being used. I will not, however ever agree to not including some sort of diagram. Oh yes, I will add that 90% of the energy we use today is wasted, so any minor changes to any of the numbers are totally moot. Apteva (talk) 22:03, 8 October 2008 (UTC)
I just had an idea come to me for a graphic that someone could create, anyone who is good with drawing images. Draw a pallet full of 860 gold bars, on a hoist like they use to unload cargo from a ship, and label it 2,712 ZJ/year, Solar, then a tiny pallet with 9 gold bars on a pallet being unloaded, and label it 27 ZJ/year, Wind, and then a tiny sliver of gold, 1/7th of a bar, on a truck, signifying what we actually use, and label it 0.47 ZJ/year, Consumption. It's a pretty accurate depiction of energy availability, we are smothered in sun and wind and only need a small fraction of what is available to meet all of our needs. Apteva (talk) 06:05, 9 October 2008 (UTC)
- None of the graphics above is correct. 1) has no units, 2)3)4) all have a mismatch between power and energy, and are not drawn to scale. The labeling would need to include qualifiers that show that the solar energy shown is the amount of sunlight striking the earth, which is not the same as the amount of sunlight available for conversion to electricity or other human-usable form of energy. Similar situation with wind. I support the insertion of the information that MrShaba previously had posted. --Skyemoor (talk) 10:35, 9 October 2008 (UTC)
- I don't care about #1 because it has obvious other problems (though having no units is not one of them - the units, TW, are at the bottom of the abscissa, or x-axis for people like me who can't tell which is which), and you may have missed my point that we do not consume energy as if we drank a glass of milk one time only, we consume energy at a rate of use, which is not energy but power, the same as the incoming solar radiation, and I really strongly doubt that you have checked to see if they are drawn to scale (I have), but the ratios could be off by a lot and would be close enough anyway (although as mentioned, bad artwork can be fixed). The description and the caption can be whatever is needed to explain that it is the total energy striking the earth, and any other caveats needed - it isn't the diagram that is wrong. And finally, insertion of information that Mrshaba previously posted doesn't require discussion, just do it. I'm sure that someone will correct the manner in which it is inserted if there is any problem with it. However I can assure you that if it is put in as a table it will be replaced with a diagram, because most people have no clue what numbers mean, but everyone can understand a diagram. Apteva (talk) 14:46, 9 October 2008 (UTC)
- While no one can be expected to comprehend how much a sextillion of anything is, grasping the enormity of such a number is not necessary here; the proposed diagrams depict the relationship between various amounts of energy/power available/consumed. For that, a plain text table works just fine:
The relative "sizes" say all that needs to be said, but even a child knows that 2,712,000 is a heck of a lot more than 470.Solar: 2,712,000 EJ/year Wind: 27,000 EJ/year Consumption: 470 EJ/year
- Since the diagrams want to depict 'X energy == N times consumption', the numbers (from diagram/talk) are more appropriately tabulated as:
- Using a Joule scale:
Source best-estimate of total resource
(regardless of the feasibility of recovery)vis-a-vis consumption @ 470 EJ/year Solar 2,712,000 EJ/year ~5,770 times consumption @ 470 EJ/year Wind 27,000 EJ/year ~57 times consumption @ 470 EJ/year Geothermal 993 EJ/year ~2 times consumption @ 470 EJ/year Hydro 223 EJ/year ~47% of consumption @ 470 EJ/year - Using a Watt scale (using 15 TW from diagram):
These tables are not difficult to understand. Indeed, they are a lot less difficult to comprehend than 3D cubes or "pallets full of gold bars, on a hoist like they use to unload cargo from a ship."Source best-estimate of total resource
(regardless of the feasibility of recovery)vis-a-vis consumption @ 15,000 MW Solar 86,000,000 MW ~5,770 times consumption @ 15,000 MW Wind 00,870,000 MW ~57 times consumption @ 15,000 MW Geothermal 00,032,000 MW ~2 times consumption @ 15,000 MW Hydro 00,007,200 MW ~47% of consumption @ 15,000 MW
A picture may be worth a thousand words, but that many words are not needed here. -- Fullstop (talk) 16:01, 13 October 2008 (UTC) - Unless my check/math is wrong "2,712 ZJ/year, Solar" (per talk) and "86,000 TW" (per diagram) are both incorrect.
While 2,712 ZJ/y is approximately equal to 86,000 TW, per the gcep graphic (said to be the source of the 86,000 TW value in the 3D box diagrams), the value for "Solar energy" is 0.016 TW, not 86,000 TW.
0.016 TW is only 0.0005049216 ZJ/year:- By definition, 0.016 TW is equal to 0.016 TJ/sec (16,000,000,000 J/s)
- There are 365.25 * 24 * 60 * 60 seconds per year (31,557,600 s/year).
- 16,000,000,000 J/s * 31,557,600 s/year = 504,921,600,000,000,000 J/year.
- 504,921,600,000,000,000 (5.049216e+17) J/year is 0.0005049216 ZJ/year. Not 2,712 ZJ/year.
- Using a Joule scale:
- -- Fullstop (talk) 16:01, 13 October 2008 (UTC)
- I have no idea where you got 0.016 TW from, but the diagram shows the amount of energy from the sun reaching the surface of the planet, not the average power produced from solar energy. See article caption.[2] Please note that solar energy primarily refers to the way we use the energy from the sun. The other meaning is the meaning in the diagram, all of the energy from the sun (see sandbox, below). And once again, to the average person, numbers mean nothing. Feel free to fix the caption, but it is obvious that the diagram does not mean how much of our energy comes from solar, wind and geothermal, as they would be smaller, not larger than our total consumption. I would caution against a huge long caption, although a more detailed explanation could be included in the reference for the image. Apteva (talk) 18:44, 13 October 2008 (UTC)
- While no one can be expected to comprehend how much a sextillion of anything is, grasping the enormity of such a number is not necessary here; the proposed diagrams depict the relationship between various amounts of energy/power available/consumed. For that, a plain text table works just fine:
- please don't interleave responses. These are difficult to follow.
- We will have to disagree that "to the average person, numbers mean nothing". I have shown why this is not necessarily true, and this remains valid as long as no counter-argument is provided. Merely repeating "numbers mean nothing" does not make that statement any truer.
- the word "best-estimate" etc are those of the gcep source that your graphics are supposedly based on, as linked from the description of the graphics themselves. The exact words of the second sentence on the linked page read: "Quantities represent GCEP's best estimate of the total resource regardless of the feasibility of recovery".
- the 0.016 TW etc are those of the gcep source that your graphics are supposedly based on, as linked from the description of the graphics themselves. The source explicitly states "Solar Energy", "Wind Energy", "Geothermal Energy", "Hydroelectric" etc in exactly those words. The accompanying values are 0.016, 0.06, 0.03, 0.36 respectively.
- What "solar energy" is defined as here is moot. You may not redefine a source's terms, so even if the definition assumed by your diagrams does not match the terms explicitly used by the source, then you obviously cannot use that source for your diagrams.
- -- Fullstop (talk) 11:09, 14 October 2008 (UTC)
- You are describing something from the ref that is not covered by the diagram. Feel free to create a separate diagram for each of those items (although I find it odd to describe a resource as obtainable but not feasible), those being what someone thinks could be obtained from solar etc. and what is currently being obtained. Check out Numerophobia or Arithmophobia (try google), or Jay Leno's segment, Jaywalking. How do you explain a member of congress saying that the average US income is $250,000, or that the middle class is anyone making up to $5 million a year?[3] Most people are visual and can understand a diagram but not numbers, which are an abstract mathematical concept. (there are four types of learners, auditory, visual, kinetic, and tactile) Here is a reference which states "Students performed better interpreting a quantity expressed as a percent given a pictorial continuous region than when a pictorial discrete set of circles was given. Students had difficulty interpreting a quantity expressed as a percent of a number." [4] Find a reference that says the opposite. You won't. Apteva (talk) 17:23, 14 October 2008 (UTC)
- Please stick to the subject, which is not Numerophobia, not Arithmophobia, not Jay Leno, not the US congress, and not the incapacity of US students to interpret a percentage. The subject here is "Solar Energy", the unsuitability of 3D box diagrams, and the diagrams' reinterpretation of a source's data. Please stick to those subjects, and please refrain from WP:IDHT assertions that an average reader will fail to recognize that a 5-digit number is "bigger" than a 3-digit number.
- I may be describing "something from the ref that is not covered by the diagram", but the issue at stake here is that the diagram is describing something that is not covered by the ref.
The diagram may not redefine a source's terms, and it may not project a conclusion that is not explicitly evident from the source. Period.
In simple English this means: diagrams that say 86,000 TW Solar energy are unusable when the source of those diagrams says 0.016 TW Solar Energy. :::::::-- Fullstop (talk) 02:19, 15 October 2008 (UTC)
This is, however, an encyclopedia, and as such the purpose is to describe the subject matter of the article. There are many items that need to be covered, what solar energy is, how we use it, how much is available, and so on. This diagram is an essential element of the article because it shows how much solar energy reaches the surface of the earth, and no I don't care an FF what the reference used to obtain the data to create the diagram defines solar energy as. For the purposes of the diagram, solar energy is defined as the useful energy reaching the surface of the earth, and that number does appear in the reference. The diagram, by the way, labels it simply as "Solar", nothing else. As I said before, you are free to tweak the caption in any manner you deem necessary, but it is already pretty long and fairly well explained, in my opinion.[5] (I'm posting a link because Skyemoor is back to auto-revert mode)
The issue at stake is only is the article complete, is it useful, or does it require editing. Nothing else matters. I can guarantee that the article is used by all ages from 9 to 90, and needs to be reasonably accessible, so yes keeping in mind a knowledge of what is going to go over someones head is helpful. Your arguments really don't hold a lot of water, and your strength in holding them baffles me. I'll take a look at your other contribs. We may need to ask for mediation to resolve this. Apteva (talk) 02:54, 15 October 2008 (UTC)
- Not only is this an encyclopedia, where novel data has no business being, this is Wikipedia, where reinterpretation of sources is prohibited.
- Spare us the condescension, ad-hominem arguments or grasping for straws.
- Unlike everyone else here, I have no special knowledge of solar energy, nor have I ever edited this page (or any other energy-related page). But I have a nose for OR, and I can check sources, and I can verify that there is overwhelming agreement here (on talk) to not use the diagrams. It seems highly unlikely that everyone but you is wrong. -- Fullstop (talk) 12:02, 15 October 2008 (UTC)
- Fully agree with Fullstop. There is no need to recycle the same argument over and over and over and over. The diagram is considered inappropriate for this article, and if you even need to understand why, re-read this talk page section fully each time you get the urge to put the diagram back it. --Skyemoor (talk) 14:05, 15 October 2008 (UTC)
- The amount of insolation reaching the surface of the planet is well documented. You can find many sources that give close to the same number, and that is what the diagram shows in the block labeled "Solar". The diagram in question has been reviewed seven ways to Sunday, and each time has passed muster. See the problem is, that none of your arguments relate to the relevance of the diagram in this article, only to the diagram itself, and this isn't the forum for that. And yes the diagram is appropriate for this article, because it shows the amount of energy reaching the earth from the sun, a vital piece of information for the article, and not in a number, but in a diagram. I am perfectly willing for you to find another diagram that shows the same information in a better manner, but yes I will recycle the same arguments as often as they come up. The person who created the diagram didn't have the stomach for inane debate and left Wikipedia. Fortunately, I have no problem discussing the issue, or any other issue until the cows come home. The proper place to discuss this, however is with an RfM, although it should not require that. I would suggest reading the RfM for some of the comments that came up there. The final word was "maybe I'll get [around] to figuring out how to make a solar-themed graph". Note to Skyemoor, if you are going to take something out, you have to replace it with something that is better. Just deleting the diagram removes vital information from the article. Apteva (talk) 15:30, 15 October 2008 (UTC)
- Fully agree with Fullstop. There is no need to recycle the same argument over and over and over and over. The diagram is considered inappropriate for this article, and if you even need to understand why, re-read this talk page section fully each time you get the urge to put the diagram back it. --Skyemoor (talk) 14:05, 15 October 2008 (UTC)
- How is this not the forum for discussing the graphic itself? If the graphic inaccurately or misleadingly displays the information the article is intended to convey then it is far better to have NO graphic. A table is without a doubt a better option than the current graphic. And for what it's worth, I find the argument that this graph does not distort the data like the log10 graph does to be quite disingenuous, as this graph is nothing more than a root 3 graph with the confusing feature that it stretches in two directions instead of just one. log10 graphs at least have a long history in science and statistics (and a logical reason behind their use). Finally, if this graph is really of high quality then it should be able to stand on its own without any numbers written on it. In fact, many experts on the presentation of data say that if you have to write numbers on the graph (beyond the scales on the axes) then you're better off presenting it as a table of numbers.--Squirmymcphee (talk) 18:26, 15 October 2008 (UTC)
- It is a root 3 graph, and an area graph is a root 2 graph, both of which are greater than log 10, and thus better at indicating which is bigger. For example if you present data that ranges from 2 to 7 on a scale of 0 to 1000 you can't tell which is larger, as each is only one pixel, but if you reduce the scale to 0 to 10 the relationship shows up. If you further reduced the scale to 0 to 1 both would be off the chart, so the scale is very important to allow seeing which is larger. I don't see any problem with including numbers - I prefer including numbers, for example it really bugs me to see graphs that don't include the data and you have to try to estimate what the data is. To me the diagram shows the relationship, and the numbers allow a mathematical comparison, the best of bother worlds. Volume charts also have a long history, by the way. I would like to see someone create an alternate, so that we would have a choice of diagram to use. Right now we really only have variations on the one created by Frank Mierlo, which gets me back to the question which of the available do we use. And no I do not see that anyone can argue that the graphic is inaccurately or misleadingly displaying the information the article is intended to convey. It would be inaccurate if it was drawn incorrectly, and as mentioned bad artwork is easily fixed. It would be misleading if it distorted the ordering of the quantities, for example using a larger cube for hydro than for wind, or a larger cube for current use than solar, but once again that would fall into the category of bad artwork and easily fixed. I'll repeat the example from the RFM, slightly modified. Which is easer to see which is larger, red or blue?
- How is this not the forum for discussing the graphic itself? If the graphic inaccurately or misleadingly displays the information the article is intended to convey then it is far better to have NO graphic. A table is without a doubt a better option than the current graphic. And for what it's worth, I find the argument that this graph does not distort the data like the log10 graph does to be quite disingenuous, as this graph is nothing more than a root 3 graph with the confusing feature that it stretches in two directions instead of just one. log10 graphs at least have a long history in science and statistics (and a logical reason behind their use). Finally, if this graph is really of high quality then it should be able to stand on its own without any numbers written on it. In fact, many experts on the presentation of data say that if you have to write numbers on the graph (beyond the scales on the axes) then you're better off presenting it as a table of numbers.--Squirmymcphee (talk) 18:26, 15 October 2008 (UTC)
| Blue | 2.7 |
| Red | 7.2 |
or
| Blue 2.7 |
| Red 7.2 |
Apteva (talk) 04:09, 16 October 2008 (UTC)
- "And yes the diagram is appropriate for this article, because it shows the amount of energy reaching the earth from the sun, ..."
- The amount of energy reaching the Earth's surface isn't the amount available for use. PV cells are ~10–20% efficient, and thermal systems ultimately have to radiate the energy back to space at about the temperature of the Earth's surface.
- —WWoods (talk) 06:48, 16 October 2008 (UTC)
- The amount reaching the surface of the earth is also used for other purposes, at varying degrees of efficiency. Efficiencies have been creeping up, but there is a trade-off between using really cheap 8% panels and really expensive 42% panels. The amount of energy reaching the panels doesn't change, though. What was that saying? Something about things that can be changed, and wisdom? Something like, "Have grace to accept the things that cannot be changed, courage to change the things that should be changed, and the wisdom to know the difference? Apteva (talk) 13:41, 16 October 2008 (UTC)
- See Dyscalculia and Innumeracy. Using a table instead of a diagram makes the information inaccessible to 5% of the population. Needless to say I would strongly recommend restoring the graphic. As Skyemoor commented when it was removed "So what is wrong with the graphic? It is sourced and appropriate to the topic." Apteva (talk) 03:05, 17 October 2008 (UTC)
Apteva, the consensus is now roughly 6 to 1 against putting the graphic back in. If you have any questions about this, please re-read the entire section above through first. --Skyemoor (talk) 10:55, 17 October 2008 (UTC)
- So? That just means that six are wrong and one is right. An RFM would be appropriate as a means of working out which is better, a table or a diagram. Apteva (talk) 21:54, 17 October 2008 (UTC)
- And if the RFM produces the same conclusion -- that the table is the better way to go -- what then? Arbitraton?--Squirmymcphee (talk) 06:47, 18 October 2008 (UTC)
- If the RFM produces the highly unlikely conclusion that diagrams are less easy to understand than tables, but that's a huge if, that would mean that I agree to that conclusion, because there is no way that I would not include myself in the RFM. Apteva (talk) 15:52, 18 October 2008 (UTC)
- To assert that diagrams are better than tables is akin to asserting that cars are a better mode of transportation than bicycles: It is true sometimes, but not all of the time. A clear, easy-to-read table is always better than a diagram that is unclear, inaccurate, confusing, or otherwise easy to misinterpret or difficult to understand. A bad diagram is unquestionably worse than no diagram at all.--Squirmymcphee (talk) 17:32, 18 October 2008 (UTC)
- You are correct. Bicycles are better than cars in some cases, and tables better than diagrams - for example if there is too much data for a diagram. However, to see the relationship between three or four numbers it seems to be non sequitur to suggest that a bad diagram is worse than no diagram - bad artwork can easily be fixed, and all comments denigrating the diagrams in question appear to be spurious. Obviously diagrams and tables each have their place, and this is one place that a diagram works much better than a table. Apteva (talk) 09:22, 19 October 2008 (UTC)
- Funny, most people say the opposite -- that tables are best suited to comparing small data sets, but graphics are much better for synthesizing large amounts of data. I tend to agree with them, as I fairly regularly work with data sets tens of thousands of points long and would never make much sense of them without graphical tools like histograms and box plots. I agree that bad artwork can be fixed, but I have yet to see a diagram of this particular data that does not seriously distort it (aside from the bar chart with the log scale, though if I am not wrong the consensus seems to be that the expected readers of this article might not have the background to interpret it correctly); that is not an issue of bad artwork, it is an issue of the chart being fundamentally flawed. It is never acceptable to distort data. Can you explain in detail what is "spurious" about the comments on the chart? Thus far I have seen numerous thoughtful, well reasoned, and well supported arguments about why the chart presents the data poorly, but I have seen no substantive response against those arguments.--Squirmymcphee (talk) 18:35, 19 October 2008 (UTC)
- You are correct. Bicycles are better than cars in some cases, and tables better than diagrams - for example if there is too much data for a diagram. However, to see the relationship between three or four numbers it seems to be non sequitur to suggest that a bad diagram is worse than no diagram - bad artwork can easily be fixed, and all comments denigrating the diagrams in question appear to be spurious. Obviously diagrams and tables each have their place, and this is one place that a diagram works much better than a table. Apteva (talk) 09:22, 19 October 2008 (UTC)
- To assert that diagrams are better than tables is akin to asserting that cars are a better mode of transportation than bicycles: It is true sometimes, but not all of the time. A clear, easy-to-read table is always better than a diagram that is unclear, inaccurate, confusing, or otherwise easy to misinterpret or difficult to understand. A bad diagram is unquestionably worse than no diagram at all.--Squirmymcphee (talk) 17:32, 18 October 2008 (UTC)
- If the RFM produces the highly unlikely conclusion that diagrams are less easy to understand than tables, but that's a huge if, that would mean that I agree to that conclusion, because there is no way that I would not include myself in the RFM. Apteva (talk) 15:52, 18 October 2008 (UTC)
- And if the RFM produces the same conclusion -- that the table is the better way to go -- what then? Arbitraton?--Squirmymcphee (talk) 06:47, 18 October 2008 (UTC)
- You casually remark upon area and volume graphs as though they are commonly used methods of presenting data that anybody will understand. They are not. Few, if any, of the many data plotting software packages available in the world can do either sort of graph, which should tell you something about what the world thinks of their popularity and their clarity. Even Microsoft products, which are frequently criticized for encouraging poor presentation of data, do not support such charts. (Yes, they have a chart type called "Area," but the charts it produces are not the "root 2" chart that you're talking about. The closest thing it has to what you're talking about would be the bubble chart, but that is meant for presenting 3-dimensional data, not 1-dimensional data like we are discussing here.) Your remarks about scale are a non-sequitur -- scales can be drawn independent of transformation, though they of course must be drawn with the transformation in mind if they are to be accurate. There's nothing stopping you from presenting data that varies from 2 to 7 on a log10 scale from 1 to 10, for example, and if the data are a power function of the abscissa that may even be the best way to present them.
- As for including numbers on the graph, I didn't say I have a problem with including them, only that if they are required for the graph to make sense then the graph is not effective. The primary reason for presenting data graphically is to communicate relationships in data. If I tell you I use twice as much energy as my neighbor you don't need to know exactly how much energy we each use to understand that I use a lot more energy than my neighbor. That sort of comparison is the primary mission of presenting data graphically, and if comparison is not of interest then there is no point in graphing the data at all. It doesn't hurt to label the data points with precise values, as they may be of interest as well, but it should not be necessary for the viewer to understand the chart. If the important thing is only to communicate precise values then you should always use a table, as it make the values much easier for users to look up.
- When a difficult or incomprehensible chart is "fixed" by having the data labeled with values, viewers actually construct a mental table and populate it with the values from the graphic. Later, what they remember is the mentally constructed table, not the graphic, and they remember the data less accurately than people who read the same data from a table from the get-go. They also tend to forget what they were reading or hearing at the time as their brains shift gears to constructing the mental table instead of processing the information being presented to them. This is all well documented and verified by clinical study -- I am not making it up from whole cloth. See, for example, Fundamentals of Scaling and Psychophysics by Baird or The Elements of Graphing Data by Cleveland.
- Finally, your example fails to illustrate anything relevant to the topic at hand. Your example compares a poorly formatted table to a well formatted linear bar chart, both displaying 1-dimensional values of similar magnitude. However, what we are discussing here is a well formatted table -- see the examples above -- versus a graphic that transforms 1-dimensional data by its cube root, then plots it three dimensions with equal magnitudes along each axis, rotates the 3-D plot arbitrarily, then projects it into two dimensions. I realize you were trying to simplify your example, but you overdid it. Try putting the values 2 and 7 into a well formatted table, then create a bar chart that graphs not their actual values, but the cube roots of their values. That wouldn't be a perfect representation of what we're talking about here, since it misses the distortion caused by projecting three dimensions into two, but it would be far closer that what you presented in your example.--Squirmymcphee (talk) 06:47, 18 October 2008 (UTC)
- Is there a concensus here about whether to use joules or watt-hours? They're both SI (though ZJ and TWh, strictly speaking, are not), so I don't necessarily have any strong feelings about it myself. Whichever it's going to be, though, the text and the table need to be made consistent with one another.--Squirmymcphee (talk) 17:43, 18 October 2008 (UTC)
- The unit choice issue is Wikipedia wide as far as energy articles go. I introduced the original comparison between biomass, wind, total solar etc. (in bullet form unfortunately) and used zettajoules at that time because zettajoules laid out the information in a compact way. Following this I converted all the units on the page to joules for consistency. I think joules are the way to go because solar technologies deliver many forms of energy - heat, light, electricity, chemical energy etc. Watt-hours are the de facto unit for electricity but joules can be used for a generic array of energy types and I think this flexibility makes joules the best choice for the page. WP does not have a consensus on the energy unit issue last time I checked several months ago. I also considered using a primary unit (joules for example) followed by secondary conversions (BTU, TWh etc) in brackets but this option is messy so I did not pursue it. After a year of considering this off and on I think the page should stick with joules.
- I want to see the info laid out in a table but I dislike the way some table types are formatted on WP. Why doesn't the text wrap when using the attractive wikitable format vs table format? The wide white bracket standard table format support wrap around text but they don't look as nice. The other option is to upload a wikitable as an image to get wrap around text but this option does not allow for linked refs. Bahh... I'd like to use the wikitable format and have wrap around text. Any ideas there? Mrshaba (talk) 22:23, 18 October 2008 (UTC)
- Yes, take out the table and replace it with one of the excellent diagrams that are available. Note: if you have a specific question like that, express it on your talk page and write {{helpme}} above it, or go to one of the help forums, this is not the place to be asking questions like that. When you ask it here, you are asking it of less than half a dozen editors none of whom may have any experience with that issue. When you ask it in the appropriate forum, as indicated above, you get help from specialists in that area who actually can help you. Apteva (talk) 09:22, 19 October 2008 (UTC)
- I want to see the info laid out in a table but I dislike the way some table types are formatted on WP. Why doesn't the text wrap when using the attractive wikitable format vs table format? The wide white bracket standard table format support wrap around text but they don't look as nice. The other option is to upload a wikitable as an image to get wrap around text but this option does not allow for linked refs. Bahh... I'd like to use the wikitable format and have wrap around text. Any ideas there? Mrshaba (talk) 22:23, 18 October 2008 (UTC)
- I spent a good deal of time today working on a table using the "table format" only to find that the wikitable format supports wrap around text. For some reason I thought this wasn't the case. Anyways, I do plan to rework the table with columns labelled theoretical potential and technical potential. This type of table should clear up the apples to oranges comparison conflict between energy use and theoretical availability. Here is the table so far. I need to add Hydro to the table as this is an indirect solar resource. Any other ideas? Mrshaba (talk) 02:54, 20 October 2008 (UTC)
The above has an error in the table that is leaving a table open. Or two. Fixed. And don't use float to position a table. Read Help:Table, which says "Do not, under any circumstances, use "float" to position a table. It will break page rendering at large font sizes." Apteva (talk) 20:19, 20 October 2008 (UTC)
A column for technical potential is useless, because no one can say what that is - what is technically feasible today? What will be technically feasible in a year, a decade, a century? It's really just wetting your finger and saying ah, that way, and not very useful. And theoretical potential totally misses the point that it's the total energy in the resource, not the theoretical potential. Yeesh this section is long. I'm ending this section and starting a new one. Apteva (talk) 20:19, 20 October 2008 (UTC)
The total solar energy absorbed by Earth's atmosphere, oceans and land masses
The figure given in the article for the total solar energy absorbed by Earth's atmosphere, oceans and land masses is 3,850 ZJ in a year. converted into Wh it represents 1.069 ZWh In the same article it is written that the Earth receives 174 PW from the Sun. If we convert this power in energy for a year, we find 1.068 ZWh and everything is OK.
But it seems to me it is not the total solar energy absorbed by Earth's atmosphere, oceans and land masses, because there is the albedo effect that is missing. It is clearly stated in the article that: "approximately 30% is reflected back to space while the rest is absorbed by clouds, oceans and land masses".
So the total solar energy absorbed by Earth's atmosphere, oceans and land masses should be 30% lower than what is written in the article:
0.74787 ZWh, or if you really want to use Joules: about 2,695 ZJ (70% of 3,850 ZJ)
Nietzsche61 (talk) 10:31, 18 October 2008 (UTC)
- Feel free to correct any errors, but be careful about what they are referring to, received and absorbed are two different concepts. But yes please stick to Joules. Using ZWh would be a horrendous mistake. Please also revert the good faith trashing of the table done by Skyemoor, by reverting this edit.[7] Apteva (talk) 15:56, 18 October 2008 (UTC)
- Try the math again Nietzsche61. The 3850 ZJ figure is slightly rounded but it works out to 70% of 174 PW/year. 174 PW (Petajoules/sec) x .7 x 365.25 days x 24 hours/day x 60 min/hour x 60 sec/min = 3844 zettajoules... Seems correct... The albedo effect is incorporated into the 70% figure which comes from NASA and Vaclav Smil. Mrshaba (talk) 23:01, 18 October 2008 (UTC)
- Sorry for wasting your time. I'm ashamed of the stupid mistake I made. The figure does take the albedo effect into account and represents the total energy ABSORBED by the system : 3850 ZJ is right. My bad. 221.217.29.35 (talk) 13:17, 19 October 2008 (UTC)
- That was just me... Nietzsche61 (talk) 13:20, 19 October 2008 (UTC)
- Please, you did not "waste" anyone's time. Everyone makes mistakes, and as you will hear teachers say a thousand times, there are no dumb questions, if you have a question, ask it, someone else probably has the same question. Questioning a number or a statement is essential to keeping the encyclopedia accurate. For example, right now the wind energy number is wrong (72 TW), because it is only over land at 80 m in class 3 or better regions. To give you an example of how wrong that is, Indiana only has a tiny area of land that is class 3, and was rated in 1991 for a maximum wind potential of 30 MW installed capacity, at 50 m that time. In 2006, at 70 m their wind potential was reassessed at 40,000 MW installed capacity, but guess what, modern turbines are at 100 m, which gives about twice the capacity that 70 m does, and even higher ones are being built. The actual estimates for wind energy have ranged from about 300 to 870 TW, with 870 more likely than 300. Apteva (talk) 18:07, 19 October 2008 (UTC)
- Note: In cases where you are talking about a rate of energy, such as per year, instead of using Joules, the correct unit is Watts, which is one Joule/second. Apteva (talk) 18:13, 19 October 2008 (UTC)
- Thank you for your understanding, but I still think that I should have avoided this mistake. Anyway, I don't want to transform this Solar energy talk page into a forum about wind power, but I'll give you my point of view. You mention the wind power which derives from the kinetic energy of the atmosphere. We know that the atmospheric mass is 5.1480 10^18 kg. It is then possible to evaluate the average speed required to reach the numbers you propose. A 870 TW power would deliver 870 TJ per sec. If we know the mass m, the energy E, we can roughly evaluate the average speed required: . Doing the math (hopefully right :)) we find v=0.0018 ms^(-1). By having the atmosphere globally moving at 1.8mm per sec. (or about 0.066 km/h) would create 870 TW. So this number doesn't seem overstated, but this is not a proof... Now if you only consider the first 100m of the atmoshpere (as a reachable limit), I made the following calculation:
- volume considered for this layer, (with R_earth = 6356km): 5.08 10^16 m^3 and a mass of about ( with air density supposed constant at 1 kg/m^(-3)) : 6.09 10^16 kg. That would give an average speed of 18 cm per sec. or 0.67 km/h... I would expect the global wind power available below 100m to be even more than 870 TW... Of course only part of it can be harvested with wind turbines (Betz's law...) Nietzsche61 (talk) 06:45, 20 October 2008 (UTC)
- One source I have for the theoretical potential of wind energy is 3 PW IIRC. I think the best way to go is to have the wind and solar pages report the same numbers for theoretical potential and technical potential. This is why the current technical potential for wind comes from the recent Standford study that the Wind power page uses. All the energy pages should agree as far as these energy potential numbers go. The Solar energy page faces a strange difficulty here because solar energy plugs into hydro, wind, biomass etc. There will be controversies but if there are caveats to be added they should go in the notes. If we can't figure it out it's not all that hard to write to the authors of the studies for guidance. Mrshaba (talk) 07:03, 20 October 2008 (UTC)
- Paul Gipe is a wind expert and he's responsiive to inquiries. He might be able to settle the question of technical vs theoretical potential wind numbers. Mrshaba (talk) 07:13, 20 October 2008 (UTC)
- Nietzsche61 - The technical potential for wind (2.25 ZJ/year) comes from the [Jacobson and Archer] study. One possible source for the theoretical potential of wind comes from a paper Lorenz published in 1976 (The Nature and Theory of the General Circulation of the Atmosphere) that estimates the global wind flux at 3.5 PW - this translates into 110 ZJ/year. Mrshaba (talk) 17:19, 20 October 2008 (UTC)

The 1976 number does not agree with more recent estimates (870 TW). For those who are losing track of T and P, T = 1012, P = 1015, and Z = 1021. The technical potential from Jacobson and Archer is already obsolete, because it is at 80 m and modern turbines are 100 m and even higher. Also I'm not sure it takes into account exclusions for places that you would not want to build turbines. This is getting way off topic to even think of wind potential. There is a separate wind power article for that subject. And even solar potential is way off topic, because it depends on land use and cell efficiencies and all sorts of things that have no reason to be discussed here. Calculating that people in the year 23,000,000 could develop 847.382 TW of solar power is stupid. Calculating that people in the year 2009 could develop 0.43, 4.3, or 43 TW of solar power is equally stupid. Apteva (talk) 21:10, 20 October 2008 (UTC)
Lead section
Please comment on the following two proposed lead section:
1) http://en.wikipedia.org/w/index.php?title=Solar_energy&oldid=243749995
2) http://en.wikipedia.org/w/index.php?title=Solar_energy&oldid=243775000
Until an agreement has been reached the lead should be reverted to how it existed before the change was proposed,[8] or to [9], either is acceptable.
- Comments
The most obvious problems with #1 are that it is only 2 paragraphs instead of the required 3 or 4, it uses the inaccurate phrase "heat and light" (all energy comes to us from the sun in the form of radiant energy (light) - the sun would have to physically contact the earth for us to directly receive heat from the sun), it includes the inappropriate 99% (99.97%) instead of the word "most", and the second paragraph is a choppy list that includes only a subset of the important ways we use solar energy. The best part of #1 was incorporated into #2, retaining the best parts of the current lead section. Apteva (talk) 02:34, 9 October 2008 (UTC)
- WP:LP does not require 3 or 4 paragraphs. "Heat" is infra-red radiation, which is the energy of electromagnetic waves, but it is simpler for the average user simply to say "heat" in the lede, and delve deeper into the physics later in the article. Notice there was no mention of heat transfer by conduction, in contrast to your comment above. 99.97% is more specific and accurate than 'most', and is therefore much more desirable in WP in order to avoid WP:WW. The list is an overview, as this is a summary section. If you believe there are important items left off, please add them. I have no doubt that #1 can be improved, but #2 is even more awkward, starting with the first sentence; solar energy exists whether it is utilized or not, simply by heating rocks or ocean water. The second paragraph on building design does not flow well, and seems to have too much information for a summary section. --Skyemoor (talk) 20:20, 9 October 2008 (UTC)
- I disagree. WP:LEAD#Length states "The appropriate length of the lead section depends on the total length of the article. As a general guideline, the lead should be no longer than four paragraphs. The following suggestion may be useful: ... > 30,000 characters 3 or 4 paragraphs" Heat is not primarily infra-red radiation. Think of a pot of iron heated to 1,000 degrees. The infra-red radiation it gives off is a small percentage of the heat it contains. The reason for not using a percentage in the lead is the lead is an overall summary, and it isn't the percentage that is important, which is included in the body, it is the concept that is important, that "most" available energy is from solar energy. Remember that numbers mean nothing to most people. I would suggest working on #1 in a sandbox, it has far too many problems to be included. I really don't wish to add to a list of clauses, as sentences are better. The first sentence of the lead has never been something that anyone has been proud of, but "heat and light" is a complete zero. Apteva (talk) 21:43, 9 October 2008 (UTC)
- You can disagree WP:LP does not require 3-4 paragraphs, but you only supplied evidence that says "The following suggestion may be useful". Your comparison of heat from the sun with a the heat contained within a boiling pot has nothing to do with the solar energy that reaches Earth and would be off by many 1000s of orders of magnitude. Working on improving the lede is entirely justifiable; let's do it in a sandbox as you describe and achieve consensus before making changes to the main article. --Skyemoor (talk) 10:38, 10 October 2008 (UTC)
- The article has to be accessible to readers with a scientific/technical background and those without any such background at all. It will be extensively used for school projects but it should also provide good links for energy professionals. We all know that if we stand in the sunshine we can feel the warmth. The heat "comes from the sun". How do we explain this in the article? We have to say something, but I suggest we do it as quickly as possible and use the fact that we can link to other articles for more detail. We might also want to include some of the science in footnotes rather than in the article. Itsmejudith (talk) 10:56, 10 October 2008 (UTC)
- You can disagree WP:LP does not require 3-4 paragraphs, but you only supplied evidence that says "The following suggestion may be useful". Your comparison of heat from the sun with a the heat contained within a boiling pot has nothing to do with the solar energy that reaches Earth and would be off by many 1000s of orders of magnitude. Working on improving the lede is entirely justifiable; let's do it in a sandbox as you describe and achieve consensus before making changes to the main article. --Skyemoor (talk) 10:38, 10 October 2008 (UTC)
- I disagree. WP:LEAD#Length states "The appropriate length of the lead section depends on the total length of the article. As a general guideline, the lead should be no longer than four paragraphs. The following suggestion may be useful: ... > 30,000 characters 3 or 4 paragraphs" Heat is not primarily infra-red radiation. Think of a pot of iron heated to 1,000 degrees. The infra-red radiation it gives off is a small percentage of the heat it contains. The reason for not using a percentage in the lead is the lead is an overall summary, and it isn't the percentage that is important, which is included in the body, it is the concept that is important, that "most" available energy is from solar energy. Remember that numbers mean nothing to most people. I would suggest working on #1 in a sandbox, it has far too many problems to be included. I really don't wish to add to a list of clauses, as sentences are better. The first sentence of the lead has never been something that anyone has been proud of, but "heat and light" is a complete zero. Apteva (talk) 21:43, 9 October 2008 (UTC)
I categorically reject the 3-4 paragraphs nonsense. The lede should be whatever length makes sense. And in general, shorter ledes are always better if they get the point across. We should never be making a lede longer "just because!"
The "heat and light" thing is more interesting. I disagree that heat is inherently inaccurate, because radiant heat is still called heat by a lot of people. I see your point that you want to distinguish it from conduction or convection, though. My proposal would be to replace "heat and light" with "light and radiant heat". It still rolls off the tongue easily; it is technically correct; and, since casual readers will tend to gloss over the word "radiant", I think it is still clear to the layman. I'm going to be bold and make the change, though I recognize with the recent history of this article I might get quickly reverted ;) Oh well...
The other points will require closer inspection. --Jaysweet (talk) 15:45, 10 October 2008 (UTC)
- I am a big fan of semicolons (as, coincidentally, my previous post demonstrates!) but the semicolons in paragraph 2 were not necessary, and arguably not appropriate. None of the individual clauses contained a comma, therefore there was no need to promote the separator from a comma to a semicolon in order to disambiguate clause delineations from subclause delineations. Commas will do just fine.
- I share some of Apteva's skepticism about the value of this list to the lede. I might prefer to be more general in the lede, perhaps with something like (just brainstorming here):
- Solar energy can be used directly, for example in passive heating systems, or it can be converted to electricity via solar cells and other related technologies.
- That sort of gives the flavor without being a tedious list. Comments? --Jaysweet (talk) 15:51, 10 October 2008 (UTC)
- I believe the semicolons were appropriate but I'm not a blackbelt grammarian so no sweat. Light and radiant heat sounds fine to me. As to the list I think we need it to give the subject an overview. I do not think we should use a description that goes into direct vs indirect territory because passive heating systems may be direct, indirect or isolated and light itself my be direct, diffuse or indirect. Then there's also the idea that secondary solar resources are indirect. Since both the resource and the technologies are described as direct vs indirect I think we should avoid this construction in the summary section because it's not explicit. The list hits most of the technologies without being overly tedious in my opinion. Mrshaba (talk) 16:48, 10 October 2008 (UTC)
- (edit conflict) I like the list but it needs editing. Vehicles could be in there. It doesn't currently deal well with solar in buildings - all buildings use solar energy in some way, not just those that could be classifed as "passive solar buildings". Buildings with active solar are also usually designed with passive solar in mind. I really liked the "light and radiant heat" formulation. I've tweaked the first para a bit but don't mind if it is changed again. Itsmejudith (talk) 16:50, 10 October 2008 (UTC)
- I believe the semicolons were appropriate but I'm not a blackbelt grammarian so no sweat. Light and radiant heat sounds fine to me. As to the list I think we need it to give the subject an overview. I do not think we should use a description that goes into direct vs indirect territory because passive heating systems may be direct, indirect or isolated and light itself my be direct, diffuse or indirect. Then there's also the idea that secondary solar resources are indirect. Since both the resource and the technologies are described as direct vs indirect I think we should avoid this construction in the summary section because it's not explicit. The list hits most of the technologies without being overly tedious in my opinion. Mrshaba (talk) 16:48, 10 October 2008 (UTC)
- All buildings might use solar energy but there has to be purpose in mind before you can classify the building as a solar building. Personally, I think there's enough about buildings with daylighting, water and space heating and photovoltaics. As to Judith's rejig, I preferred the shorter first sentence and I think the first paragraph should be dedicated to solar energy as a resource with the remaining paragraph(s) about the technologies. Vehicles can be added to the second paragraph easily enough or a third paragraph that mentions extended uses such as vehicles, solar fuels or storage also seems doable. Mrshaba (talk) 17:05, 10 October 2008 (UTC)
Moved lead to Talk:Solar energy/Sandbox. Please discuss here and make changes there (to the sandbox version). After we come to an agreement, it can be moved to the article lead. I fixed one problem and indicated < > three more that remain. The old version has been there for months and it won't hurt to leave there until we get it fixed. Cheers. Apteva (talk) 02:02, 11 October 2008 (UTC)
Changed "through a range of technologies" to "with a variety of technologies" - better grammar. Apteva (talk) 02:21, 11 October 2008 (UTC)
The second paragraph in particular is far from FA quality, "Solar energy technologies can provide daylighting etc. etc." is particularly poor. I was going to try to suggest an alternate, but I'll leave that to someone who can come up with something "engaging, even brilliant, and of a professional standard". Apteva (talk) 03:37, 11 October 2008 (UTC)
As you can see, we have by consensus continued to edit the article. You are welcome to offer suggestions, but do not continue to supplant what we have done with your own version, as that is disruptive and WP:OWN. If you want to make changes to the consensus lede, discuss it here first. --Skyemoor (talk) 09:04, 11 October 2008 (UTC)
- That wasn't done by consensus, that was done by subterfuge - participating in an edit war as a meatpuppet and then getting one party in the edit war blocked so that the other party could do what they wanted. What was it someone said? "let's do it in a sandbox as you describe and achieve consensus before making changes to the main article." Oh my that was you that said that. All I am doing is following through on that excellent suggestion. You, however are the disruptive one. You can't arbitrarily block one person and say oh I guess we have a consensus of one now. And calling that version "your own version" is pathetic. I probably wrote no more than four words of that four months ago, and nothing else. The process when editors can't agree on a new version is you go back to the previous version while it is under discussion. You have my full permission to choose any previous version from the entire month of August or September as the previous version. Apteva (talk) 14:53, 11 October 2008 (UTC)
- Apteva, you are not fooling anyone with an adjacent IP from MANCHESTER, MV COMMUNICATIONS INC. You not own this article, and you don't instruct us in which version of your text you want us to use. 3 of us have been editing the lede in a collaborative fashion, and you can either help or find something else to do. --Skyemoor (talk) 15:25, 11 October 2008 (UTC)
Too many changes needed, and too much edit warring. The sandbox is better. However we do need to agree on what version to throw up in the article in the meantime. Any preference? I can tell you ahead of time I won't agree to a version that has a percentage in the lead or does not have solar power in bold text. WE includes ME by the way, and clearly we are not successfully editing the article online. Apteva (talk) 22:26, 11 October 2008 (UTC)
- So stop edit warring and declaring what you insist must be in the article ("I won't agree"). Also, understand the difference between power and energy. 3 of us have been editing online, so don't continue to war against the consensus. --Skyemoor (talk) 00:27, 12 October 2008 (UTC)
- Actually I am only referring to the obvious. And yes I do know that P = dE/dt. Many of these subjects have been discussed at length. If you refer to the archives you will see why the article is about solar power and why most is more appropriate than a percentage. For example, as Itsmejudith stated, there are many school kids who use this article, and putting the percentage in the lead and in the body is redundant, and you can not put it in the lead if it is not in the body. I can't force you to use the sandbox, but your stubbornness to avoid procedure is very troublesome. All I can do is make the necessary edits, and explain the reasons. Right now the lead is twixt and between - it is a half-baked abomination that does not serve the needs of the reader. I can fix it, in one of two ways, I can go back to the September version, or I can go back to the edits I mentioned (Talk:Solar energy/Sandbox#Current), it is your choice. If you do not choose, I will choose the later. Apteva (talk) 03:55, 12 October 2008 (UTC)
- I just noticed another problem with #Current: It had said "Solar energy is the light and radiant heat from the Sun". That is false. That is a description of the energy from the sun. Solar energy is not the energy from the sun, but the ways that we use the energy from the sun. What do you think of the change to "Solar energy uses the light and radiant heat from the Sun"? Apteva (talk) 04:11, 12 October 2008 (UTC)
- I also took the liberty to add "the term", though it is likely the wording could be improved. Apteva (talk) 18:20, 12 October 2008 (UTC)
- Is energy only energy if we use it? Is the energy falling on your roof not really energy? Solar Energy doesn't 'use' the light and heat from the sun, though if the context, for purposes of discussion here, is only that energy which is captured, then we would need to say something like "Solar Energy is that energy from the Sun that is captured by means of solar collection", or the like. I'd like to hear how a few other editors think before moving forward with any such change. --Skyemoor (talk) 01:25, 13 October 2008 (UTC)
- Solar energy primarily refers to our use of solar energy. It also refers to all of the energy from the sun, and both are covered in the article. We have a section titled "Energy from the Sun" which covers the second definition of solar energy. The rest of the article is about our use of solar energy. Apteva (talk) 02:52, 14 October 2008 (UTC)
- Is energy only energy if we use it? Is the energy falling on your roof not really energy? Solar Energy doesn't 'use' the light and heat from the sun, though if the context, for purposes of discussion here, is only that energy which is captured, then we would need to say something like "Solar Energy is that energy from the Sun that is captured by means of solar collection", or the like. I'd like to hear how a few other editors think before moving forward with any such change. --Skyemoor (talk) 01:25, 13 October 2008 (UTC)
Please use the sandbox. "influences Earth's climate and weather" is clearly an understatement. Other than location on the planet what is there that determines the climate and the weather other than the sun? And the only reason that location on the planet determines the climate and the weather is because of the effect the location has on the amount of sun received. The point that is intended I believe, is not that the energy from the sun has an effect on the climate and the weather, but that it is the energy from the sun that determines the climate and provides the energy of the weather. That's where the word "drives" came from. Clearly there could be a better word than "drives", but equally clearly not "influences". Apteva (talk) 01:01, 13 October 2008 (UTC)
- Radiation of heat from the Earth out into space has as much influence on Earth's climate as does the sun. The amount and type of greenhouse gases is critically important (i.e., which is why is Venus hotter than Mercury). The tilt of the planet, it's rotational velocity, and it precession are also important factors. Do you have a more precise term than 'influences'? "Drives" denotes intent, which is not the case with the sun. --Skyemoor (talk) 01:25, 13 October 2008 (UTC)
- To me influences implies a small effect, and is not strong enough. I would use influence if you took the sun away (moved the earth completely out of the solar system) and the climate and weather stayed 90% the same as with the earth in orbit around the sun. Since the earth would quickly drop to way below freezing, "influences" is, in my opinion, not strong enough. "Drives" is not my favorite either, but has been in the article for a long time. I hope that someone can suggest a better word. Apteva (talk) 02:44, 13 October 2008 (UTC)
- I hope you also understand the inappropriateness of saying "more than 99.9%" in the body and "99.97%" in the lead - to most people (many people) numbers mean nothing and can't tell the difference between 9% and 99%, but everyone understands the word most. Apteva (talk) 02:47, 13 October 2008 (UTC)
- Could you have an administrator come in and explain why you should have exclusive rights to violate WP:WW? --Skyemoor (talk) 10:40, 13 October 2008 (UTC)
- Excuse me? WP:WW refers to a wheel war. "A wheel war is a struggle between two or more administrators in which they undo one another's administrative actions — specifically, unblocking and reblocking a user; undeleting and redeleting; or unprotecting and reprotecting a page." It is only common sense to summarize the article in the lead section, and use more general terms, such as most instead of 99% in the lead, but use 99% in the body. You can't put 99.97% in the lead and 99.9% in the body, because it isn't summarizing anything, the summary is in the body and the data is in the lead. I suspect you intended to mean don't use weasel words such as "Some people say...". However since the body uses 99.97%, that's clearly "most". Or the body would if you wouldn't keep reverting to an inappropriate version of the article. Apteva (talk) 01:58, 14 October 2008 (UTC)
- Could you have an administrator come in and explain why you should have exclusive rights to violate WP:WW? --Skyemoor (talk) 10:40, 13 October 2008 (UTC)
Copied from sandbox:
Rejected by whom?? See article talk page for discussions of the article.--Skyemoor (talk) 01:57, 13 October 2008 (UTC)
(referring to the section "Rejected proposal")
It does not matter who thought it had problems. The point is that someone thought that it was not salvageable and instead of copyediting it simply reverted it to the previous lead section. The reasons have partially been corrected, but a lot remains to be fixed before the lead is better than it was in September. Apteva (talk) 04:17, 13 October 2008 (UTC)
- One person does not 'reject' the work of other offers, hence the organization of the sandbox right now only reflects your wishes, not the work accomplished by 3 other editors. --Skyemoor (talk) 10:34, 13 October 2008 (UTC)
- Fixed label per above. The sandbox has four sections. They should be self explanatory. The first section is the lead as it appeared in the article after over 6,000 edits, in September. The third section was a radical change made by one editor and rejected by one editor. The second section is a collaborative improvement on that proposal by four editors. The fourth section is a sandbox to work on what the lead actually should consist of (make changes there, discuss them here). Apteva (talk) 18:02, 13 October 2008 (UTC)
The alternate proposal (the sandbox now has five sections) includes a false statement: "Solar power, often used as a synonym, is the rate of solar energy at a point in time." When we talk about installing solar power we are not talking about installing a rate of solar energy at a point in time, we are talking about installing some hardware to obtain electricity using solar energy/solar power. Solar power refers more to obtaining electricity from solar energy, solar energy refers more to all of the ways we use solar energy, active and passive. When people say "passive solar" they would tend to call that solar energy instead of solar power. Apteva (talk) 00:13, 14 October 2008 (UTC)
- You need to provide solid citations to back you up. The trouble is, there really isn't one lay definition of solar power. That's why the technical term is best, with acknowledgement that it is often used as a synonym for solar energy. You haven't provided anything whatsoever to back up your claim that the statement is false. --Skyemoor (talk) 01:39, 14 October 2008 (UTC)
- There are 9 million hits on google for solar power, 12 million for solar energy. Check a few of them for yourself. The technical definition of power vs. energy has nothing to do with this article. Apteva (talk) 01:58, 14 October 2008 (UTC)
- That proves nothing about usage. One has to be careful when assessing 'general usage' as one can filter everything by their own perspective, hence the need for verifiable references. I have, however, found this set of definitions that I believe will work for us (solar energy and solar power). So we could add to our current sentence on Solar Power, "and is commonly used to refer to electricity generated from solar radiation". I've updated the sandbox. --Skyemoor (talk) 13:21, 14 October 2008 (UTC)
- There are 9 million hits on google for solar power, 12 million for solar energy. Check a few of them for yourself. The technical definition of power vs. energy has nothing to do with this article. Apteva (talk) 01:58, 14 October 2008 (UTC)
(copied from sandbox)
- We are close enough to consensus that I'm going to go ahead and copy the #Consensus version over to the lead. See how quickly the process went when everyone actually used it, instead of just edit warring? The remaining problem is trivial, including a definition of power and energy in the lead and the peacock/weasel words. I do admit it is easy for me to forget that we are supposed to be English majors and simply reword what we find in a reference instead of actually be knowledgeable about a subject and use that knowledge to keep the articles accurate. In reality a balance of both is needed. Apteva (talk) 17:57, 14 October 2008 (UTC)
- My proposed lede removed the definition of "solar power" because there is no solid source for this definition. I put the definition of solar power together after writing to ISES, EIA, DOE, RMI, ASES, FSEC, Perlin, Sklar and a host of other solar authorities. Francis De Winter (a Solar Energy Hall of Fame member) got back to me from ISES concerning this definition of solar power and he supported it but said there is no consensus on the matter. Harold Hay is another Solar Energy Hall of Fame member that also supports the idea that solar power concerns electricity only but his blog does not meet WP's source standards. After some prodding, Scott Sklar published a response on Solar Access that also defines solar power as solar electricity but I don't think his response meets WP's source standards either. Perlin, on the other hand, didn't see anything wrong with Solar power as a name for the subject.
- The inclusion of solar power in the intro is a legacy issue that goes back to when this page was named "Solar power". I had the name of the page changed to Solar energy after extended wrangling with Apteva and Itsmejudith but the legacy of solar power still stands in the intro. Itsmejudith has completely come around to the idea of the subject as Solar energy but Apteva brings up the page name issue frequently. I have reviewed all the major encyclopedia entries on this subject and all of them refer to the subject as "Solar energy" and redirect solar power to solar energy.
- I have never run across a source that breaks down the colloquial difference between solar energy and solar power but, to me, the technical difference between energy and power does not in any way define solar energy vs. solar power. I think this technical definition is back door OR because I've never seen this technically oriented definition supported by a document. This is a tough one, I have sought a source that relates the terms solar energy and solar power for over a year but have not found one. I like my colloquial formulation because it is a researched synthesis but it does not meet WP's general source standards.
As stated, technically "solar energy" means all the energy from the sun, while "solar power" means how we get electricity from solar energy. As one editor stated, anyone who sticks to a technical definition of either is just going to confuse their audience. The point is that they do mean different things, but not in the sense that power and energy are different, just in the sense that there are two ways to skin a cat. Focusing on where the energy comes from, or what we do with it. The article on the sun addresses the first question, this article the second. Apteva (talk) 21:21, 20 October 2008 (UTC)
- Solar power can be covered in a third paragraph. Alternately, I think solar power can be mentioned in the Solar electricity section rather than the intro. Either way, can you provide a source for the technical "solar power = solar energy per time" description you inserted? Personally, I don't think the relationship between energy and power should be used to define the relationship between solar power and solar energy. Mrshaba (talk) 21:39, 20 October 2008 (UTC)
- Although not in that order. Solar power should be in the lead because that is what people are actually looking for, the article on solar power. Solar power gets 80,000 hits a month, solar energy 100,000. There are a bazillion links to each and who knows what people are typing into the search box. By a third paragraph I assume you mean have three paragraphs in the lead and use the second one to cover solar power. It really doesn't matter to me if they are separated or combined, such as the simple sentence that we had before, Solar power is often used interchangeably with solar energy but refers specifically to producing electricity from solar energy (and then move the stuff about photovoltaics to this sentence). As you know I strongly prefer a three paragraph lead, because of the guideline suggesting that for such a long article the lead should be 3 to 4 paragraphs. By the way, as I recall the article was arbitrarily moved by an admin because they preemptively decided that solar energy was the more common term, not the result of any discussion about the move. By the way, the entire structure of the article has been questioned. And frankly is a mess. Apteva (talk) 22:20, 20 October 2008 (UTC)
(undent) just passing by, but I thought I'd throw in a couple of comments.
- Solar Power - i.e., the generation of electricity from sunlight - really out to be the first thing in the lead. Solar energy itself is a relatively abstract concept. no one uses solar energy directly, but only through secondary or tertiary transformations.
- 'light and radiant heat' should be just simple 'radiant energy'
- the 'since ancient times' passage is odd and misleading. the only direct use of solar energy (setting aside wind and water power, since the ancients would not have connect those to solar radiation) would have been in evaporation and drying, and maybe (if you want to push the point) agriculture. add that the 'range of technologies' the ancients are supposed to have used are never mentioned int he body of the article, and this point seems superfluous.
that's it. ![]() --Ludwigs2 06:47, 22 October 2008 (UTC)
--Ludwigs2 06:47, 22 October 2008 (UTC)
- I agree that "Solar Power" is electricity from sunlight but "Solar Energy" is a broader topic and encompasses a broader range of technologies. Look into how Grolliers, World Book and Brittanica cover the subject - Solar energy. I've taken this question to ASES, ISES, Perlin, Sklar, the DOE, NREL etc. The majority of responses classify Solar Energy as all direct solar technologies and Solar Power as a subset of solar technologies having to do with electricity.
- The Chinese installed about 15 Gigawatts of solar water heaters in 2007 compared to 3 GW of PV installed worldwide. SODIS provides drinking water to millions of people worldwide. Norway gets 15 percent of its home heating from Passive Solar. Why should electricity get the spotlight?
- Daylighting is a direct use of Solar energy.
- The most common definition of Solar Energy I've found is "light and heat from the Sun". Solar energy is radiant energy is redundant. Come back next month, the first sentence changes a lot.
- I do not care for the current mention of the ancients in the intro but there is truth to the statement. The Greeks suffered from deforestation and turned to passive solar design to supplement heating as firewood became scarce. Socrates and Vetruvius talked about passive solar design - See Perlin. The Chinese and Japanese also have an ancient tradition of passive solar design - See Perlin. These points are mentioned. Mrshaba (talk) 11:56, 22 October 2008 (UTC)
- I find Ludwigs suggestions to be well reasoned and recommend they be adopted. There is one glitch though, how to mention solar power first and still bolden the article title at the earliest possible location in the text. For what it is worth, there has been a spike in searches for solar power instead of solar energy in October, so far they are running 2:1 instead of 0.8:1 or so (100,000 vs 49,000 in October, 80,000 vs 100,000 in September). My guess is that Solar Power International may have something to do with that, plus the US just renewing the 30% tax credit for solar power for 8 years. By the way, the ancients didn't make a science out of daylighting like we do today. I of course like electricity getting the "spotlight", but I would not approach it in that manner; simply organize the lead and the article by what people are looking for when they search on solar power/solar energy. Does anyone know how to find out how many people are searching for each term in Google and Yahoo? Apteva (talk) 21:28, 22 October 2008 (UTC)
- See Solar power --> Solar energy rename discussion
- In 2007 a google search for "solar energy" comes up with 2,810,000 hits. A google search for "solar power" comes up with "1,600,000" hits. A google book search for "solar energy" comes up with 15,900 hits while "solar power" comes up with 2,790.
- In 2008 a google search for "solar energy" come up with 12,800,000 hits. A google search for "solar power" comes up with 9,300,000 hits. A google book search for "solar energy" comes up with 19,439 hits while "solar power" comes up with 3,890. A google scholar search for ::"solar energy" gets 402,000 hits while "solar power" gets 45,300 hits. Mrshaba (talk) 22:57, 22 October 2008 (UTC)
- I wasn't asking about hits, I was asking about searches. For example when you did your search to find out how many hits each got, that was one search for each. I know the information is compiled, I have often heard people say in the news for example, that the number one search term was say Brittany Spears. Hits are how many articles mention the term, searches mean how many people are looking for those articles. Apteva (talk) 23:18, 22 October 2008 (UTC)
Solar energy is used directly in a) passive solar building heat, b) active solar building heat, c) solar hot water, d) solar heat used in industrial process, etc., so there's nothing abstract about it. Solar power is one aspect of solar energy, hence is a sub-category. --Skyemoor (talk) 10:57, 25 October 2008 (UTC)
- Skyemoor - Can you provide a source for the technical "solar power = solar energy per time" description you inserted in the lead? Mrshaba (talk) 22:25, 25 October 2008 (UTC)
- It is based on the axiom power x time = energy. --Skyemoor (talk) 22:48, 25 October 2008 (UTC)
- And even though it is true, it isn't particularly relevant to the article. The main difference between solar power and solar energy being that the terms are used interchangeably, but one technically refers to all of the suns energy and how we use it, the other more specifically to the ways we get electricity from the sun. I see the source in a spike in hits for each is just whatever words are used that week in the news. One way to understand the difference between energy and power is to look at Lake Mead - the flow of water through the dynamo is the power output, the storage of water in the reservoir behind the dam is the amount of energy available. 3 + 4 = 7 but we don't explain that in the article. Anyone who is curious what power or energy is can type them into the search box on their own - there is no reason to make a link to either. Understanding the difference between power and energy is the province of physics, and physics is one of the most difficult courses to understand. The power article, by the way, says it well - among other things, "Electric power generation ... as in ... solar power..." Apteva (talk) 00:02, 26 October 2008 (UTC)
- I don't think an axiom works in this situation. If I apply the relationship between energy and power to the term Concentrating soloar power I get mush instead of the specific set of technologies that CSP refers to. You (Skyemoor) said above, "solar power is one aspect of solar energy, hence is a sub-category". I agree with this but I don't see how this statement fits with the solar power = solar energy per time idea. Mrshaba (talk) 23:03, 26 October 2008 (UTC)
- And even though it is true, it isn't particularly relevant to the article. The main difference between solar power and solar energy being that the terms are used interchangeably, but one technically refers to all of the suns energy and how we use it, the other more specifically to the ways we get electricity from the sun. I see the source in a spike in hits for each is just whatever words are used that week in the news. One way to understand the difference between energy and power is to look at Lake Mead - the flow of water through the dynamo is the power output, the storage of water in the reservoir behind the dam is the amount of energy available. 3 + 4 = 7 but we don't explain that in the article. Anyone who is curious what power or energy is can type them into the search box on their own - there is no reason to make a link to either. Understanding the difference between power and energy is the province of physics, and physics is one of the most difficult courses to understand. The power article, by the way, says it well - among other things, "Electric power generation ... as in ... solar power..." Apteva (talk) 00:02, 26 October 2008 (UTC)
- It is based on the axiom power x time = energy. --Skyemoor (talk) 22:48, 25 October 2008 (UTC)
Energy Units
The table still needs work with respect to energy and power. The total yearly world energy consumption is 369.7 Billion kWhrs (or 369.7 TWhrs) from EIA http://www.eia.doe.gov/pub/international/iealf/table11.xls
However, solar flux (and wind, etc) is provided in PW, not PWhr. This number needs to be multiplied by 24 hr/day * 7 day/week * 52 week/yr = 8736
So solar would be (if using the 86,000 TW figure) 751,296,000,000,000 MWhr (or 751,296,000 TWhr)
Since power plants are rated in MW, GW, etc, and people get their electric bills in kWhr, it makes sense to reach the greatest number of people with units in some multiplier of Watts.
Wind was estimated by the source at 72 TW, which becomes 628,992 TWhr
I could not find one biomass figure in the source, so please be more specific in the cite. Let's leave it off until we determine the right number.
I like Fullstop's comparison of the energy source to energy consumption, so will use the consumption data in the chart when I get a moment. --Skyemoor (talk) 13:09, 17 October 2008 (UTC)
- Solar flux can be measured in cow patties for all I care (they are used as a source of energy in some parts of the world), but for the purposes of this article, it makes more sense to use SI units, and use the same multiplier for each unit. People do not get their electric bills in TWhr or MWhr or TWh or MWh for that matter, so why you would choose TWh is very unusual. Solar flux at night is zero no matter what units are used, and that needs to be included. I have not checked your numbers, because your choice of units is not appropriate. The table that was put into the article is one that was carefully worked on in the RFM and arrived at by consensus and for good reasons. I would suggest that someone other than you restore it, because you have been asked not to edit the article at all until the table vs. diagram issue has been resolved,[10] and clearly that could take a very long time. Leaving out a number for biomass just because you couldn't find it is not appropriate (it is given as 3x10²¹ J/year), as it is easy to find a number for biomass, and since it uses a separate reference for every item there is no need for any of them to come from the same source as any other. The GCEP diagram, however does serve as a cross reference and gives the number as 90 PW (2.8 x 10²¹ J/year). The number for wind, 72 TW, is not the amount of energy in the wind, which is 870 TW, but the amount that exists over land at 80 m hub height, in regions with an average wind speed of 6.9 m/s (See[11] pg. 17. That important point was not carried over to the other paper). It doubles at 100 m. I do not object to moving the location of the table, but believe that this edit[12] should be reverted, and since it is your own edit, it does not matter who does that. Frankly I had not noticed that the wind number was incorrect, because of course I believe that the diagram is much better than the table. And please do not include Fullstop's unhelpful WP:OR calculating the percentages and relationships between the data. If you want to work on the table, I suggest you do so in the sandbox, because your suggested changes have not been productive. And no the table does not need work with respect to energy and power. Apteva (talk) 21:41, 17 October 2008 (UTC)
- I see that the reference for biomass[13] confuses the energy of the sun reaching the surface with the energy reaching the outside of the atmosphere, and gives the amount reaching the surface each year as 5.7 x 1024 J, instead of 2.7 x 1024. Apteva (talk) 22:02, 17 October 2008 (UTC)
- The supposition that "calculating percentages and relationships between the data" is OR has to be one of the most WP:LAWYERy, and least thought-through things yet said on this page. If elementary '((7200 * 100) / 15000) = 48%' is OR, then what on earth is the slicing-and-dicing of data for the diagrams?
- Besides, math is not OR. It does not reach a novel conclusion, and in this case the result can even be verified without specialized knowledge. But even the math-illiterates who cannot verify ((7200 * 100) / 15000) = 48% can be compensated for; simply use the Mediawiki parser functions to do the job: {{pct|7200|15000|0}} => 48%. QEF.
- Apteva's stance has passed all points of reasonableness, and it is patently obvious that there is a willful refusal to 'get the point' despite reasoned opinions and comments provided by experienced editors, independent editors, and by mediators.
The repeated (e.g. twice immediately above, numerous other examples elsewhere) mis-characterization of other editors' actions in order to make them seem unreasonable, improper, or deserving of sanction is Gaming the system, as are also the attempts to force an untoward (contra community-accepted) interpretation of policy (also immediately above). -- Fullstop (talk) 15:15, 18 October 2008 (UTC)- Your editorial remarks about my reasonableness are misplaced. I am always quite reasonable. And WP:Point is a separate concept, it refers to trashing WP to make a point, totally different than being thick skulled, which I am not. It would be stupid to the point of moronic to use the table above explaining that 86,000 = 5,733 times 15. Apteva (talk) 16:08, 18 October 2008 (UTC)
- Charming as always, eh? You may wish to check which WP:page those sentences are from. Besides determining that they are not "editorial remarks", you should of course also find that the assertion that "WP:Point is a separate concept" is not true.
- No matter. I did not expect you to get the hint (get the point about WP:POINT) anyway.
- As far as your "always quite reasonable" is concerned, I'm afraid I cannot take your word for it; not after the numerous suggestions of impropriety just because people disagree with you; Or of your choice of words when referring to others/ideas of others (in the latest two instances alone) "unhelpful", "not been productive", "moronic" (hardly middle-of-the-road language). Or for that matter the "six [editors] are wrong and one is right"; Or the tendentious reinsertion even though there is overwhelming agreement to not use the diagrams.
- Oh well. -- Fullstop (talk) 19:09, 18 October 2008 (UTC)
So create a better diagram. In the meantime it is the best we have. There are 180,000 page views a month of this article. Lets say that on average that is 10 per viewer. That's 18,000 unique users. Find out what they are looking for in the article. Basing a decision on 6 users is not a very good sample. Especially when no valid reason has been given for not using the diagram.
- Original research - no, it is a diagram, and validly created - not a valid reason
- Subject incorrect - the energy vs power argument that really doesn't hold any water - not a valid reason
- Taking figures from two sources - wrong, the original diagram did that, though that in itself would not be a problem - not a valid reason
- Exergy vs Energy - for many cases they are the same, and besides exergy is better because it represents useful energy (by the way exergy is not "energy available for human use") - not a valid reason
- Three dimensional diagram - when ratios are large, area diagrams are used instead of bar graphs, but when they are too large they don't work, and volume graphs work better - not a valid reason
- Low quality picture - bad artwork can be fixed - not a valid reason
- Layout wonky - same as above - not a valid reason
- Not an adequate comparison - this is the best we have - not a valid reason
- It has been removed by others - sure, but not for any valid reason
- We came out of the Rfc with a consensus - no, I was part of the RFC and did not agree - not a valid reason
- Data conflicts with other data on the page - hello, there are multiple estimates for everything - not a valid reason
- This really set me off - what? That's a reason? - not a valid reason
- The numbers being compared in the graph are not actually comparable - yes they are - not a valid reason
- The use of log10 scale & 3D volumes misrepresent the relative value of the numbers - diagrams show relationships, and no matter what scale is use the relative relationship does not change - not a valid reason
- Boxes can not be used to present information - huh? they are taught in courses on graphing as the simplest type of volume graph - not a valid reason
- A disservice to the reader - it is a disservice to the reader to not come up with an appropriate diagram such as any of 2, 3, or 4. - not a valid reason
- Hand drawn - bad artwork can be fixed - not a valid reason
I think that covers most of them. Fix it (make a better one) or use it - either is fine, but taking it out is not. Apteva (talk) 16:56, 21 October 2008 (UTC)
- ^ Smil (2006), p. 12
- ^ Archer, Cristina. "Evaluation of Global Wind Power". Stanford. Retrieved 2008-06-03.
{{cite web}}: Unknown parameter|coauthor=ignored (|author=suggested) (help) - ^ "Energy conversion by photosynthetic organisms". Food and Agriculture Organization of the United Nations. Retrieved 2008-05-25.
- ^ "World Total Net Electricity Consumption, 1980-2005". Energy Information Administration. Retrieved 2008-05-25.
- ^ "World Consumption of Primary Energy by Energy Type and Selected Country Groups, 1980-2004". Energy Information Administration. Retrieved 2008-05-17.