
Size of this JPG preview of this PDF file: 585 × 599 pixels. Other resolutions: 234 × 240 pixels | 469 × 480 pixels | 952 × 975 pixels.
Original file (952 × 975 pixels, file size: 41 KB, MIME type: application/pdf)
| This is a file from the Wikimedia Commons. Information from its description page there is shown below. Commons is a freely licensed media file repository. You can help. |
Summary
| Description |
English: Illustration of three types of tipping point; (a), (b) noise-, (c), (d) bifurcation- and (e), (f) rate-induced. (a), (c), (e) example time-series (coloured lines) through the tipping point with black solid lines indicating stable climate states (e.g. low or high rainfall) and dashed lines represent the boundary between stable states. (b), (d), (f) stability landscapes provide an intuitive understanding for the different types of tipping point. The valleys represent different climate states the system can occupy with hill tops separating the stable states. The stability of a climate state is implied by both the depth of the valley and the distance to the hill top. The current state of the system is represented by a ball. All scenarios assume that the ball starts in the left hand valley (black dashed lines) and then through different mechanisms dependent on the type of tipping transitions to the right valley (coloured lines). Noise-induced tipping events, for instance Dansgaard-Oeschger events, materialise from natural fluctuations within the system. The stability landscape in this scenario remains fixed and stationary. A series of perturbations in the same direction or one large perturbation are required to force the system over the hill top and into the alternative stable state. Bifurcation-induced tipping events, such as a collapse of the AMOC under climate change, occur when a critical level in the forcing is reached. Here the stability landscape is subjected to a change in shape. Under gradual anthropogenic forcing the left valley begins to shallow and eventually vanishes at the tipping point, forcing the system to transition to the right hand valley. Rate-induced tipping events, for example combustion of compost heaps (compost bomb instability), arise when a system is unable to adapt (sufficiently quickly) to its changing environment. The stability landscape remains fixed in shape but instead gets dragged/pushed. Consider the stability landscape being dragged to the left. The ball will lag behind the moving valley. There exists a critical rate at which the landscape is dragged such that for slower rates the ball will remain in the left valley. However, rates faster than the critical rate and the ball will lag too far behind such that it moves over the hill top and consequently transition to the right hand valley. |
| Date | |
| Source | Own work |
| Author | Paul Ritchie |
Licensing
I, the copyright holder of this work, hereby publish it under the following license:
This file is licensed under the Creative Commons Attribution-Share Alike 4.0 International license.
- You are free:
- to share – to copy, distribute and transmit the work
- to remix – to adapt the work
- Under the following conditions:
- attribution – You must give appropriate credit, provide a link to the license, and indicate if changes were made. You may do so in any reasonable manner, but not in any way that suggests the licensor endorses you or your use.
- share alike – If you remix, transform, or build upon the material, you must distribute your contributions under the same or compatible license as the original.
File history
Click on a date/time to view the file as it appeared at that time.
| Date/Time | Thumbnail | Dimensions | User | Comment | |
|---|---|---|---|---|---|
| current | 15:26, 8 August 2022 | 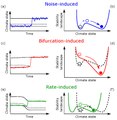 | 952 × 975 (41 KB) | Paulski89 | Uploaded own work with UploadWizard |
File usage
The following pages on the English Wikipedia use this file (pages on other projects are not listed):