This article is within the scope of WikiProject Statistics, a collaborative effort to improve the coverage of statistics on Wikipedia. If you would like to participate, please visit the project page, where you can join the discussion and see a list of open tasks.StatisticsWikipedia:WikiProject StatisticsTemplate:WikiProject StatisticsStatistics articles
Latest comment: 10 years ago2 comments2 people in discussion
"In practice, values greater than 2 or smaller than -2 indicate spatial autocorrelation that is significant at the 5% level."
The value of Moran's I ranges from -1 for negative spatial autocorrelation to +1 for positive spatial autocorrelation. Probably z scores are meant?
— Preceding unsigned comment added by 123.231.21.45 (talk • contribs) 08:40, 13 February 2008 (UTC)Reply
is not correct. Moran discussed something completely different in that work. —Preceding unsigned comment added by 149.157.1.184 (talk) 16:40, 14 March 2008 (UTC)Reply
The source is correct, but the page numbers are 17-23. —Preceding unsigned comment added by 92.204.65.109 (talk) 09:50, 31 March 2009 (UTC)Reply
Some clue about where the wij's come from would make this article alot more useful. —Preceding unsigned comment added by 129.49.66.240 (talk) 13:19, 27 May 2008 (UTC)Reply
Agreed! I will add this shortly Nate Wessel (talk) 05:00, 14 November 2016 (UTC)Reply
The wij's should be chosen so that point pairs, which would have a strong correlation under some plausible alternative hypothesis, have the highest weights. You could use the inverse of the Euclidian distance, for example. Hopefully someone who knows more about this can ammend the text.Helenuh (talk) 13:36, 10 December 2014 (UTC)Reply
I think the expected value of Moran's I given in this section assumes no correlation. This assumption should be stated. Carbone1853 (talk) 16:48, 14 May 2009 (UTC)Reply
Latest comment: 14 years ago2 comments2 people in discussion
I am trying to program this into python, and I realized that the article doesn't explain what I is. I'm assuming that I is a single number which tells you roughly that the data is highly organized, or totally random. However, it doesn't tell you anything about a specific point. Correct? For example, it doesn't tell what region has the highest concentration, or so on. Maybe this could be made more clear in the article Paskari (talk) 16:28, 7 September 2009 (UTC)Reply
You're right: Moran's Index (I) is a global indicator of spatial association, so doesn't say anything about local associations. I just added a internal reference to Indicators of spatial association.--Kangreixo (talk) 12:10, 22 September 2009 (UTC)Reply
I believe the first occurrence of the formulas for the variance and mean appear in:
> Cliff, A. D., and J. K. Ord. (1969). ‘‘The Problem of Spatial Autocorrelation.’’ In London Papers in Regional Science, 25–55, edited by A. J. Scott. London: Pion.
However, I don't have access to this book. Online, I found another article mentioning the same equations:
> Cliff, A., & Ord, K. (1970). Spatial Autocorrelation: A Review of Existing and New Measures with Applications. Economic Geography, 46, 269-292. doi:10.2307/143144 ==
Expected value of I if there is zero autocorrelationedit
Latest comment: 9 years ago1 comment1 person in discussion
The article contradicts itself on this point. Is it zero or is it -1/(N-1) ? Presumably -1/(N-1) is the expected value of the biased ML-estimator or something like that.Helenuh (talk) 13:43, 10 December 2014 (UTC)Reply
Latest comment: 9 years ago1 comment1 person in discussion
The z test needs a z that is Gaussian distributed but I is bounded, so we would need the variance of some Gaussian transform z(I,V). The variance of I is not helpful for this purpose. Helenuh (talk) 14:09, 10 December 2014 (UTC)Reply
Latest comment: 4 years ago1 comment1 person in discussion
I am having trouble even beginning to express my confusion about this article. Especially the "definition" which defines nothing. As given, Xi has no obvious meaning (to me, and I'd guess to most people). And then there's the image. In the checkerboard image, how would X1 be interpreted? Are we supposed to guess what black + white means? And the caption of the image is awful. The definition requires assigning a weight matrix to compute I, so the claim that it's I value "is" -1 without assigning W is wrong.:: After some more intense study, I'd guess that the "neighbors" of a given indexed cell (spatial unit?) are themselves indexed and the (numerical) value of the variable (x) for each is used in the computation. If this is correct, it isn't clear to me whether the indices must be "regularly" spaced. Would a random graph (each vertex being connected to an arbitrary number of others across arbitrary distances) have an I value? How would you index it? Wouldn't you need at least 3 indices (one to specify vertex, one to specify "proximity" (i.e. least separation) and the third to run over the set with that specified proximity)? Do es the I metric require a (well ordered) grid of some sort?
I think the article should also mention that this statistic requires a finite number of cells (units?). (As well as some other assumptions - such as that the 'proximity' is a known (or calculable) cardinal (ordinal?).40.142.185.108 (talk) 12:13, 14 June 2019 (UTC)Reply
Latest comment: 15 days ago2 comments1 person in discussion
The second figure introduces a bunch of stuff not explained or even mentioned elsewhere in the article.
What is a hand map? Hand drawn?
What is the q statistic?
What is a strata? What is their purpose and how are they chosen?
Some of the ps and qs have subscripts denoting rather strange combinations of these strata. What motivates this? What does it mean when there is no subscript?
I don't think any of this stuff is standard in discussions of Moran's index (nothing I've ever come across...) and it's so confusing I'd suggest deleting it. WikiNukalito (talk) 19:39, 17 April 2024 (UTC)Reply
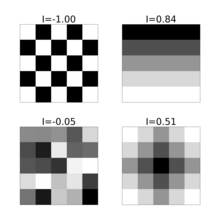
Suggest replacing with this, simpler, figure
Moran's I statistic computed for different spatial patterns. Using 'rook' neighbors for each grid cell, setting for neighbours of and then row normalizing the weight matrix. Top left shows anti-correlation giving a negative I. Top right shows a spatial gradient giving a large positive I. Bottom left shows random data giving a value of I near 0 (or ). Bottom right shows an 'ink blot' or spreading pattern with positive autocorrelation.WikiNukalito (talk) 20:25, 17 April 2024 (UTC)Reply