In statistics, Moran's I is a measure of spatial autocorrelation developed by Patrick Alfred Pierce Moran.[1][2] Spatial autocorrelation is characterized by a correlation in a signal among nearby locations in space. Spatial autocorrelation is more complex than one-dimensional autocorrelation because spatial correlation is multi-dimensional (i.e. 2 or 3 dimensions of space) and multi-directional.

Global Moran's I edit
Global Moran's I is a measure of the overall clustering of the spatial data. It is defined as

where
- is the number of spatial units indexed by and ;
- is the variable of interest;
- is the mean of ;
- are the elements of a matrix of spatial weights with zeroes on the diagonal (i.e., );
- and is the sum of all (i.e. ).


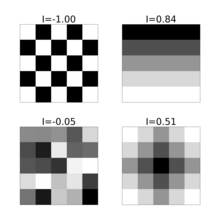
Moran's I statistic computed for different spatial patterns. Using 'rook' neighbors for each grid cell, setting for neighbours of and then row normalizing the weight matrix. Top left shows anti-correlation giving a negative I. Top right shows a spatial gradient giving a large positive I. Bottom left shows random data giving a value of I near 0 (or ). Bottom right shows an 'ink blot' or spreading pattern with positive autocorrelation.


Defining the spatial weights matrix edit
The value of can depend quite a bit on the assumptions built into the spatial weights matrix . The matrix is required because, in order to address spatial autocorrelation and also model spatial interaction, we need to impose a structure to constrain the number of neighbors to be considered. This is related to Tobler's first law of geography, which states that Everything depends on everything else, but closer things more so—in other words, the law implies a spatial distance decay function, such that even though all observations have an influence on all other observations, after some distance threshold that influence can be neglected.

The idea is to construct a matrix that accurately reflects your assumptions about the particular spatial phenomenon in question. A common approach is to give a weight of 1 if two zones are neighbors, and 0 otherwise, though the definition of 'neighbors' can vary. Another common approach might be to give a weight of 1 to nearest neighbors, 0 otherwise. An alternative is to use a distance decay function for assigning weights. Sometimes the length of a shared edge is used for assigning different weights to neighbors. The selection of spatial weights matrix should be guided by theory about the phenomenon in question. The value of is quite sensitive to the weights and can influence the conclusions you make about a phenomenon, especially when using distances.

Expected value edit
The expected value of Moran's I under the null hypothesis of no spatial autocorrelation is

The null distribution used for this expectation is that the input is permuted by a permutation picked uniformly at random (and the expectation is over picking the permutation).

At large sample sizes (i.e., as N approaches infinity), the expected value approaches zero.
Its variance equals

where


Values significantly below -1/(N-1) indicate negative spatial autocorrelation and values significantly above -1/(N-1) indicate positive spatial autocorrelation. For statistical hypothesis testing, Moran's I values can be transformed to z-scores.
Values of I range between and [4] where and are the corresponding minimum and maximum eigenvalues of the weight matrix. For a row normalised matrix .


Moran's I is inversely related to Geary's C, but it is not identical. Moran's I is a measure of global spatial autocorrelation, while Geary's C is more sensitive to local spatial autocorrelation.
Local Moran's I edit
Global spatial autocorrelation analysis yields only one statistic to summarize the whole study area. In other words, the global analysis assumes homogeneity. If that assumption does not hold, then having only one statistic does not make sense as the statistic should differ over space.
Moreover, even if there is no global autocorrelation or no clustering, we can still find clusters at a local level using local spatial autocorrelation analysis. The fact that Moran's I is a summation of individual cross products is exploited by the "local indicators of spatial association" (LISA) to evaluate the clustering in those individual units by calculating Local Moran's I for each spatial unit and evaluating the statistical significance for each Ii. From the equation of Global Moran's I, we can obtain:

where:

then,

I is the Global Moran's I measuring global autocorrelation, Ii is local, and N is the number of analysis units on the map.
LISAs can for example be calculated in GeoDa, which uses the Local Moran's I,[5] proposed by Luc Anselin in 1995.[6]
Uses edit
Moran's I is widely used in the fields of geography and geographic information science. Some examples include:
- The analysis of geographic differences in health variables.[7]
- Characterising the impact of lithium concentrations in public water on mental health.[8]
- In dialectology to measure the significance of regional language variation.[9]
- Defining an objective function for meaningful terrain segmentation for geomorphological studies[10]
See also edit
References edit
- ^ Moran, P. A. P. (1950). "Notes on Continuous Stochastic Phenomena". Biometrika. 37 (1): 17–23. doi:10.2307/2332142. JSTOR 2332142. PMID 15420245.
- ^ Li, Hongfei; Calder, Catherine A.; Cressie, Noel (2007). "Beyond Moran's I: Testing for Spatial Dependence Based on the Spatial Autoregressive Model". Geographical Analysis. 39 (4): 357–375. doi:10.1111/j.1538-4632.2007.00708.x.
- ^ Cliff and Ord (1981), Spatial Processes, London
- ^ de Jong, P., Sprenger, C. and van Veen, F., 1984. On extreme values of Moran's I and Geary's c. Geographical Analysis, 16(1), pp.17-24.
- ^ Anselin, Luc (2005). "Exploring Spatial Data with GeoDaTM: A Workbook" (PDF). Spatial Analysis Laboratory. p. 138.
- ^ Anselin, Luc (1995). "Local Indicators of Spatial Association—LISA". Geographical Analysis. 27 (2): 93–115. doi:10.1111/j.1538-4632.1995.tb00338.x.
- ^ Getis, Arthur (3 Sep 2010). "The Analysis of Spatial Association by Use of Distance Statistics". Geographical Analysis. 24 (3): 189–206. doi:10.1111/j.1538-4632.1992.tb00261.x.
- ^ Helbich, M; Leitner, M; Kapusta, ND (2012). "Geospatial examination of lithium in drinking water and suicide mortality". Int J Health Geogr. 11 (1): 19. doi:10.1186/1476-072X-11-19. PMC 3441892. PMID 22695110.
- ^ Grieve, Jack (2011). "A regional analysis of contraction rate in written Standard American English". International Journal of Corpus Linguistics. 16 (4): 514–546. doi:10.1075/ijcl.16.4.04gri.
- ^ Alvioli, M.; Marchesini, I.; Reichenbach, P.; Rossi, M.; Ardizzone, F.; Fiorucci, F.; Guzzetti, F. (2016). "Automatic delineation of geomorphological slope units with r.slopeunits v1.0 and their optimization for landslide susceptibility modeling". Geoscientific Model Development. 9: 3975–3991. doi:10.5194/gmd-9-3975-2016.