File:VFPt cylindrical magnets orthogonal.svg

Original file(SVG file, nominally 720 × 600 pixels, file size: 52 KB)

Summary

Description
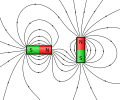
English: Magnetic field of an two ideal cylindrical magnets with their axis of symmetry inside the image plane. The magnets are aligned orthogonal to each other, creating complex winding field lines.
Date
Source Own work
Author Geek3
Other versions
SVG development
InfoField
 
The SVG code is valid.
 
This plot was created with VectorFieldPlot.
 
This file uses embedded text.
Source code
InfoField

Python code

# paste this code at the end of VectorFieldPlot 1.4
M = 1.0 # magnetic moment
l = 0.75
r = 0.25
x = 1.25
doc = FieldplotDocument('VFPt_cylindrical_magnets_orthogonal',
                        width=720, height=600, commons=True)
fieldB = Field({'coils':[[-x, 0, 0, r, l, M/(r**2*pi)], [x, 0, pi/2, r, l, M/(r**2*pi)]]})
# use the H-field with magnetic monopoles, because its lines terminate
# easier. The shape of the field of H and B is actually identical.
fieldH = Field({'charged_discs':[
          [-x-l, -r, -x-l, r, -0.5*M/l], [-x+l, -r, -x+l, r,  0.5*M/l],
          [x-r, -l, x+r, -l, -0.5*M/l], [x-r, l, x+r, l,  0.5*M/l]]})
doc.draw_magnets(fieldB)

def startpoints(funcxy, t0, t1, n, field):
    '''
    find n startpoints for magnetic fieldlines that are distributed evenly
    along a path defined by the parametric function funcxy, such that the
    integrated field perpendicular to the path is equal between
    neighbouring startpoints
    '''
    f = lambda t: sc.array(funcxy(t)) # wrap
    eps = 1e-7
    def orth(t):
        dfdt = (f(t+eps) - f(t-eps)) / (2*eps)
        return fabs(sc.cross(dfdt, field.F(f(t))))
    
    Ftot = ig.quad(orth, t0, t1)[0]
    FF = sc.linspace(0, 1, n, endpoint=False) + 0.5/n
    tlist = [op.fsolve(lambda t:ig.quad(orth, t0, t)[0]/Ftot - F,
             t0 + F * (t1 - t0), xtol=1e-6) for F in FF]
    return [funcxy(t) for t in tlist]

pts = startpoints(lambda t: [-x-l+cos(t)*l,sin(t)*l], 0, 2*pi, 20, fieldH)
pts2 = startpoints(lambda t: [x-sin(t)*l,-l+cos(t)*l], 0, 2*pi, 20, fieldH)
pts3 = startpoints(lambda t: [x-sin(t)*l,l-cos(t)*l], 2.37, 4.39, 6, fieldH)
for pt in pts + pts2 + pts3:
    maxr = 6.5
    if pt in pts3: maxr = 3
    line = FieldLine(fieldH, pt, directions='both', maxr=maxr)
    doc.draw_line(line, arrows_style={'dist':1.7, 'offsets':[1., .5, .5, 1.]})

doc.write()


Licensing

I, the copyright holder of this work, hereby publish it under the following license:
w:en:Creative Commons
attribution share alike
This file is licensed under the Creative Commons Attribution-Share Alike 4.0 International license.
You are free:
  • to share – to copy, distribute and transmit the work
  • to remix – to adapt the work
Under the following conditions:
  • attribution – You must give appropriate credit, provide a link to the license, and indicate if changes were made. You may do so in any reasonable manner, but not in any way that suggests the licensor endorses you or your use.
  • share alike – If you remix, transform, or build upon the material, you must distribute your contributions under the same or compatible license as the original.

Captions

Add a one-line explanation of what this file represents

Items portrayed in this file

depicts

25 May 2017

image/svg+xml

File history

Click on a date/time to view the file as it appeared at that time.

Date/TimeThumbnailDimensionsUserComment
current21:51, 25 May 2017Thumbnail for version as of 21:51, 25 May 2017720 × 600 (52 KB)Geek3User created page with UploadWizard
The following pages on the English Wikipedia use this file (pages on other projects are not listed):

Global file usage

The following other wikis use this file:

Metadata