
Original file (SVG file, nominally 1,200 × 800 pixels, file size: 15 KB)
| This is a file from the Wikimedia Commons. Information from its description page there is shown below. Commons is a freely licensed media file repository. You can help. |
This file is translated using SVG <switch> elements. All translations are stored in the same file! Learn more.
For most Wikipedia projects, you can embed the file normally (without a To translate the text into your language, you can use the SVG Translate tool. Alternatively, you can download the file to your computer, add your translations using whatever software you're familiar with, and re-upload it with the same name. You will find help in Graphics Lab if you're not sure how to do this. |

|
This file may be updated to reflect new information. If you wish to use a specific version of the file without new updates being mirrored, please upload the required version as a separate file. |
Summary
| Description |
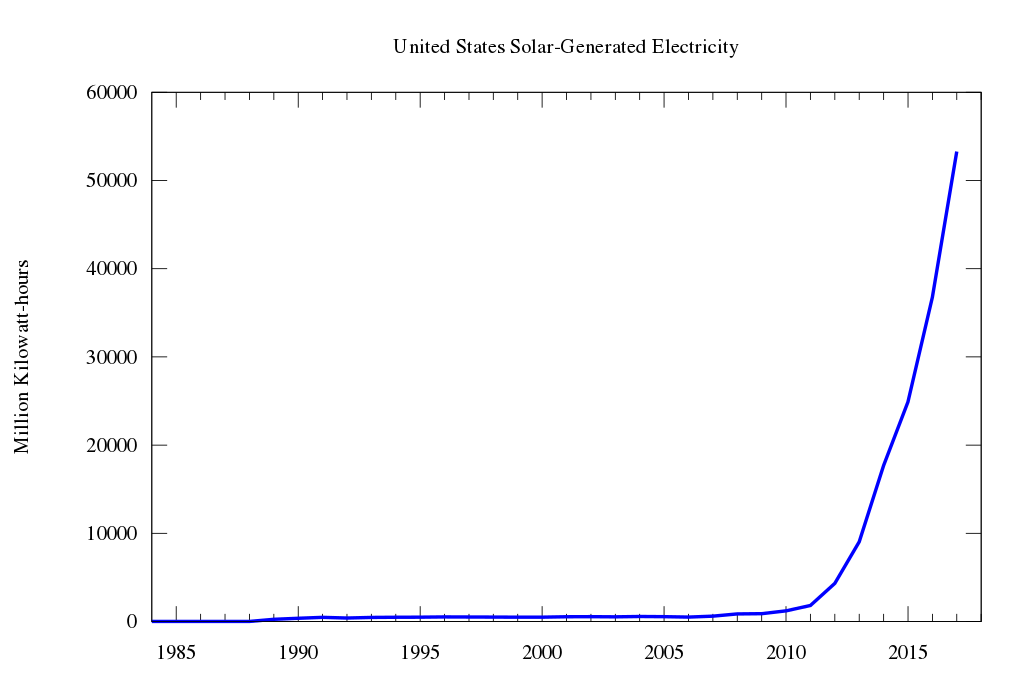
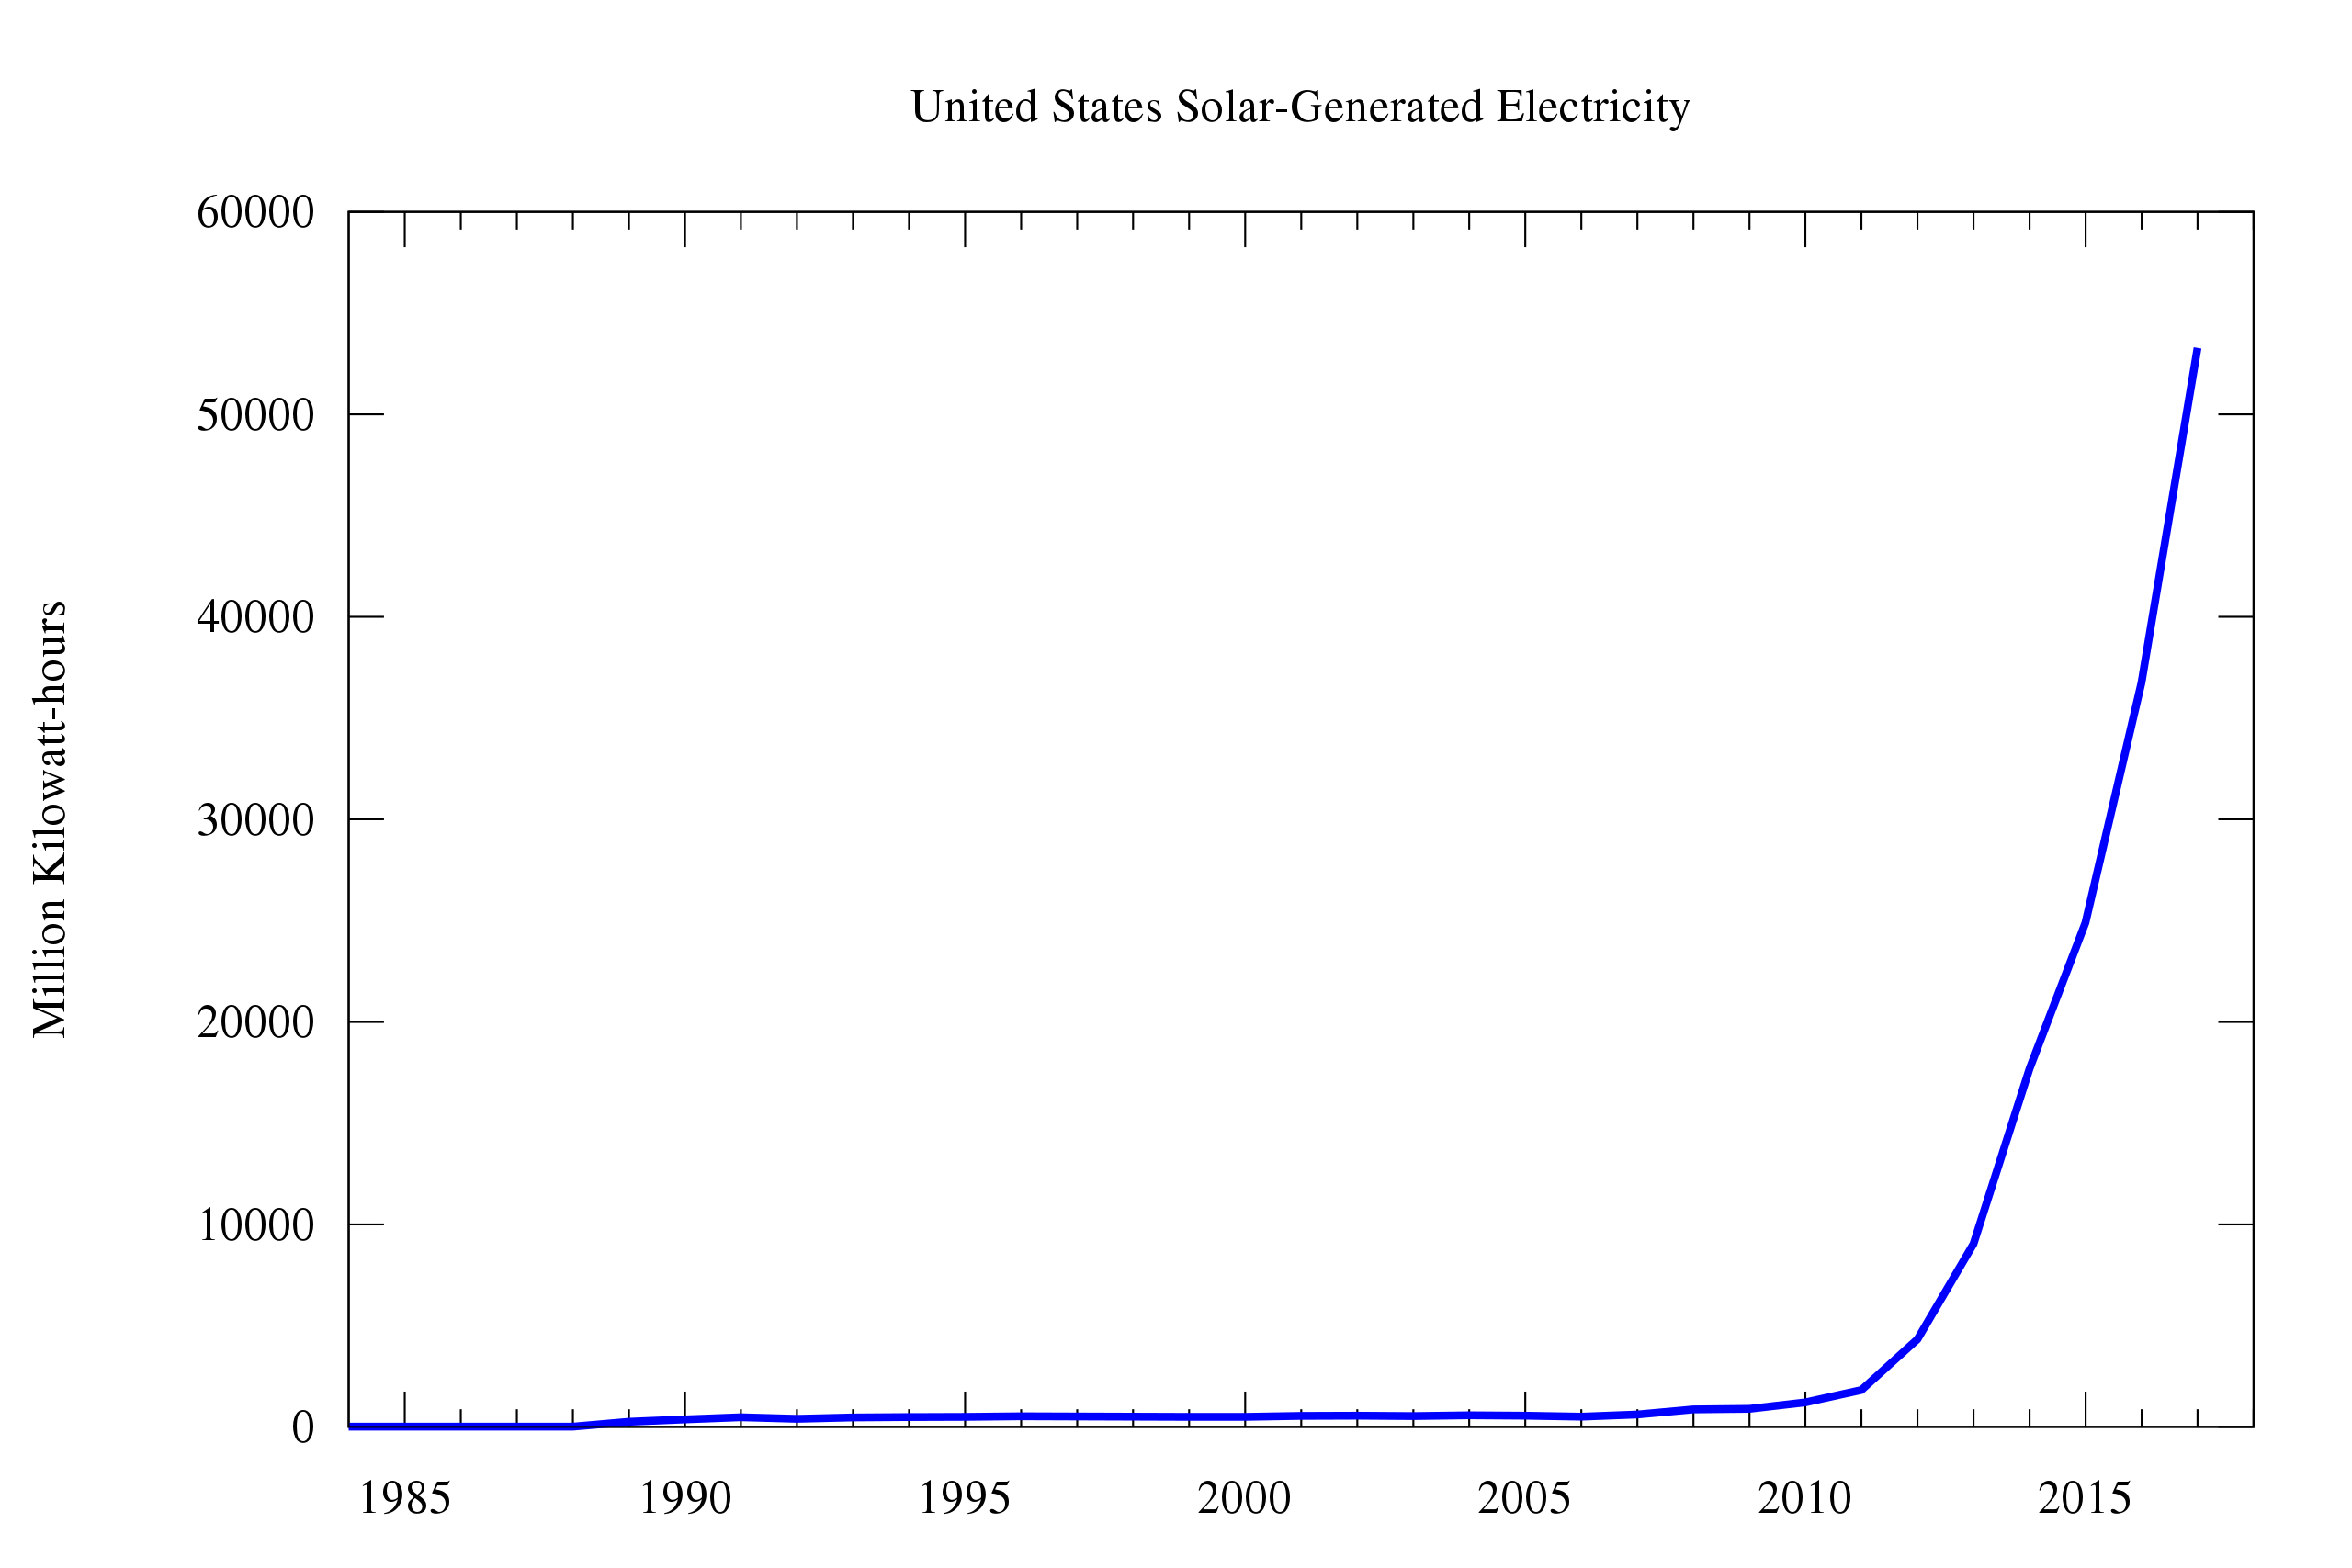
English: US solar electricity production since 1984. |
| Date | |
| Source | Data from US Energy Information Administration's Monthly Energy Review, table 7.2a. |
| Author | grendel|khan |
| Other versions | File:US_Solar_Electricity_Production.png |
Licensing
- You are free:
- to share – to copy, distribute and transmit the work
- to remix – to adapt the work
- Under the following conditions:
- attribution – You must give appropriate credit, provide a link to the license, and indicate if changes were made. You may do so in any reasonable manner, but not in any way that suggests the licensor endorses you or your use.
- share alike – If you remix, transform, or build upon the material, you must distribute your contributions under the same or compatible license as the original.
Source code
#!/usr/bin/gnuplot

set terminal svg enhanced size 1200 800 font "Times,24"
set output "US Solar Electricity Production.svg"

set xdata time
set timefmt "%Y"
set format x "%Y"
set xrange ["1984":"2018"]
set xtics "1985", 157788000  # Five years

unset key
set title "United States Solar Electricity Generation"
set ylabel "Million Kilowatt-hours"

plot "-" using 1:($2/1000) with lines linewidth 4 linecolor rgb "blue"

# Data:
#   Source: http://www.eia.gov/totalenergy/data/monthly/pdf/sec7_5.pdf
#   (Excel source: http://www.eia.gov/totalenergy/data/browser/xls.cfm?tbl=T07.02A&freq=m)
#   US Energy Information Administration's Monthly Energy Review, Table 7.2a,
#   "Electricity Net Generation:  Total (All Sectors)"
#   Last update: Release Date: November 20, 2018
1984 5248
1985 10630
1986 14032
1987 10497
1988 9094
1989 250601
1990 367087
1991 471765
1992 399640
1993 462452
1994 486622
1995 496821
1996 521205
1997 511168
1998 502473
1999 495082
2000 493375
2001 542755
2002 554831
2003 534001
2004 575155
2005 550294
2006 507706
2007 611793
2008 864315
2009 891179
2010 1212182
2011 1817696
2012 4326675
2013 9035620
2014 17691031
2015 24892904
2016 36754200
2017 53286174
File history
Click on a date/time to view the file as it appeared at that time.
| Date/Time | Thumbnail | Dimensions | User | Comment | |
|---|---|---|---|---|---|
| current | 19:10, 4 December 2018 | | 1,200 × 800 (15 KB) | Grendelkhan | include 2017 data; remove "/month" from legend (it's per year). |
| 05:23, 6 July 2017 |  | 1,200 × 800 (13 KB) | Grendelkhan | update with 2016 data | |
| 16:40, 29 December 2016 |  | 1,200 × 800 (12 KB) | Grendelkhan | Include 2015 data. | |
| 18:09, 13 April 2015 |  | 1,200 × 800 (13 KB) | Grendelkhan | Add 1984 and 2014 data. Add translations using <switch>. (Generated with gnuplot, then manually edited to add translations.) | |
| 18:30, 8 April 2014 |  | 1,200 × 800 (9 KB) | Grendelkhan | Include 2013 data. | |
| 18:11, 10 September 2013 |  | 1,200 × 800 (9 KB) | Grendelkhan | Include 2012 data. | |
| 16:56, 19 June 2013 |  | 1,200 × 800 (9 KB) | Grendelkhan | {{Information |Description ={{en|1=US solar electricity production since 1985.}} |Source =Data from US Energy Information Administration's ''[http://www.eia.gov/aer Annual Energy Review]'', table 8.2a. |Author =[[User:Grendelkhan|... |