Original file (856 × 625 pixels, file size: 59 KB, MIME type: image/png)
| This is a file from the Wikimedia Commons. Information from its description page there is shown below. Commons is a freely licensed media file repository. You can help. |
Summary
| Description |
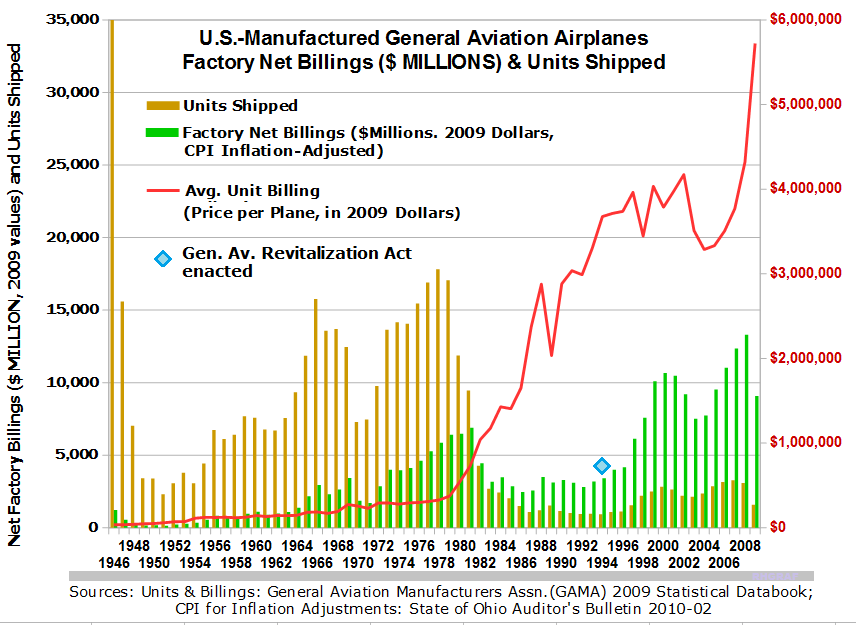
English: U.S.-Manufactured General Aviation Airplanes, by Units and Factory Net Billlings by Years, from 1946 to 2009 (U.S. Dollars adjusted for inflation by the Consumer Price Index to 2009 Dollars)
Units Shipped (individual whole airplanes) and Whole-Dollar Net Factory Billings (U.S. dollars in total sales) as reported by the General Aviation Manufacturers Association (GAMA), 2009 Statistical Databook, as posted by the Bureau of Transportation Statistics, U.S. Dept. of Transportation, at http://ntl.bts.gov/lib/35000/35200/35288/GA_Statistical_Databook_and_Industry_Outlook_0.pdf ) The Consumer Price Index (CPI) used as posted by the Auditor of the State of Ohio, Bulletin 2010-02 April 16, 2010 online at: https://ohioauditor.gov/publications/bulletins/2010/2010-002.pdf ) Factory Net Billings as depicted are Inflation-Adjusted to 2009 dollars, calculated by the graph-author using both sources. Blue diamond indicates the 1994 date of passage and signing into law of the General Aviation Revitalization Act (GARA). NOTE: Most substantial peaks and valleys in the data correspond to boom-and-bust cycles in the industry, some tied to the general economy (including major recessions). The 35,000 units shipped in 1946 is NOT an error, reflecting abnormally high production, driven by forces in the industry, at that time, related to prior war and grossly mistaken industry estimates of post-war aircraft demand. Zero-based bar graph; no distortions. For Wikipedia article: w:General Aviation Revitalization Act |
| Date | |
| Source |
Using graphing function of spreadsheet program, edited for appearance and GARA dot with paint program. |
| Author | Zxtxtxz |
Licensing

|
Permission is granted to copy, distribute and/or modify this document under the terms of the GNU Free Documentation License, Version 1.2 or any later version published by the Free Software Foundation; with no Invariant Sections, no Front-Cover Texts, and no Back-Cover Texts. A copy of the license is included in the section entitled GNU Free Documentation License. |
- You are free:
- to share – to copy, distribute and transmit the work
- to remix – to adapt the work
- Under the following conditions:
- attribution – You must give appropriate credit, provide a link to the license, and indicate if changes were made. You may do so in any reasonable manner, but not in any way that suggests the licensor endorses you or your use.
- share alike – If you remix, transform, or build upon the material, you must distribute your contributions under the same or compatible license as the original.
File history
Click on a date/time to view the file as it appeared at that time.
| Date/Time | Thumbnail | Dimensions | User | Comment | |
|---|---|---|---|---|---|
| current | 10:25, 12 February 2015 | | 856 × 625 (59 KB) | Zxtxtxz | Uploading a self-made file using File Upload Wizard |