Size of this preview: 800 × 409 pixels. Other resolutions: 320 × 163 pixels | 640 × 327 pixels | 1,314 × 671 pixels.
Original file (1,314 × 671 pixels, file size: 68 KB, MIME type: image/png)
Summary edit
| Description |
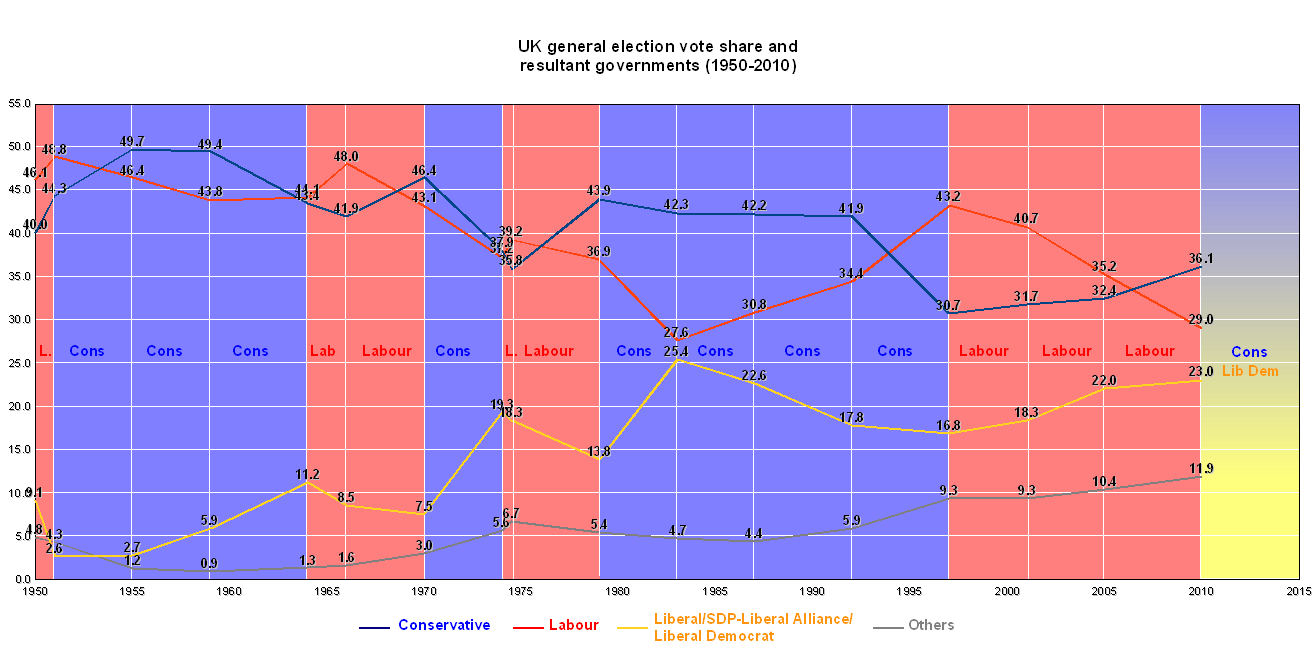
Graph showing UK general election results from 1950 to 2010 and the resultant governments following those elections. |
|---|---|
| Source |
I (Woodgreener (talk)) created this work entirely by myself. |
| Date |
18:12, 24 June 2010 (UTC) |
| Author | |
| Permission (Reusing this file) |
See below.
|
Licensing edit
I, the copyright holder of this work, hereby publish it under the following license:
| This work is licensed under the Creative Commons Attribution-ShareAlike 3.0 License. |
 | This file is a candidate to be copied to Wikimedia Commons.
Any user may perform this transfer; refer to Wikipedia:Moving files to Commons for details. If this file has problems with attribution, copyright, or is otherwise ineligible for Commons, then remove this tag and DO NOT transfer it; repeat violators may be blocked from editing. Other Instructions
| ||
| |||
File history
Click on a date/time to view the file as it appeared at that time.
| Date/Time | Thumbnail | Dimensions | User | Comment | |
|---|---|---|---|---|---|
| current | 18:12, 24 June 2010 | | 1,314 × 671 (68 KB) | Woodgreener (talk | contribs) | {{Information |Description = Graph showing UK general election results from 1950 to 2010 and the resultant governments following those elections. |Source = I (~~~) created this work entirely by myself. |Date = ~~~~~ |Author |
You cannot overwrite this file.
File usage
The following pages on the English Wikipedia use this file (pages on other projects are not listed):