Size of this preview: 800 × 439 pixels. Other resolutions: 320 × 176 pixels | 640 × 351 pixels | 1,024 × 562 pixels | 1,280 × 703 pixels | 2,560 × 1,405 pixels | 3,825 × 2,100 pixels.
Original file (3,825 × 2,100 pixels, file size: 189 KB, MIME type: image/png)
| This is a file from the Wikimedia Commons. Information from its description page there is shown below. Commons is a freely licensed media file repository. You can help. |
Summary
| Description |
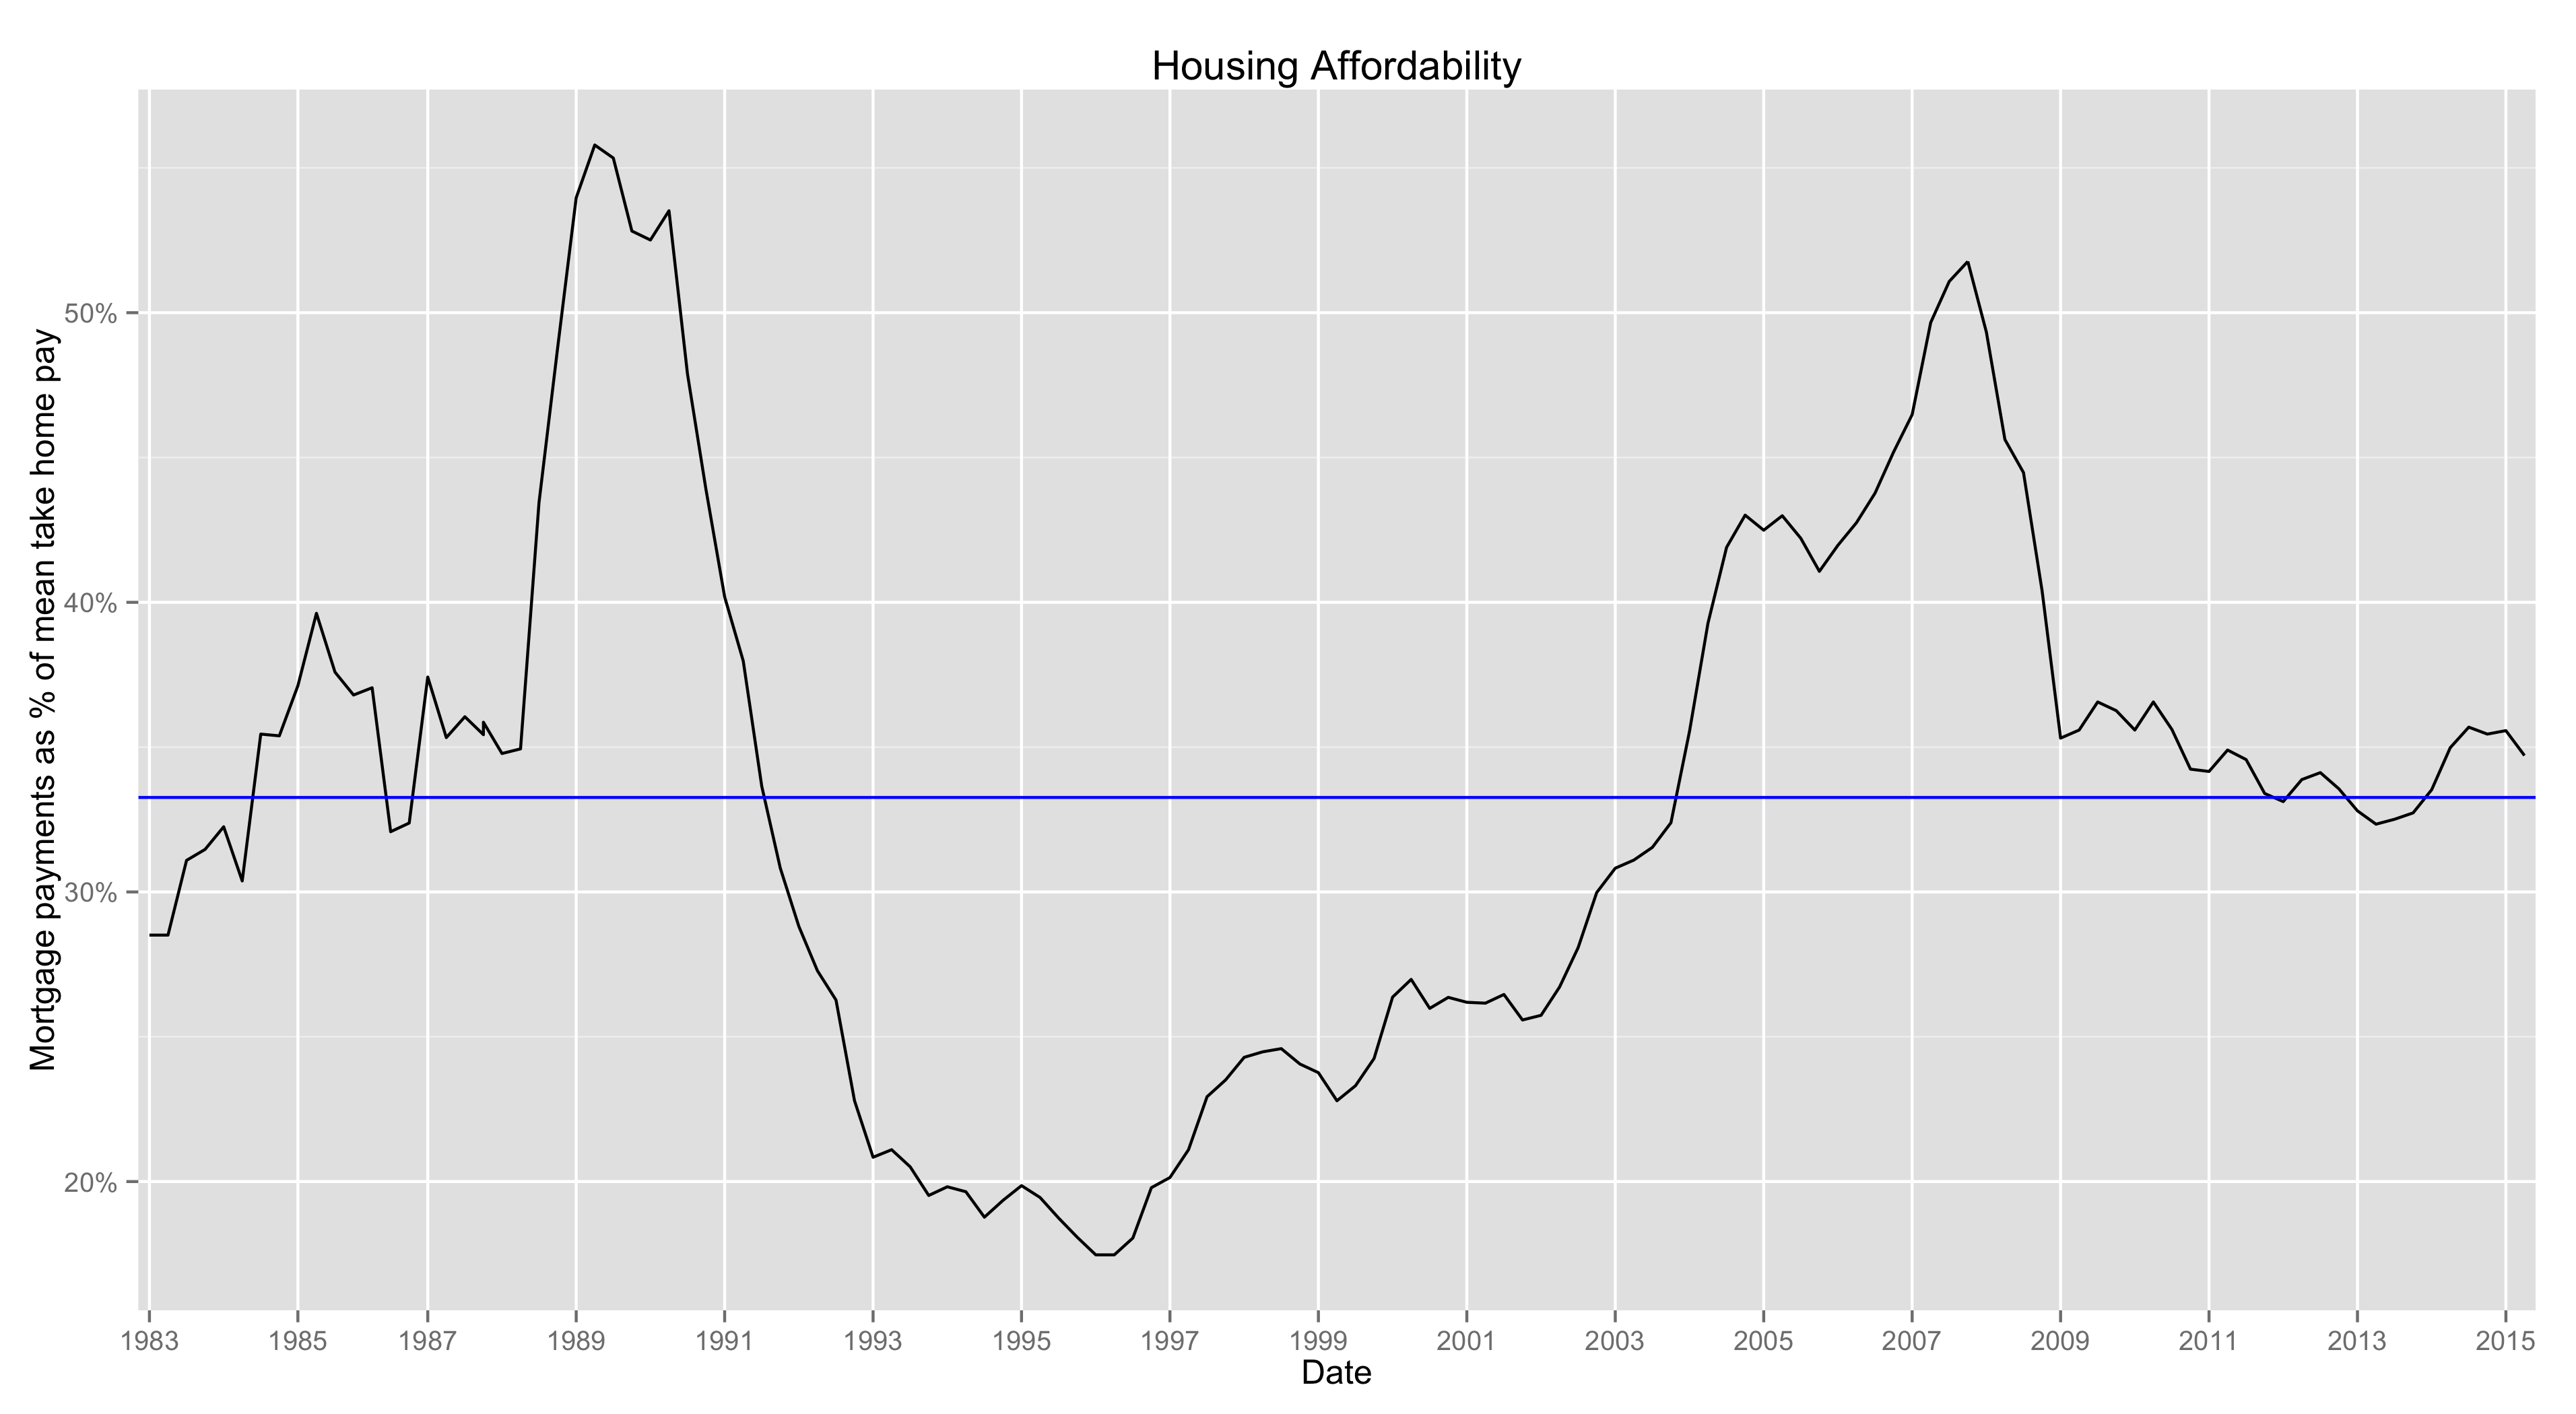
English: United Kingdom housing affordability as described by mortgage payments as a percentage of take home pay from 1983 to 2015 |
| Date | |
| Source | Own work |
| Author | D Wells |
Licensing
I, the copyright holder of this work, hereby publish it under the following license:
This file is licensed under the Creative Commons Attribution-Share Alike 4.0 International license.
- You are free:
- to share – to copy, distribute and transmit the work
- to remix – to adapt the work
- Under the following conditions:
- attribution – You must give appropriate credit, provide a link to the license, and indicate if changes were made. You may do so in any reasonable manner, but not in any way that suggests the licensor endorses you or your use.
- share alike – If you remix, transform, or build upon the material, you must distribute your contributions under the same or compatible license as the original.
Source code
library(ggplot2)
library(scales)

# Data from http://www.nationwide.co.uk/~/media/MainSite/documents/about/house-price-index/downloads/ftb-affordability-indices.xls
# linked from http://www.nationwide.co.uk/about/house-price-index/download-data#xtab:affordability-benchmarks
# nationwide <- read.csv("nationwide-affordability.csv", na.strings="")
# dput(nationwide)

nationwide <- structure(list(Date = structure(c(1L, 2L, 3L, 4L, 5L, 6L, 7L,
8L, 9L, 10L, 11L, 12L, 13L, 14L, 15L, 19L, 16L, 17L, 18L, 19L,
20L, 21L, 22L, 23L, 24L, 25L, 26L, 27L, 28L, 29L, 30L, 31L, 32L,
33L, 34L, 35L, 36L, 37L, 38L, 39L, 40L, 41L, 42L, 43L, 44L, 45L,
46L, 47L, 48L, 49L, 50L, 51L, 52L, 53L, 54L, 55L, 56L, 57L, 58L,
59L, 60L, 61L, 62L, 63L, 64L, 65L, 66L, 67L, 68L, 69L, 70L, 71L,
72L, 73L, 74L, 75L, 76L, 77L, 78L, 79L, 80L, 81L, 82L, 83L, 84L,
85L, 86L, 87L, 88L, 89L, 90L, 91L, 92L, 93L, 94L, 95L, 96L, 97L,
98L, 99L, 100L, 101L, 102L, 103L, 104L, 105L, 106L, 107L, 108L,
109L, 110L, 111L, 112L, 113L, 114L, 115L, 116L, 117L, 118L, 119L,
120L, 121L, 122L, 123L, 124L, 125L, 126L, 127L, 128L, 129L), .Label = c("1983 Q1",
"1983 Q2", "1983 Q3", "1983 Q4", "1984 Q1", "1984 Q2", "1984 Q3",
"1984 Q4", "1985 Q1", "1985 Q2", "1985 Q3", "1985 Q4", "1986 Q1",
"1986 Q2", "1986 Q3", "1987 Q1", "1987 Q2", "1987 Q3", "1987 Q4",
"1988 Q1", "1988 Q2", "1988 Q3", "1988 Q4", "1989 Q1", "1989 Q2",
"1989 Q3", "1989 Q4", "1990 Q1", "1990 Q2", "1990 Q3", "1990 Q4",
"1991 Q1", "1991 Q2", "1991 Q3", "1991 Q4", "1992 Q1", "1992 Q2",
"1992 Q3", "1992 Q4", "1993 Q1", "1993 Q2", "1993 Q3", "1993 Q4",
"1994 Q1", "1994 Q2", "1994 Q3", "1994 Q4", "1995 Q1", "1995 Q2",
"1995 Q3", "1995 Q4", "1996 Q1", "1996 Q2", "1996 Q3", "1996 Q4",
"1997 Q1", "1997 Q2", "1997 Q3", "1997 Q4", "1998 Q1", "1998 Q2",
"1998 Q3", "1998 Q4", "1999 Q1", "1999 Q2", "1999 Q3", "1999 Q4",
"2000 Q1", "2000 Q2", "2000 Q3", "2000 Q4", "2001 Q1", "2001 Q2",
"2001 Q3", "2001 Q4", "2002 Q1", "2002 Q2", "2002 Q3", "2002 Q4",
"2003 Q1", "2003 Q2", "2003 Q3", "2003 Q4", "2004 Q1", "2004 Q2",
"2004 Q3", "2004 Q4", "2005 Q1", "2005 Q2", "2005 Q3", "2005 Q4",
"2006 Q1", "2006 Q2", "2006 Q3", "2006 Q4", "2007 Q1", "2007 Q2",
"2007 Q3", "2007 Q4", "2008 Q1", "2008 Q2 ", "2008 Q3", "2008 Q4",
"2009 Q1", "2009 Q2", "2009 Q3", "2009 Q4", "2010 Q1", "2010 Q2",
"2010 Q3", "2010 Q4", "2011 Q1", "2011 Q2", "2011 Q3", "2011 Q4",
"2012 Q1", "2012 Q2", "2012 Q3", "2012 Q4", "2013 Q1", "2013 Q2",
"2013 Q3", "2013 Q4", "2014 Q1", "2014 Q2", "2014 Q3", "2014 Q4",
"2015 Q1", "2015 Q2"), class = "factor"), PaymentPercent = c(0.2851,
0.2851, 0.3109, 0.3147, 0.3225, 0.3038, 0.3545, 0.3539, 0.3712,
0.3962, 0.3759, 0.368, 0.3705, 0.3208, 0.3238, 0.3543, 0.3742,
0.3533, 0.3605, 0.3586, 0.3478, 0.3494, 0.4347, 0.4879, 0.5397,
0.5579, 0.5534, 0.5282, 0.5251, 0.5352, 0.4787, 0.4387, 0.4019,
0.3798, 0.3365, 0.3082, 0.2881, 0.2728, 0.2627, 0.2279, 0.2084,
0.211, 0.2051, 0.1952, 0.1982, 0.1965, 0.1877, 0.1935, 0.1986,
0.1945, 0.1874, 0.1808, 0.1747, 0.1747, 0.1805, 0.1979, 0.2014,
0.211, 0.2293, 0.2351, 0.2429, 0.2448, 0.2459, 0.2406, 0.2376,
0.2279, 0.2331, 0.2425, 0.2637, 0.2698, 0.2598, 0.2636, 0.2619,
0.2616, 0.2646, 0.2558, 0.2574, 0.2672, 0.2808, 0.2998, 0.3082,
0.311, 0.3154, 0.3239, 0.3554, 0.3929, 0.419, 0.4301, 0.4249,
0.4299, 0.4221, 0.4107, 0.4197, 0.4275, 0.4377, 0.4519, 0.4648,
0.4966, 0.5108, 0.5177, 0.4933, 0.4562, 0.4448, 0.4041, 0.3531,
0.3559, 0.3656, 0.3626, 0.3559, 0.3656, 0.3561, 0.3424, 0.3416,
0.349, 0.3457, 0.334, 0.3312, 0.3388, 0.3412, 0.3356, 0.328,
0.3234, 0.3251, 0.3273, 0.3353, 0.3498, 0.3569, 0.3545, 0.3557,
0.3471)), .Names = c("Date", "PaymentPercent"), class = "data.frame", row.names = c(NA,
-130L))

seq <- seq(1983, 2015, by=2)
seq <- data.frame(values=paste(seq,"Q1",sep = " "),labels=seq)

plot <- ggplot(nationwide, aes(x = Date, y = PaymentPercent,group=1)) + geom_line() + labs(x="Date", y="Mortgage payments as % of mean take home pay", title="Housing Affordability") + geom_hline(yintercept=mean(nationwide$PaymentPercent),color='blue') + scale_x_discrete(breaks=seq$values,labels=seq$labels) + scale_y_continuous(labels=percent)

ggsave(file="nationwide-affordability.png", width=12.75, height=7)
File history
Click on a date/time to view the file as it appeared at that time.
| Date/Time | Thumbnail | Dimensions | User | Comment | |
|---|---|---|---|---|---|
| current | 21:07, 26 September 2016 | | 3,825 × 2,100 (189 KB) | Cmdrjameson | Compressed with pngout. Reduced by 164kB (46% decrease). |
| 16:41, 7 December 2015 |  | 3,825 × 2,100 (354 KB) | D Wells | User created page with UploadWizard |
File usage
The following pages on the English Wikipedia use this file (pages on other projects are not listed):