Original file (843 × 647 pixels, file size: 32 KB, MIME type: image/png)
| This is a file from the Wikimedia Commons. Information from its description page there is shown below. Commons is a freely licensed media file repository. You can help. |
Summary
| Description |
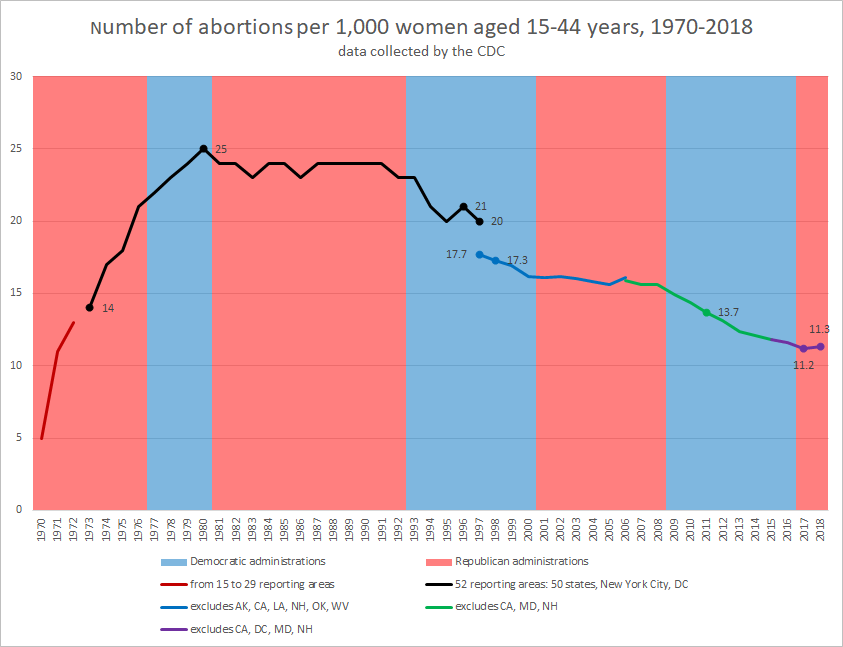
English: This graph shows data on U.S. abortion rates from 1970 to 2018. The data, collected by the CDC, is taken from the following documents:
Gamble, Sonya B.; Strauss, Lilo T.; Parker, Wilda Y.; Cook, Douglas A.; Zane, Suzanne B.; Hamdan, Saeed (November 28, 2008). "Abortion Surveillance -- United States, 2005". Morbidity and Mortality Weekly Report. 57 (SS-13): 16. Pazol, Karen; Gamble, Sonya B.; Parker, Wilda Y.; Cook, Douglas A.; Zane, Suzanne B.; Hamdan, Saeed (November 27, 2009). "Abortion Surveillance -- United States, 2006". Morbidity and Mortality Weekly Report. 58 (SS08): 13. Jatlaoui, Tara C.; Boutot, Maegan E.; Mandel, Michele G.; Whiteman, Maura K.; Ti, Angeline; Petersen, Emily; Pazol, Karen (November 23, 2018). "Abortion Surveillance -- United States, 2015". Morbidity and Mortality Weekly Report. 67 (13): 20. Kortsmit, Katherine; Jatlaoui, Tara C.; Mandel, Michele G.; Reeves, Jennifer A.; Oduyebo, Titilope; Petersen, Emily; Whiteman, Maura K. (November 27, 2020). "Abortion Surveillance -- United States, 2018". Morbidity and Mortality Weekly Report. 69 (7): 14. |
| Date | |
| Source | Own work |
| Author | Thiesen |
Licensing
| This file is made available under the Creative Commons CC0 1.0 Universal Public Domain Dedication. | |
| The person who associated a work with this deed has dedicated the work to the public domain by waiving all of their rights to the work worldwide under copyright law, including all related and neighboring rights, to the extent allowed by law. You can copy, modify, distribute and perform the work, even for commercial purposes, all without asking permission.
|
File history
Click on a date/time to view the file as it appeared at that time.
| Date/Time | Thumbnail | Dimensions | User | Comment | |
|---|---|---|---|---|---|
| current | 17:04, 5 January 2021 | | 843 × 647 (32 KB) | Thiesen | In the previous version of this graph, the green section of the graph (for all reporting areas except CA, MD, and NH) and the purple section at the far right (for all reporting areas except CA, DC, MD, and NH) overlapped in such a way that the purple part hid some of the green part. In the new version of the graph, the entire green part is visible. The underlying data is the same. This change indicates that the data from 2006 through 2015 includes DC. |
| 07:36, 13 December 2020 |  | 843 × 647 (32 KB) | Thiesen | Uploaded own work with UploadWizard |