No higher resolution available.
U.S._Healthcare_Costs_as_a_Percentage_of_GDP.png (500 × 375 pixels, file size: 21 KB, MIME type: image/png)
| This is a file from the Wikimedia Commons. Information from its description page there is shown below. Commons is a freely licensed media file repository. You can help. |
Understanding the chart
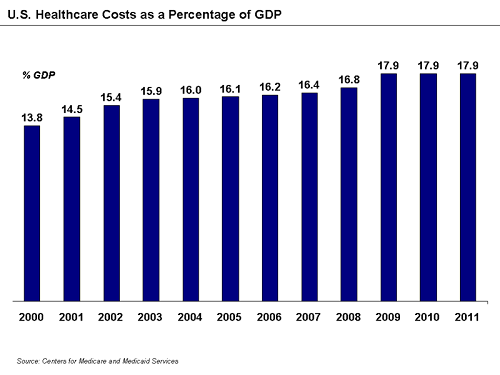
The bar chart shows U.S. healthcare costs as a percentage of gross domestic product or GDP.[1] Healthcare costs rose faster than GDP growth until 2009 and have since stabilized.[2][3] This ratio is considerably higher than that of other countries.
Summary
| Description |
English: U.S. Healthcare Costs as a Percentage of GDP |
| Date | |
| Source | Data from Centers for Medicare and Medicaid Services |
| Author | Farcaster |
| Other versions | Healthcare Compliance |
References
- ↑ Centers for Medicare and Medicaid Services-Statistics, Trends and Reports. Retrieved June 9, 2013
- ↑ Annie Lowrey (May 2013). "Slowdown in Rise of Healthcare Costs May Persist". w:The New York Times. Retrieved on June 10, 2013.
- ↑ Yuval Levin (May 2013). "Healthcare Costs and Budget". w:National Review Online. Retrieved on June 10, 2013.
Licensing
I, the copyright holder of this work, hereby publish it under the following licenses:

|
Permission is granted to copy, distribute and/or modify this document under the terms of the GNU Free Documentation License, Version 1.2 or any later version published by the Free Software Foundation; with no Invariant Sections, no Front-Cover Texts, and no Back-Cover Texts. A copy of the license is included in the section entitled GNU Free Documentation License. |
This file is licensed under the Creative Commons Attribution-Share Alike 3.0 Unported license.
- You are free:
- to share – to copy, distribute and transmit the work
- to remix – to adapt the work
- Under the following conditions:
- attribution – You must give appropriate credit, provide a link to the license, and indicate if changes were made. You may do so in any reasonable manner, but not in any way that suggests the licensor endorses you or your use.
- share alike – If you remix, transform, or build upon the material, you must distribute your contributions under the same or compatible license as the original.
You may select the license of your choice.
File history
Click on a date/time to view the file as it appeared at that time.
| Date/Time | Thumbnail | Dimensions | User | Comment | |
|---|---|---|---|---|---|
| current | 11:11, 8 September 2013 | | 500 × 375 (21 KB) | Sb101 | Resized -> Smaller |
| 05:17, 10 June 2013 |  | 960 × 720 (5 KB) | Farcaster | Uploading a self-made file using File Upload Wizard |
File usage
No pages on the English Wikipedia use this file (pages on other projects are not listed).