Size of this preview: 800 × 400 pixels. Other resolutions: 320 × 160 pixels | 640 × 320 pixels | 1,024 × 512 pixels | 1,280 × 640 pixels | 3,600 × 1,800 pixels.
Original file (3,600 × 1,800 pixels, file size: 572 KB, MIME type: image/png)
| This is a file from the Wikimedia Commons. Information from its description page there is shown below. Commons is a freely licensed media file repository. You can help. |
Summary
| Description |
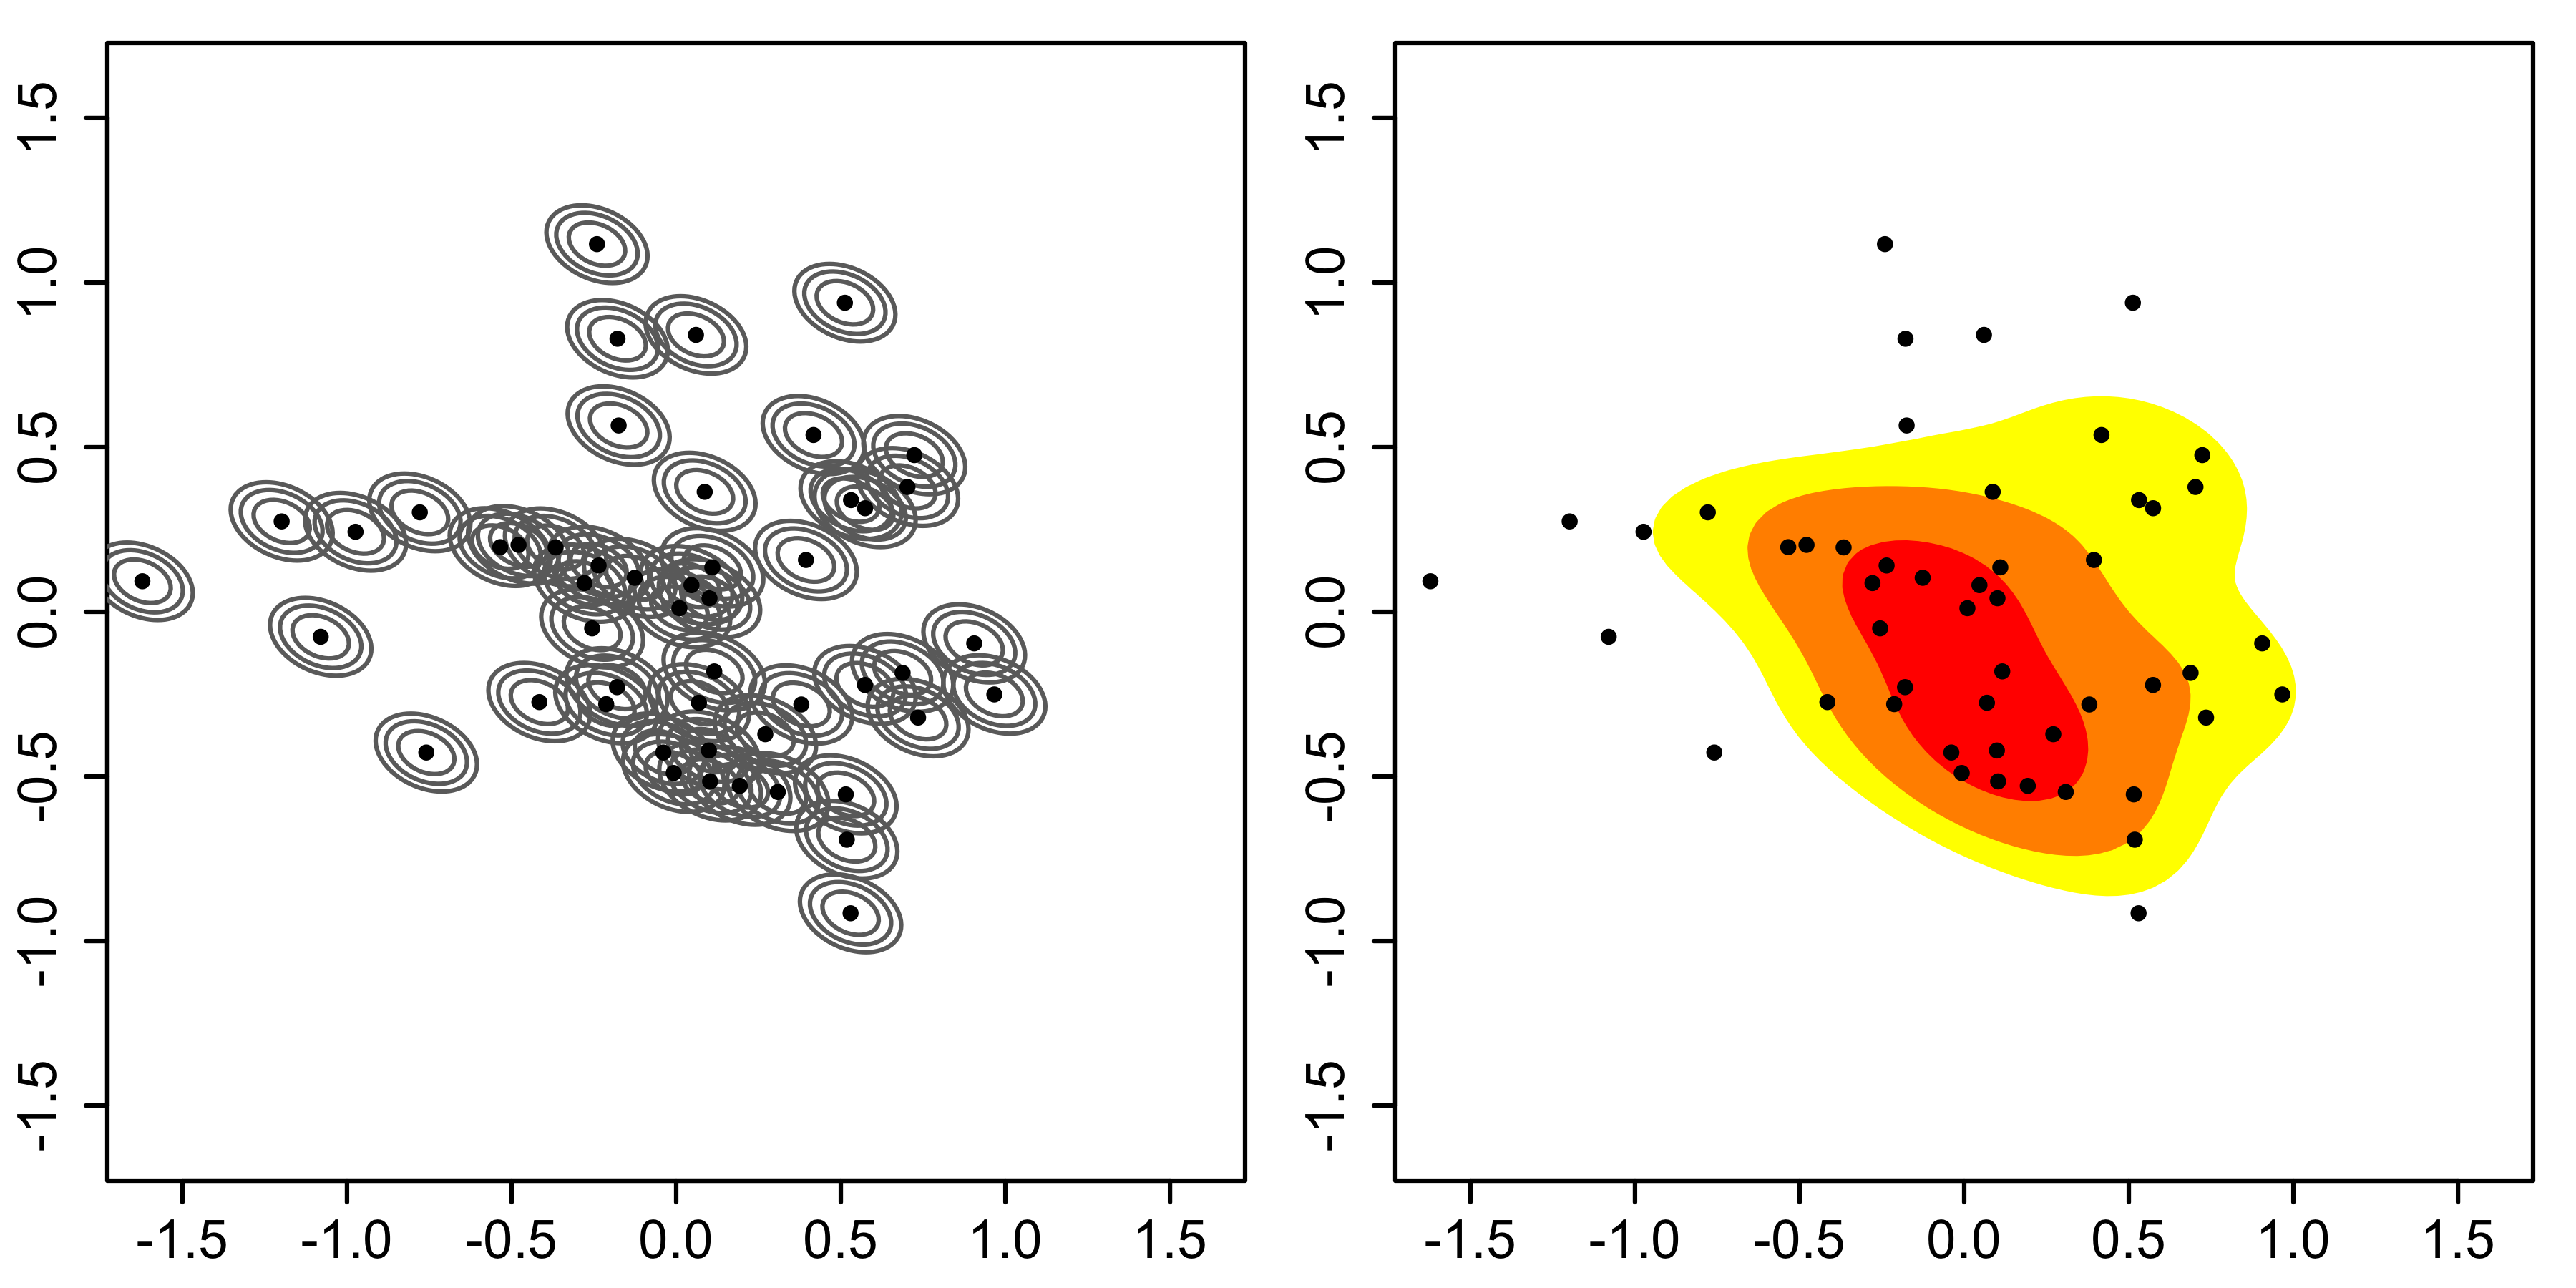
English: Illustration of the construction of 2D kernel density estimates. (Left) data points with individual kernels as grey dashed lines, (right) summed kernels = kernel density estimate.
Français : Illustration d'une estimation 2D de noyau de densité, avec nuage de points individuels à gauche et représentation colorée de densité de noyau à droite. Ce type de représentation est notamment utilisée pour l'estimation du Domaine vital d'une espèce |
| Date | |
| Source | Own work |
| Author | Drleft (talk) 00:04, 16 September 2010 (UTC) |
Licensing
I, the copyright holder of this work, hereby publish it under the following licenses:

|
Permission is granted to copy, distribute and/or modify this document under the terms of the GNU Free Documentation License, Version 1.2 or any later version published by the Free Software Foundation; with no Invariant Sections, no Front-Cover Texts, and no Back-Cover Texts. A copy of the license is included in the section entitled GNU Free Documentation License. |
This file is licensed under the Creative Commons Attribution-Share Alike Attribution-Share Alike 4.0 International, 3.0 Unported, 2.5 Generic, 2.0 Generic and 1.0 Generic license.
- You are free:
- to share – to copy, distribute and transmit the work
- to remix – to adapt the work
- Under the following conditions:
- attribution – You must give appropriate credit, provide a link to the license, and indicate if changes were made. You may do so in any reasonable manner, but not in any way that suggests the licensor endorses you or your use.
- share alike – If you remix, transform, or build upon the material, you must distribute your contributions under the same or compatible license as the original.
You may select the license of your choice.
File history
Click on a date/time to view the file as it appeared at that time.
| Date/Time | Thumbnail | Dimensions | User | Comment | |
|---|---|---|---|---|---|
| current | 10:27, 20 September 2010 | | 3,600 × 1,800 (572 KB) | Drleft | Separated very clsoe points and used smaller dot size. |
| 01:02, 16 September 2010 |  | 3,600 × 1,800 (85 KB) | Drleft | Higher resolution. | |
| 00:04, 16 September 2010 |  | 960 × 480 (13 KB) | Drleft | {{Information |Description={{en|1=Illustration of the construction of 2D kernel density estimates. (Left) data points with individual kernels as grey dashed lines, (right) summed kernels = kernel density estimate. }} |Source=Own work |Author=~~~~ |Date= |
File usage
The following pages on the English Wikipedia use this file (pages on other projects are not listed):
Global file usage
The following other wikis use this file:
- Usage on ca.wikipedia.org
- Usage on fr.wikipedia.org
- Usage on hi.wikipedia.org