Original file (1,440 × 770 pixels, file size: 502 KB, MIME type: image/jpeg)
Summary edit
| Description |
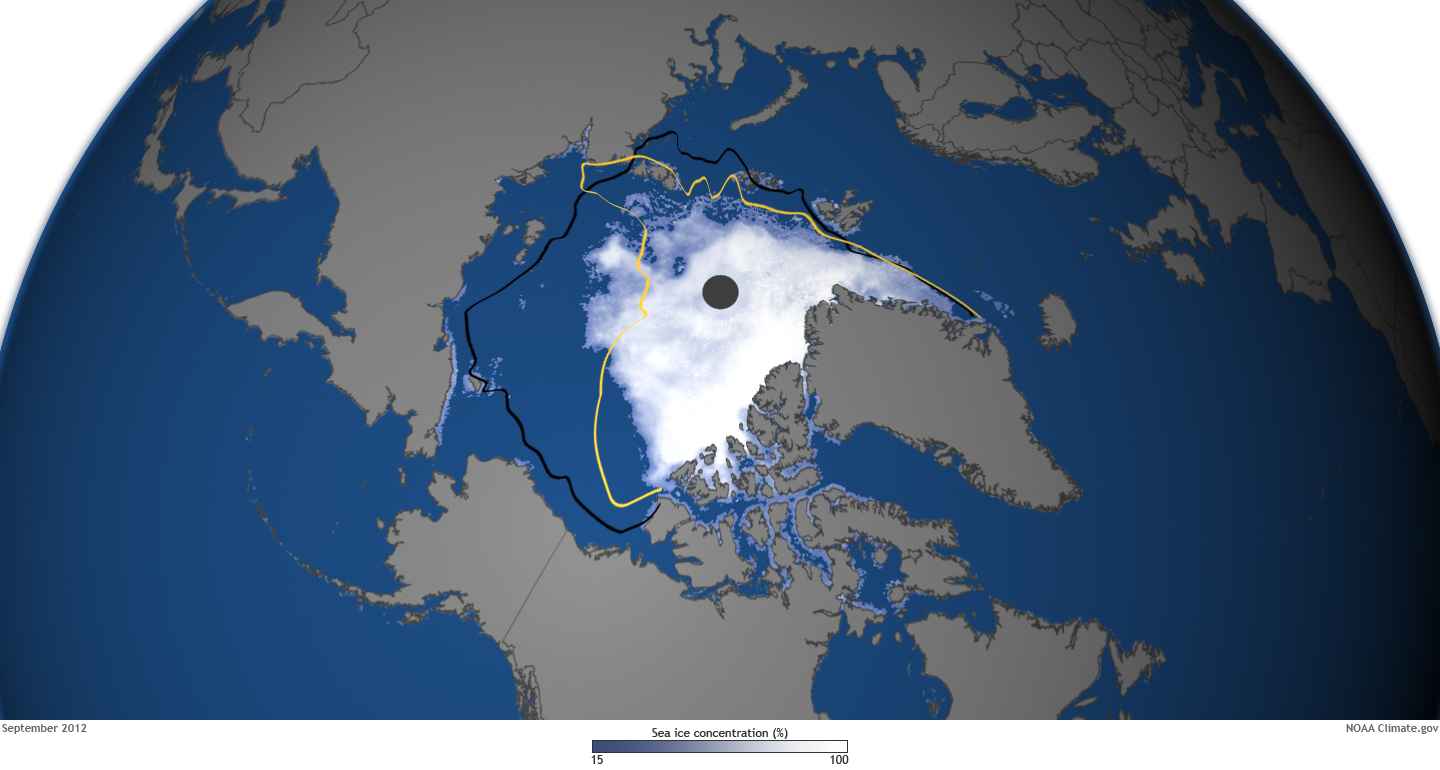
This map shows ice concentration on September 16, along with the extent of the previous record low (yellow line) and the mid-September median extent (black line). in mid-September, the ice extent had shrunk down to just 1.3 million square miles (3.41 square kilometers), setting a new record low that was 18 percent smaller than the previous record and nearly 50 percent smaller than the long-term (1979-2000) average. |
|---|---|
| Source |
http://www.climatewatch.noaa.gov/wp-content/uploads/2012/12/SeaIce-Sept162012_HR.jpg |
| Date |
2012 |
| Author |
Dan Pisut |
| Permission (Reusing this file) |
See below.
|
Licensing edit
| This image is a work of the National Oceanic and Atmospheric Administration, taken or made as part of that person's official duties. As works of the U.S. federal government, all NOAA images are in the public domain in the United States. |
 | This file is a candidate to be copied to Wikimedia Commons.
Any user may perform this transfer; refer to Wikipedia:Moving files to Commons for details. If this file has problems with attribution, copyright, or is otherwise ineligible for Commons, then remove this tag and DO NOT transfer it; repeat violators may be blocked from editing. Other Instructions
| ||
| |||
| This media file is either in the public domain or published under a free license, and contains no inbound file links. If this media file is useful, then it should be transferred to the Wikimedia Commons. If this media is not useful, then please propose it for deletion or list it at files for discussion. |
File history
Click on a date/time to view the file as it appeared at that time.
| Date/Time | Thumbnail | Dimensions | User | Comment | |
|---|---|---|---|---|---|
| current | 02:21, 1 May 2013 | | 1,440 × 770 (502 KB) | David.moreno72 (talk | contribs) | Uploading a public-domain item using File Upload Wizard |
You cannot overwrite this file.