.png)
.png&action=edit&redlink=1)

Original file (3,071 × 1,790 pixels, file size: 927 KB, MIME type: image/png)
| This is a file from the Wikimedia Commons. Information from its description page there is shown below. Commons is a freely licensed media file repository. You can help. |
.png)
Summary
| Description |
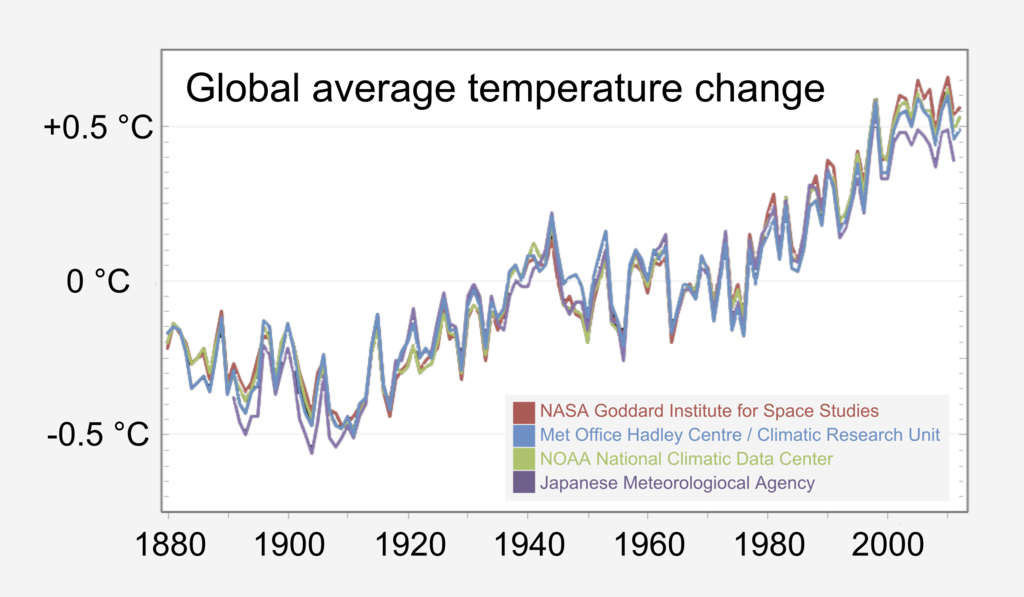
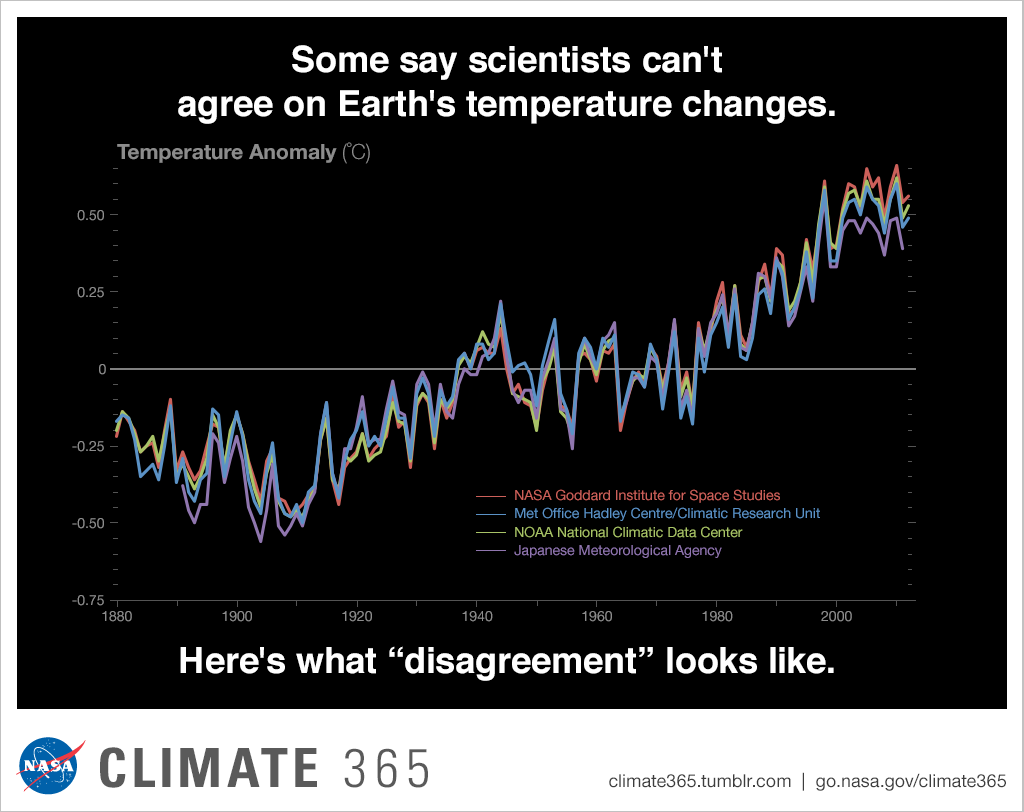
English: Temperature data (in degrees Celsius) from four international science institutions. All show rapid warming in the past few decades and that the last decade has been the warmest on record. Data sources: NASA's Goddard Institute for Space Studies, NOAA National Climatic Data Center, Met Office Hadley Centre/Climatic Research Unit and the Japanese Meteorological Agency. (Graph produced by Earth Science Communications Team at NASA's Jet Propulsion Laboratory | California Institute of Technology) |
| Date | |
| Source |
For Version 2 (created 2020-03-22; is slightly updated, more pixels so less pixellation and clearer text when enlarged))
|
| Author | Earth Science Communications Team, Jet Propulsion Laboratory/California Institute of Technology, National Aeronautics and Space Administration (NASA), 4800 Oak Grove Drive, Pasadena, CA 91109 |
| Other versions |
The following SVG image goes directly to the datasets of multiple sources that have been updated. The NASA web page sourcing the above PNG image had not been updated for at least five years. —RCraig09 (talk) 03:56, 25 March 2020 (UTC)  |
From NASA’s Global Climate Change website - https://climate.nasa.gov/
Temperature anomaly - "In climate change studies, temperature anomalies are more important than absolute temperature. A temperature anomaly is the difference from an average, or baseline, temperature. The baseline temperature is typically computed by averaging 30 or more years of temperature data."
Licensing
| This file is in the public domain in the United States because it was solely created by NASA. NASA copyright policy states that "NASA material is not protected by copyright unless noted". (See Template:PD-USGov, NASA copyright policy page or JPL Image Use Policy.) | ||
 |
Warnings:
|
File history
Click on a date/time to view the file as it appeared at that time.
| Date/Time | Thumbnail | Dimensions | User | Comment | |
|---|---|---|---|---|---|
| current | 03:56, 23 March 2020 | | 3,071 × 1,790 (927 KB) | RCraig09 | Version 2.1 -- Minor: adjust placement of temperature legends on left. |
| 01:01, 23 March 2020 |  | 3,071 × 1,790 (927 KB) | RCraig09 | Updated version ... Source image taken from NASA website on 2020-03-22. . . . Removed duplicative commentary. | |
| 22:01, 18 August 2018 |  | 735 × 529 (173 KB) | Markworthen | User created page with UploadWizard |
File usage
Global file usage
The following other wikis use this file:
- Usage on ar.wikipedia.org
- Usage on ca.wikipedia.org
- Usage on cs.wikipedia.org
- Usage on ga.wikipedia.org
.png)