No higher resolution available.
Sample-phase-diag.png (410 × 380 pixels, file size: 14 KB, MIME type: image/png)
Summary
edit
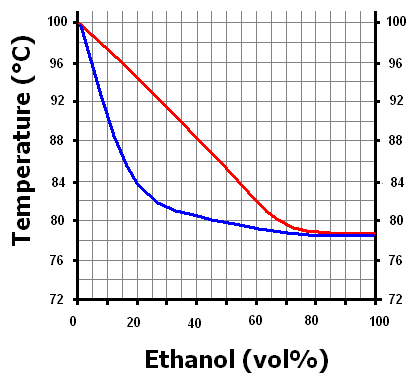
A phase diagram (NOTE: VERY INACCURATE DATA) representing the boiling point of a mixture of ethanol and water, and the composition of the vapour phase. Posted for clarifying a question on the science reference desk.
Licensing
edit
| I, the copyright holder of this work, hereby release it into the public domain. This applies worldwide. If this is not legally possible: |
 | This file is a candidate to be copied to Wikimedia Commons.
Any user may perform this transfer; refer to Wikipedia:Moving files to Commons for details. If this file has problems with attribution, copyright, or is otherwise ineligible for Commons, then remove this tag and DO NOT transfer it; repeat violators may be blocked from editing. Other Instructions
| ||
| |||
File history
Click on a date/time to view the file as it appeared at that time.
| Date/Time | Thumbnail | Dimensions | User | Comment | |
|---|---|---|---|---|---|
| current | 09:34, 30 May 2007 | | 410 × 380 (14 KB) | 65obiv (talk | contribs) | A phase diagram (NOTE: VERY INACCURATE DATA) representing the boiling point of a mixture of ethanol and water, and the composition of the vapour phase. Posted for clarifying a question on the science reference desk. |
You cannot overwrite this file.
File usage
The following pages on the English Wikipedia use this file (pages on other projects are not listed):