.png)
.png&action=edit&redlink=1)
Size of this preview: 420 × 599 pixels. Other resolutions: 168 × 240 pixels | 336 × 480 pixels | 538 × 768 pixels | 718 × 1,024 pixels | 1,435 × 2,048 pixels | 3,515 × 5,015 pixels.
Original file (3,515 × 5,015 pixels, file size: 3.42 MB, MIME type: image/png)
| This is a file from the Wikimedia Commons. Information from its description page there is shown below. Commons is a freely licensed media file repository. You can help. |
.png)
Summary
| Description |
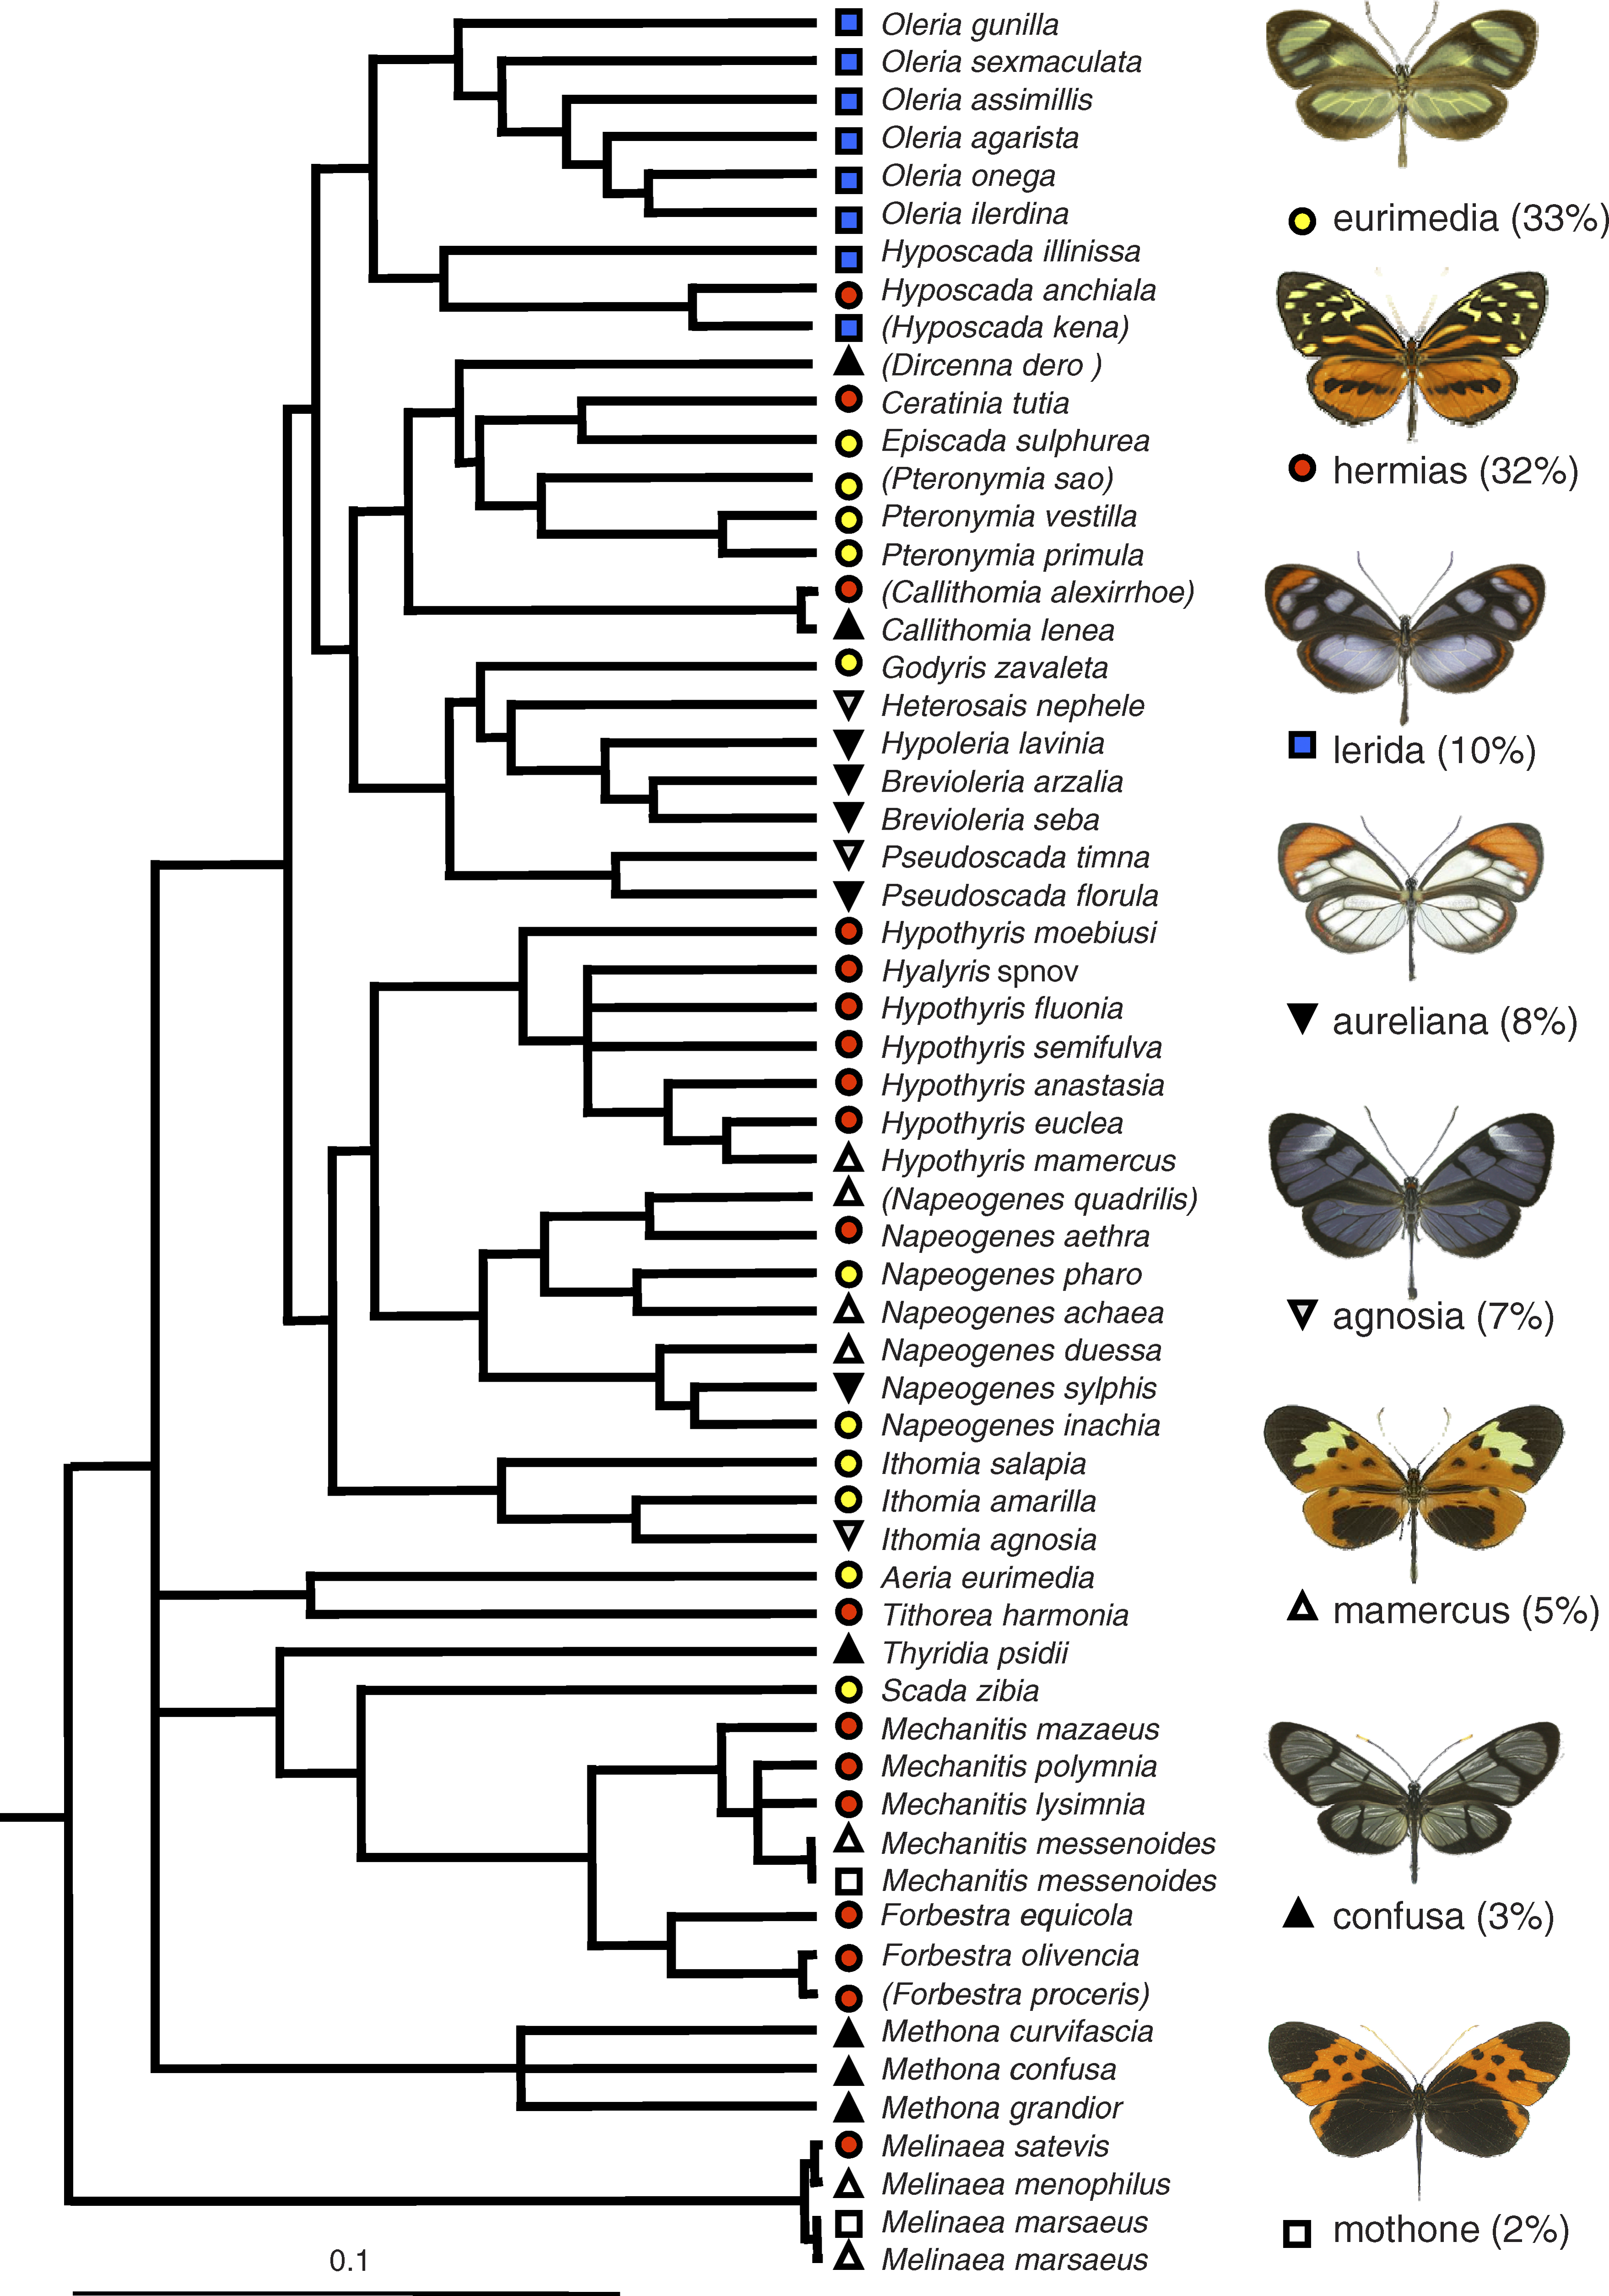
Phylogeny of the Ithomiine Species of the Community The relaxed-clock tree (maximum clade credibility tree resulting from a Bayesian phylogenetic analysis using a mitochondrial region and a nuclear gene) shows the 60 ithomiine taxa (58 species) of the community, after pruning 20 additional taxa not present in the community. All nodes have a posterior probability above 0.90. Brackets indicate rare species that were excluded from the analyses because not all microhabitat variables could be measured. The eight mimetic patterns are shown on the right with their names and relative abundance in the community, and indicated by colored symbols at the tips of the tree (see Table S1 for the list of taxa and corresponding mimetic patterns). There was a significant phylogenetic signal in the mimicry structure of the community (r = 0.162, n = 1,431, p < 0.0001), confirming that closely related species share color patterns more often than expected at random. |
| Date | |
| Source | pbio.0060300.g001 |
| Author | Phylogeny Figures |
Licensing
This file is licensed under the Creative Commons Attribution 2.0 Generic license.
- You are free:
- to share – to copy, distribute and transmit the work
- to remix – to adapt the work
- Under the following conditions:
- attribution – You must give appropriate credit, provide a link to the license, and indicate if changes were made. You may do so in any reasonable manner, but not in any way that suggests the licensor endorses you or your use.
| This image was originally posted to Flickr by phylofigures at https://flickr.com/photos/123636286@N02/14137973164. It was reviewed on 19 December 2020 by FlickreviewR 2 and was confirmed to be licensed under the terms of the cc-by-2.0. |
File history
Click on a date/time to view the file as it appeared at that time.
| Date/Time | Thumbnail | Dimensions | User | Comment | |
|---|---|---|---|---|---|
| current | 13:23, 19 December 2020 | | 3,515 × 5,015 (3.42 MB) | Eyes Roger | Transferred from Flickr via #flickr2commons |
File usage
The following pages on the English Wikipedia use this file (pages on other projects are not listed):
.png)