Size of this PNG preview of this SVG file: 420 × 440 pixels. Other resolutions: 229 × 240 pixels | 458 × 480 pixels | 733 × 768 pixels | 977 × 1,024 pixels | 1,955 × 2,048 pixels.
Original file (SVG file, nominally 420 × 440 pixels, file size: 7 KB)
File history
Click on a date/time to view the file as it appeared at that time.
| Date/Time | Thumbnail | Dimensions | User | Comment | |
|---|---|---|---|---|---|
| current | 12:32, 9 December 2009 |  | 420 × 440 (7 KB) | McSush | more compatibility with some viewers. (shadow) |
| 10:07, 9 December 2009 |  | 420 × 440 (6 KB) | McSush | just a test for my experimental chart-maker. seems to be an improvement, isn't it? | |
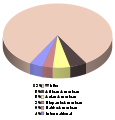
| 14:49, 3 August 2009 |  | 550 × 400 (4 KB) | Uncia | {{Information |Description={{en|1=Pie chart showing enrollment by ethnicity at Pennsylvania State University (all campuses) as of Fall 2006, rounded to nearest percent. Data source: [http://www.budget.psu.edu/FactBook/StudentDynamic/MinorityEnrolbyEthnici |
File usage
The following 2 pages use this file:

