Original file (1,920 × 1,920 pixels, file size: 512 KB, MIME type: image/jpeg)
| This is a file from the Wikimedia Commons. Information from its description page there is shown below. Commons is a freely licensed media file repository. You can help. |
Summary
| Description |
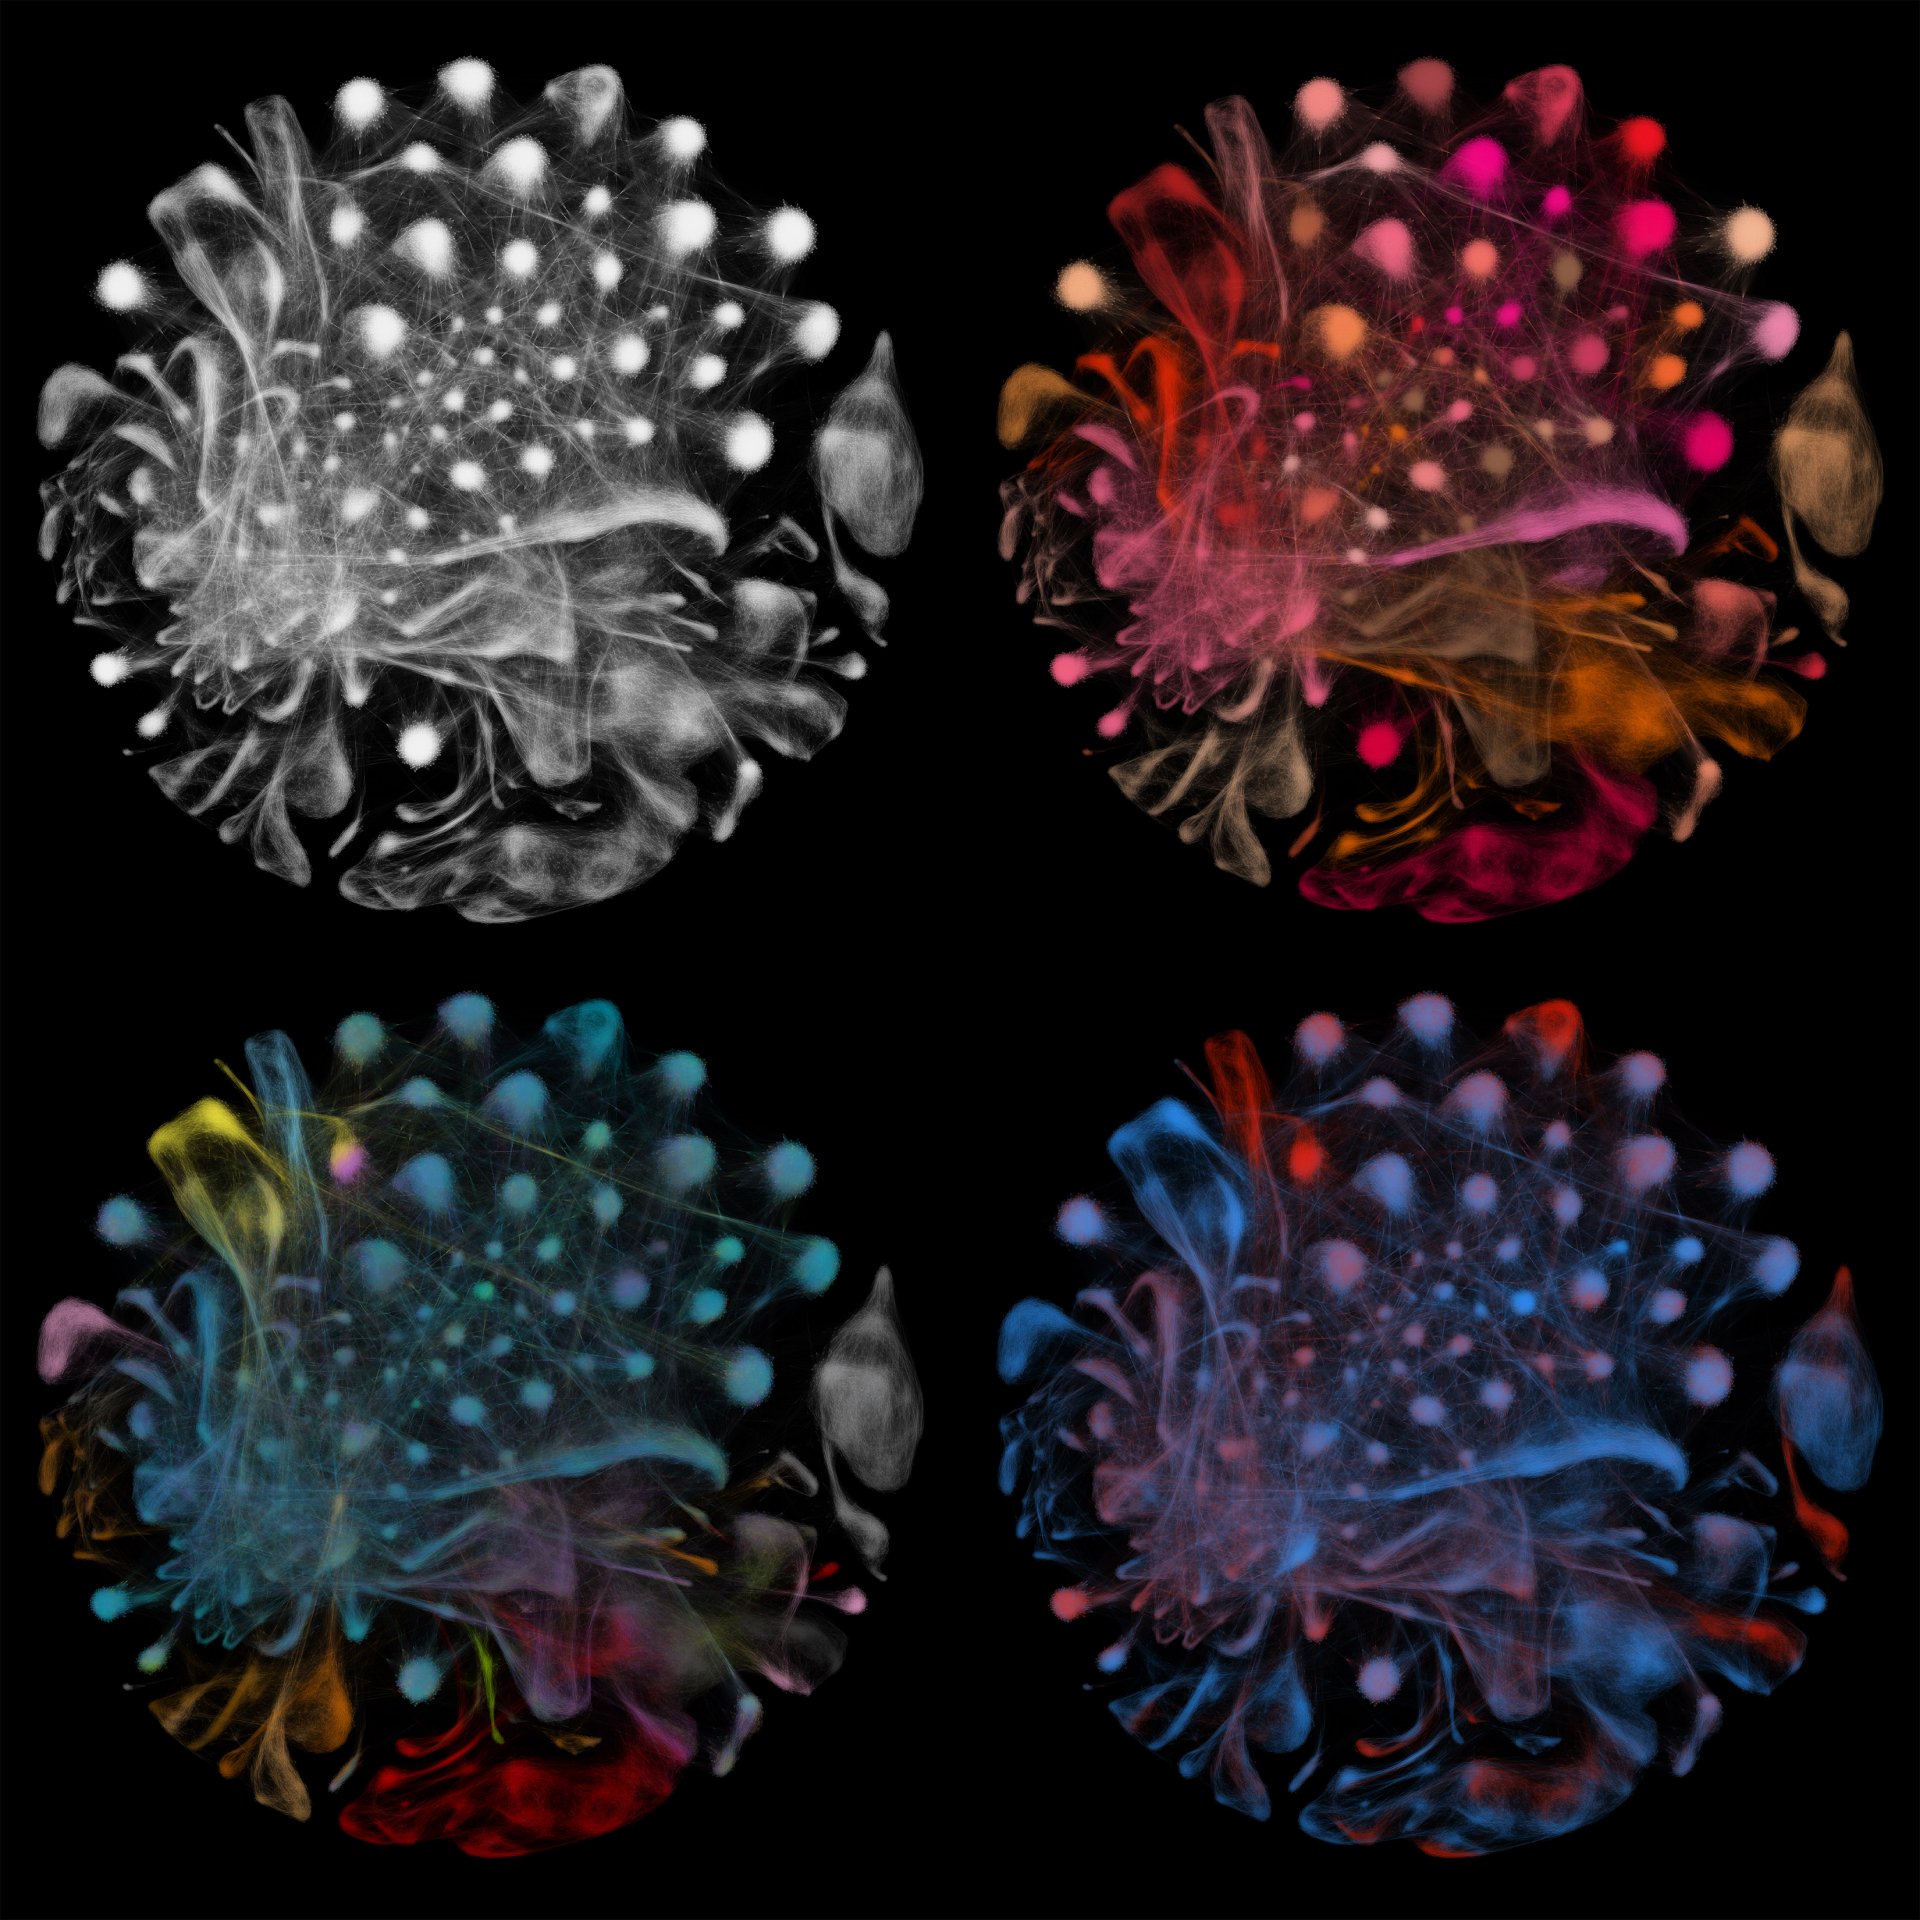
English: Visualising complex genomic data is hard.
In this image, each of the four coloured circles shows the same roughly 100,000 cells from rhesus macaques, with genetically and phenotypically similar cells clustered together. Every dot represents a single cell and the lines connecting them reflect how similar they are. In the top left circle, large continuous swoops are cells developing from stem cells. Tightly defined clusters are fully mature cells. In the top right circle, each shade of red reflects 1 of over 200 different types of cell, e.g. brain, gut, lung etc. In the bottom left circle, each colour highlights cells from a different tissue eg thymus and lymph nodes (shades of blue), bone marrow (red), blood (white), tonsil (yellow), gut (shades of brown), brain (grey), liver (green), spleen (purple) and lung (pink). Several clusters are multicoloured and often contain mobile cells from the immune system that travel between different parts of the body. In the bottom right circle, red cells are from monkeys infected with simian-human immunodeficiency virus while blue cells are from uninfected ones. Distinguishing the red and blue cells helps to show which cells change and malfunction during infection, despite treatment with antiretroviral drugs. The wider story HIV is still a major health issue today, as 36.9 million people live with it worldwide. To understand it better, scientists can look at similar infections in animals, testing potential vaccines and medications before giving them to people. |
| Source | https://wellcome.ac.uk/what-we-do/our-work/wellcome-photography-prize/2019#&gid=4&pid=2 |
| Author | Carly Ziegler, Alex Shalek, Shaina Carroll (MIT) and Leslie Kean, Victor Tkachev and Lucrezia Colonna (Dana-Farber Cancer Institute) / Wellcome Photography Prize 2019 |
| Permission (Reusing this file) |
This file is licensed under the Creative Commons Attribution 4.0 International license.
|
| Other versions |
.jpg)
.jpg)
File history
Click on a date/time to view the file as it appeared at that time.
| Date/Time | Thumbnail | Dimensions | User | Comment | |
|---|---|---|---|---|---|
| current | 18:58, 26 December 2019 | | 1,920 × 1,920 (512 KB) | Daniel Mietchen | Transferred from https://wellcome.ac.uk/sites/default/files/styles/gallery_large/public/wpp-2019-shortlist-carly-ziegler-leslie-kean-alex-shack-shaina-carroll-lucrezia-colonna-victor-tkachev.jpg |