Size of this preview: 800 × 573 pixels. Other resolutions: 320 × 229 pixels | 640 × 458 pixels | 1,024 × 733 pixels | 1,391 × 996 pixels.
Original file (1,391 × 996 pixels, file size: 323 KB, MIME type: image/png)
| This is a file from the Wikimedia Commons. Information from its description page there is shown below. Commons is a freely licensed media file repository. You can help. |
Summary
| Description |
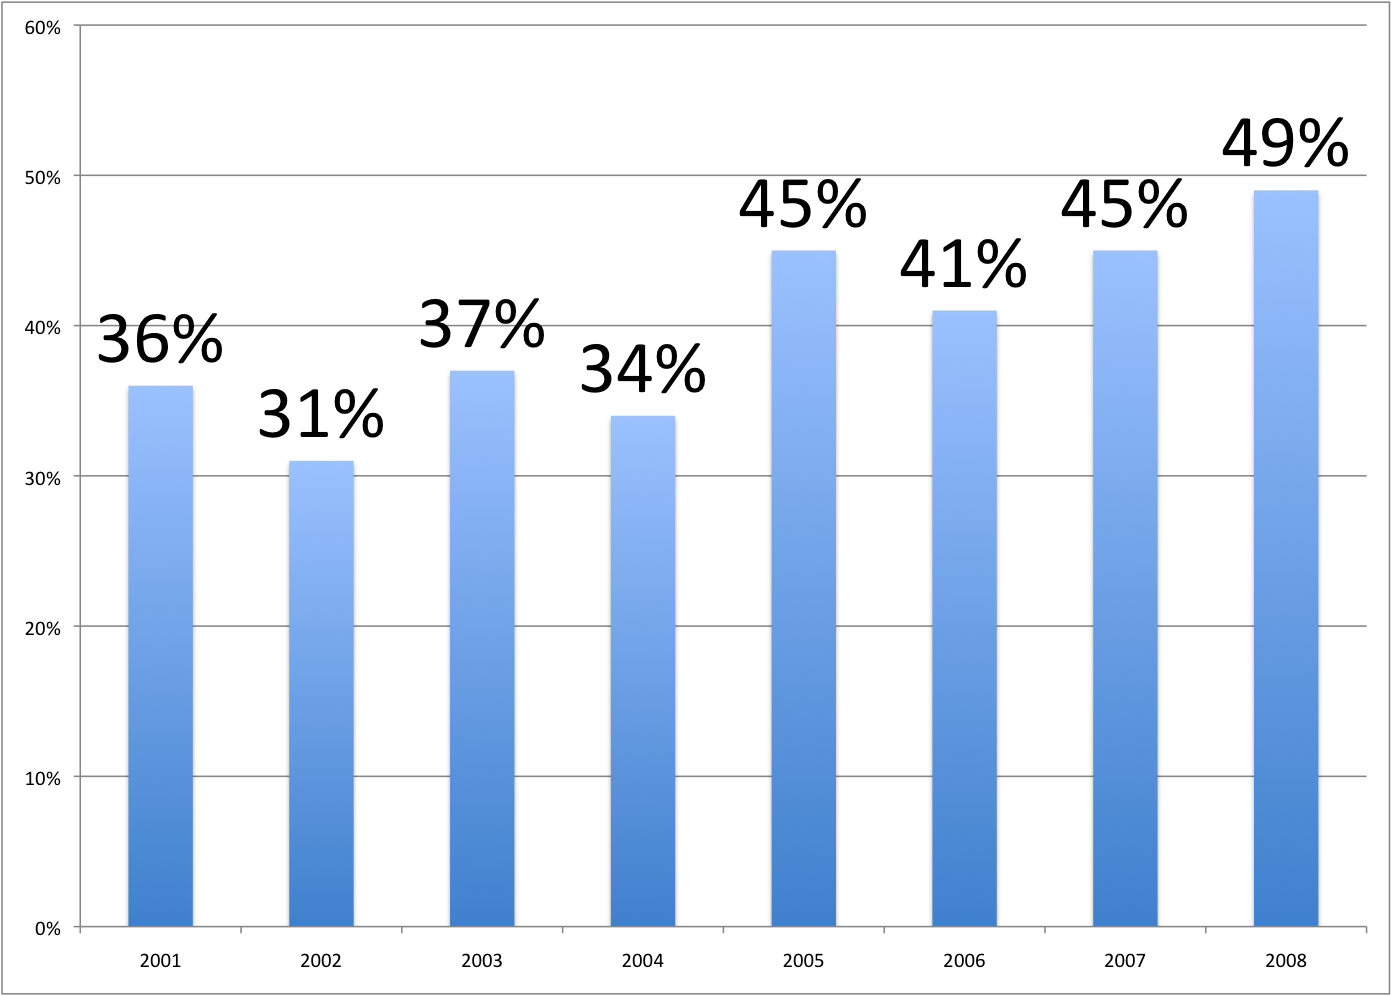
English: Created using Mathematica 7
BarChart[{Labeled[36, "36%", Top, White, Bold, FontSize -> 18],
  Labeled[31, "31%", Top, White, Bold, FontSize -> 18],
  Labeled[37, "37%", Top, White, Bold, FontSize -> 18],
  Labeled[34, "34%", Top, White, Bold, FontSize -> 18],
  Labeled[45, "45%", Top, White, Bold, FontSize -> 18],
  Labeled[41, "41%", Top, White, Bold, FontSize -> 18],
  Labeled[45, "45%", Top, White, Bold, FontSize -> 18],
  Labeled[49, "49%", Top, White, Bold, FontSize -> 18]},
 ChartLabels -> {"2001", "2002", "2003", "2004", "2005", "2006",
   "2007", "2008", "2009"}, Ticks -> None, ChartStyle -> Pink,
 Axes -> {True, False}, BarSpacing -> None]
|
| Source | I (Timothy Clemans) created this work entirely by myself. |
| Author |
Licensing
I, the copyright holder of this work, hereby publish it under the following license:
This file is licensed under the Creative Commons Attribution 3.0 Unported license.
- You are free:
- to share – to copy, distribute and transmit the work
- to remix – to adapt the work
- Under the following conditions:
- attribution – You must give appropriate credit, provide a link to the license, and indicate if changes were made. You may do so in any reasonable manner, but not in any way that suggests the licensor endorses you or your use.
File history
Click on a date/time to view the file as it appeared at that time.
| Date/Time | Thumbnail | Dimensions | User | Comment | |
|---|---|---|---|---|---|
| current | 20:58, 8 January 2010 | | 1,391 × 996 (323 KB) | Timothy Clemans | |
| 01:01, 15 November 2009 |  | 360 × 234 (6 KB) | Timothy Clemans | BarChart[{Labeled[36, "36%", Top, White, Bold, FontSize -> 18], Labeled[31, "31%", Top, White, Bold, FontSize -> 18], Labeled[37, "37%", Top, White, Bold, FontSize -> 18], Labeled[34, "34%", Top, White, Bold, FontSize -> 18], Labeled[45, "45%" | |
| 09:23, 14 November 2009 |  | 360 × 234 (4 KB) | Timothy Clemans | ||
| 09:03, 14 November 2009 |  | 360 × 234 (5 KB) | Timothy Clemans | cyan to light red | |
| 08:47, 14 November 2009 |  | 360 × 234 (5 KB) | Timothy Clemans | ||
| 08:45, 14 November 2009 |  | 360 × 234 (5 KB) | Timothy Clemans | BarChart[{Labeled[36, "36%", Top], Labeled[31, "31%", Top], Labeled[37, "37%", Top], Labeled[34, "34%", Top], Labeled[45, "45%", Top], Labeled[41, "41%", Top], Labeled[45, "45%", Top], Labeled[49, "49%", Top]}, ChartLabels -> {"2001", "2002", " | |
| 08:09, 14 November 2009 |  | 360 × 234 (6 KB) | Timothy Clemans | {{Information |Description = Created using Mathematica BarChart[{Labeled[36, "36%", Top], Labeled[31, "31%", Top], Labeled[37, "37%", Top], Labeled[34, "34%", Top], Labeled[45, "45%", Top], Labeled[41, "41%", Top], Labeled[45, "45%", Top], L |
File usage
The following pages on the English Wikipedia use this file (pages on other projects are not listed):