
Size of this preview: 473 × 600 pixels. Other resolutions: 189 × 240 pixels | 624 × 791 pixels.
Original file (624 × 791 pixels, file size: 27 KB, MIME type: image/png)
| This is a file from the Wikimedia Commons. Information from its description page there is shown below. Commons is a freely licensed media file repository. You can help. |
Summary
Made with the same data as Image:Isotopes and half-life.PNG.
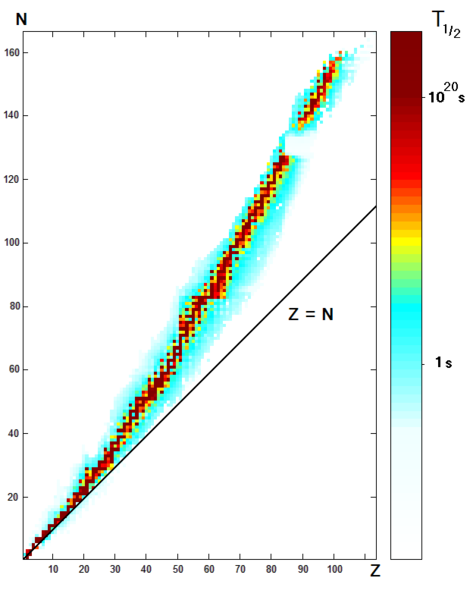
Graph of the stability of every known nucleus. Plotted as Z (number of protons) versus N (number of neutrons). The color corresponds to the value of the half-life T½ with a strong log scale, as it varies between and seconds.


|
File:Isotopes and half-life.svg is a vector version of this file. It should be used in place of this PNG file when not inferior.
File:Isotopes and half-life 1.PNG → File:Isotopes and half-life.svg
For more information, see Help:SVG. |
 |
Licensing
| I, the copyright holder of this work, release this work into the public domain. This applies worldwide. In some countries this may not be legally possible; if so: I grant anyone the right to use this work for any purpose, without any conditions, unless such conditions are required by law. |
File history
Click on a date/time to view the file as it appeared at that time.
| Date/Time | Thumbnail | Dimensions | User | Comment | |
|---|---|---|---|---|---|
| current | 15:29, 11 November 2006 | | 624 × 791 (27 KB) | Fffred~commonswiki | Made with the same data as Image:Isotopes and half-life.PNG. Graph of the stability of every known nucleus. Plotted as Z (number of protons) versus N (number of neutrons). The color corresponds t |
File usage
The following pages on the English Wikipedia use this file (pages on other projects are not listed):
Global file usage
The following other wikis use this file:
- Usage on fa.wikipedia.org
- Usage on fi.wikipedia.org
- Usage on fr.wikipedia.org
- Usage on id.wikipedia.org
- Usage on jv.wikipedia.org
- Usage on ru.wikipedia.org