Size of this preview: 800 × 600 pixels. Other resolutions: 320 × 240 pixels | 640 × 480 pixels | 1,024 × 768 pixels | 1,280 × 960 pixels | 1,500 × 1,125 pixels.
Original file (1,500 × 1,125 pixels, file size: 79 KB, MIME type: image/png)
| This is a file from the Wikimedia Commons. Information from its description page there is shown below. Commons is a freely licensed media file repository. You can help. |
Summary
| Description |
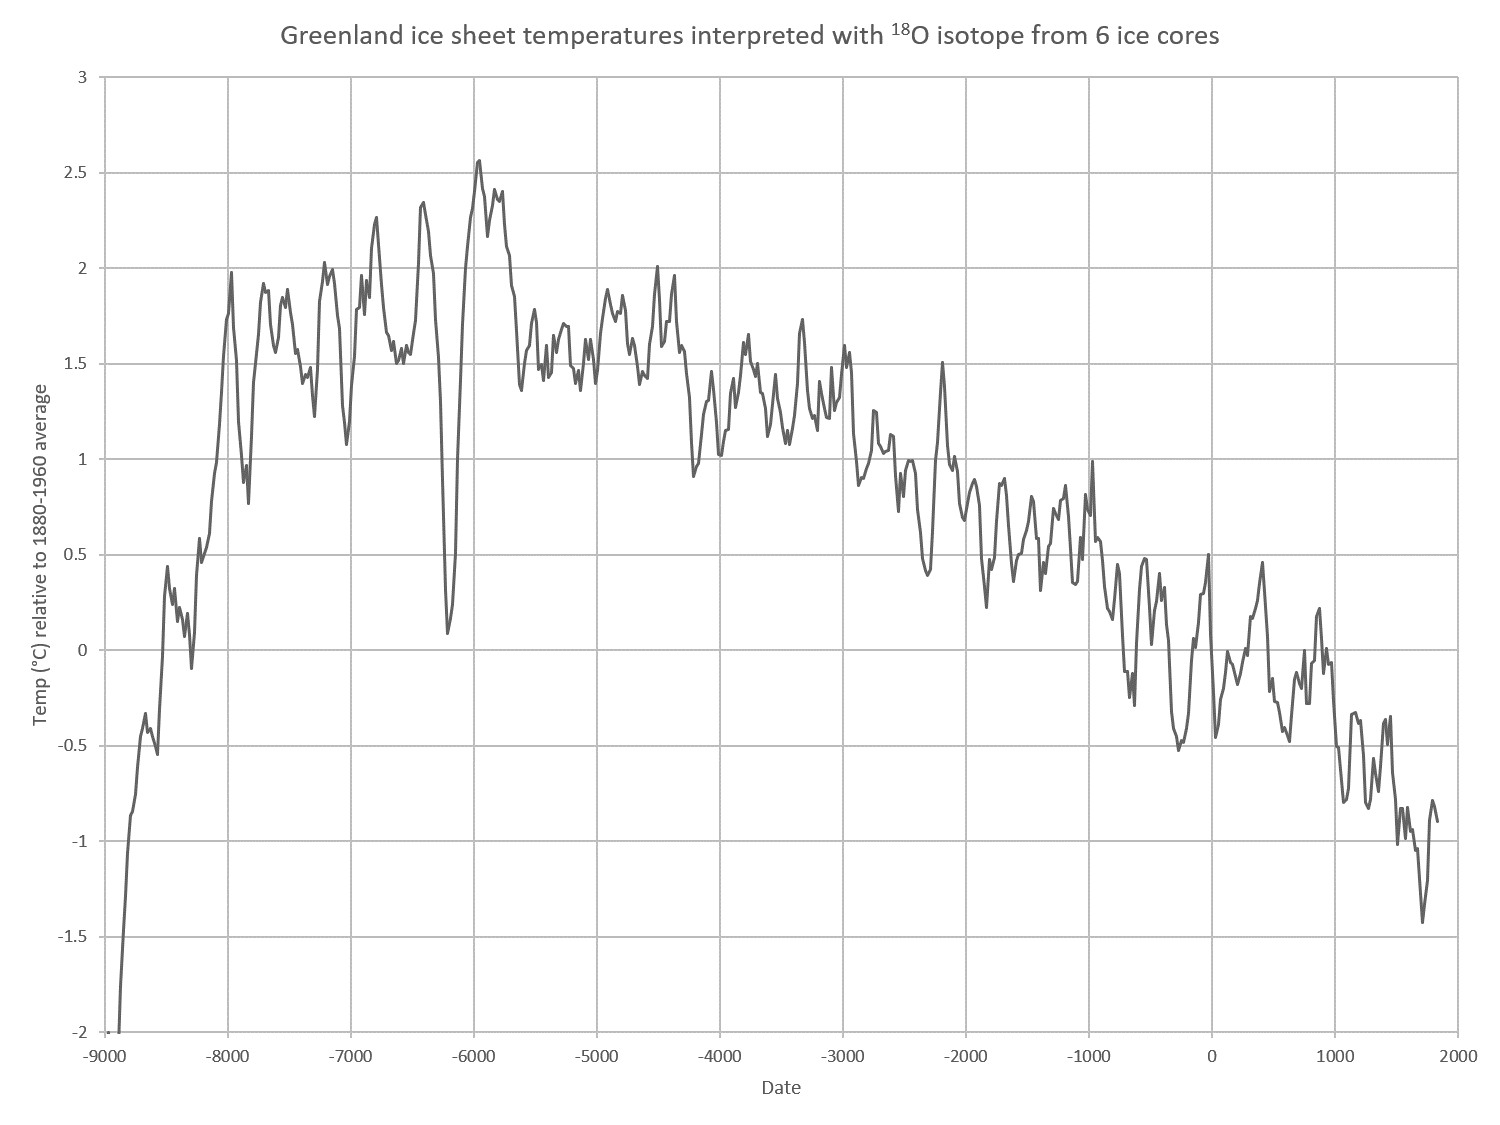
English: The temperature reconstruction produced using data from all six ice cores is shown in the source below, and spans the period from 9690 BC to AD 1970. The attached figure does not include the end record. It has a resolution of around 20 years, meaning that each data point represents the average temperature of the surrounding 20 years. The end of the record – 1970 – showing the average temperature between 1960 and 1980 - is not displayed on this figure (see the source below).
B. M. Vinther, S. L. Buchardt, H. B. Clausen, D. Dahl-Jensen, S. J. Johnsen, D. A. Fisher, R. M. Koerner, D. Raynaud, V. Lipenkov, K. K. Andersen, T. Blunier, S. O. Rasmussen, J. P. Steffensen & A. M. Svensson, "Holocene thinning of the Greenland ice sheet", Nature volume 461, pages 385–388 (17 September 2009). See also: https://www.carbonbrief.org/factcheck-what-greenland-ice-cores-say-about-past-and-present-climate-change |
| Date | |
| Source | Own work |
| Author | Artreve |
Licensing
I, the copyright holder of this work, hereby publish it under the following license:
This file is licensed under the Creative Commons Attribution-Share Alike 4.0 International license.
- You are free:
- to share – to copy, distribute and transmit the work
- to remix – to adapt the work
- Under the following conditions:
- attribution – You must give appropriate credit, provide a link to the license, and indicate if changes were made. You may do so in any reasonable manner, but not in any way that suggests the licensor endorses you or your use.
- share alike – If you remix, transform, or build upon the material, you must distribute your contributions under the same or compatible license as the original.
File history
Click on a date/time to view the file as it appeared at that time.
| Date/Time | Thumbnail | Dimensions | User | Comment | |
|---|---|---|---|---|---|
| current | 10:32, 1 April 2019 | | 1,500 × 1,125 (79 KB) | Artreve | User created page with UploadWizard |
File usage
No pages on the English Wikipedia use this file (pages on other projects are not listed).
Global file usage
The following other wikis use this file:
- Usage on fi.wikipedia.org
- Usage on ru.wikipedia.org
- Usage on te.wikipedia.org
- Usage on www.wikidata.org