
Size of this PNG preview of this SVG file: 600 × 480 pixels. Other resolutions: 300 × 240 pixels | 960 × 768 pixels | 1,280 × 1,024 pixels | 2,560 × 2,048 pixels.
Original file (SVG file, nominally 600 × 480 pixels, file size: 5 KB)
| This is a file from the Wikimedia Commons. Information from its description page there is shown below. Commons is a freely licensed media file repository. You can help. |
Summary
| Description |
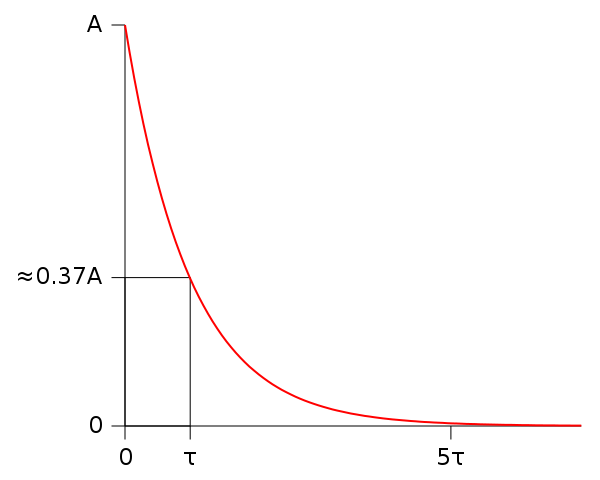
English: Graph of a decaying exponential function reaching 37% of its original value A after reaching the time constant τ. The exact units aren't given on the axis, although the graph is plotted using A=1 and τ=1. |
| Date | |
| Source | Designed to replace original bitmap version http://en.wikipedia.org/wiki/Image:Exponential_function_showing_time_constant.jpg |
| Author | Qef |
| Other versions | http://en.wikipedia.org/wiki/Image:Exponential_function_showing_time_constant.jpg |
Source code
This graph was created with gnuplot using the following input file:
set terminal svg font "Bitstream Vera Sans,18"
set output "Exponential_function_showing_time_constant.svg"

set xrange [0:7]
set yrange [0:1]
set xzeroaxis linetype -1
set yzeroaxis linetype -1
set xtics axis nomirror offset 0,0.3  (0, "τ" 1, "5τ" 5)
set ytics axis nomirror offset -0.8,0 (0, "≈0.37A" 0.37, "A" 1)
set key off
set border 0
set lmargin 10
set rmargin 1.5

set object 1 rectangle from 0, 0 to 1, 0.37 \
    back fs solid 0 linewidth 1

plot exp(x/-1) with line linetype rgbcolor "red" linewidth 2
Licensing
| This work has been released into the public domain by its author, Qef. This applies worldwide. In some countries this may not be legally possible; if so: |
File history
Click on a date/time to view the file as it appeared at that time.
| Date/Time | Thumbnail | Dimensions | User | Comment | |
|---|---|---|---|---|---|
| current | 10:01, 3 July 2008 | | 600 × 480 (5 KB) | Qef | {{Information |Description={{en|1=Graph of a decaying exponential function reaching 37% of its original value ''A'' after reaching the time constant τ. The exact units aren't given on the axis, although the graph is plotted using ''A''=1 and τ=1.}} |So |
File usage
The following pages on the English Wikipedia use this file (pages on other projects are not listed):