No higher resolution available.
Empirical_CDF.png (400 × 320 pixels, file size: 6 KB, MIME type: image/png)
| This is a file from the Wikimedia Commons. Information from its description page there is shown below. Commons is a freely licensed media file repository. You can help. |
Summary
| Description |
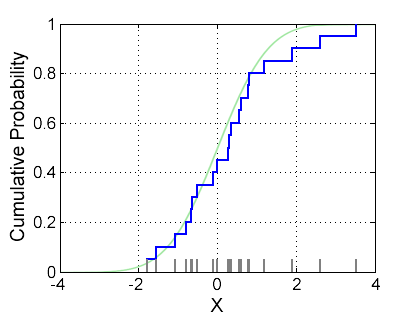
English: This is a visualization of an empirical distribution function. The grey bars show the samples corresponding to the ECDF and the green line is the theoretical distribution from which the samples have been drawn. |
| Date | |
| Source | Own work |
| Author | Bscan |
| Other versions |
|

%This is Matlab code to generate a visualization of the empirical
%distribution function
%This code released under the CC0 "license"

%Generate random samples
NumSamps =20;

%Get standard normally distributed samples
samples = randn(NumSamps,1);

%Get emprical cdf
[f,x] = ecdf(samples);

%Get real cdf
x_cdf = [-5:0.01:5];
y_cdf = normcdf(x_cdf);

%Generate figure;
figure; hold on;
plot(x_cdf,y_cdf,'-','Color',[0.6 0.6 0.6],'LineWidth',2);
stairs(x,f,'b-','LineWidth',2);
%The 1/NumSamps ensures the black bars are scaled to be probabilities
plot([samples samples]',[zeros(NumSamps,1) (1/NumSamps)*ones(NumSamps,1)]','-k','LineWidth',2);
set(gca,'FontSize',12)
grid on; box on;
xlim([-4 4])
Licensing
I, the copyright holder of this work, hereby publish it under the following license:
| This file is made available under the Creative Commons CC0 1.0 Universal Public Domain Dedication. | |
| The person who associated a work with this deed has dedicated the work to the public domain by waiving all of their rights to the work worldwide under copyright law, including all related and neighboring rights, to the extent allowed by law. You can copy, modify, distribute and perform the work, even for commercial purposes, all without asking permission.
|
This diagram was created with MATLAB.
File history
Click on a date/time to view the file as it appeared at that time.
| Date/Time | Thumbnail | Dimensions | User | Comment | |
|---|---|---|---|---|---|
| current | 10:57, 28 January 2018 | | 400 × 320 (6 KB) | Nagualdesign | Tweaks. |
| 22:05, 27 January 2018 |  | 412 × 318 (6 KB) | Nagualdesign | Green curve. | |
| 20:11, 27 January 2018 |  | 412 × 318 (6 KB) | Nagualdesign | Tail (top). | |
| 19:30, 27 January 2018 |  | 412 × 318 (6 KB) | Nagualdesign | Antialiased numbers. | |
| 18:56, 27 January 2018 |  | 412 × 318 (6 KB) | Nagualdesign | Antialiasing. | |
| 15:04, 25 March 2013 |  | 412 × 318 (4 KB) | Bscan | User created page with UploadWizard |
File usage
The following pages on the English Wikipedia use this file (pages on other projects are not listed):
Global file usage
The following other wikis use this file:
- Usage on eu.wikipedia.org
- Usage on it.wikipedia.org
- Usage on zh.wikipedia.org