ColdnessScale.png (361 × 386 pixels, file size: 32 KB, MIME type: image/png)
| This is a file from the Wikimedia Commons. Information from its description page there is shown below. Commons is a freely licensed media file repository. You can help. |

|
File:ColdnessScale.svg is a vector version of this file. It should be used in place of this PNG file when not inferior.
File:ColdnessScale.png → File:ColdnessScale.svg
For more information, see Help:SVG. |
 |
Summary
| Description |
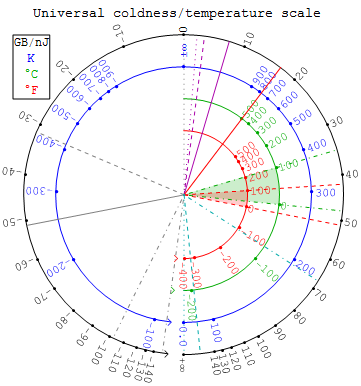
English: Universal coldness/temperature scale in SI units, where coldness[1][2][3][4][5][6] is one possible name for reciprocal-temperature[7] in non-thermal units[8] i.e. β ≡ 1/kT ≡ 1/k dS/dE. This energy uncertainty-slope dS/dE approaches a common value for systems that randomly (or thermally) share energy E, since heat energy naturally flows from low (even negative) to high coldness (toward more "choice of open-slots" or "ways to play", and therefore clockwise) until sharing systems reach a common (equilibrium) value of this slope. Bottom line: 1 Kelvin of ambient temperature requires one to thermalize about 76.5594 picoJoules of ordered energy for every teraByte of subsystem correlation-information created, and 1 nanoJoule/Kelvin of information takes up about 13.0618 teraBytes of memory. |
| Date | |
| Source | Own work |
| Author | P. Fraundorf |
Added notes
The radial lines denote key temperatures, clockwise from bottom including He evaporation (dotted cyan) around 4K ↔ 3265GB/nJ (just CCW from the 4732.51GB/nJ of the 2.76K cosmic background) and N2 evaporation (dashed cyan) around 77K ↔ 170GB/nJ, CO2 sublimation around -78.5oC ↔ 67.1GB/nJ (solid cyan), H2O liquification around 0oC ↔ 47.8GB/nJ and evaporation around 100oC ↔ 35.0GB/nJ (dashed-green), "red-hot" (solid red) around 500oC ↔ 16.9GB/nJ, rock melting around 1500oC ↔ 7.37GB/nJ (solid magenta), graphite sublimation (dashed magenta) around 3642oC ↔ 3.34GB/nJ, and the surface of the sun (dotted magenta) around 5778K ↔ 2.26GB/nJ ≈ 2.01 nat/eV. The dashed red lines represent the min-max European temperature range (from 0oF ↔ 51.2GB/nJ to 100oF ↔ 42.0GB/nJ) on which Fahrenheit based his scale, at top of which is also the human basal temperature at around 98.6oF ↔ 42.1GB/nJ. Room temperature (3 o'clock) is defined as either 20o = 68oF ↔ 44.6GB/nJ ≈ 39.6 nat/eV = 1/kT or 22oC = 71.6oF ↔ 44.3GB/nJ ≈ 39.3 nat/eV = 1/kT, and therefore kTroom is about 1/40 of an electron Volt.
Inverted-population states for finite-energy systems are found on the left half of this plot. These include: (i) 1024 end-on dominoes acting like stonehenge in the earth's gravitational-field (grey-dotted) at -.001[J]/(kBln[1024]) ≈ -1.04×10¹⁹K ↔ -1.25×10-15GB/nJ, (ii) a mole of excited Ne atoms in a He-Ne LASER ready for stimulated-emission (grey-dashed) at -1.96[eV]/(kBln[6×1023]) ≈ -415K ↔ -31.5GB/nJ, and (iii) the orientation-temperature for 500,001 up out of 1,000,000 proton-spins in a 1 Tesla field (grey) at 1.41×10⁻²⁶J/(kB(ψ[1+1000000-500001]-ψ[1+500001])) ≈ -1.41×10⁻²⁶J/(kBln[1000000/500001-1]) ≈ -255K ↔ -51.1GB/nJ where ψ[x] is the PolyGamma function. The dot-dashed grey lines are for 500,002 and 500,003 out of 1,000,000 protons oriented spin-up in that same 1[Tesla] field.
This plot illustrates that you can use either temperature T or reciprocal-temperature 1/kT to predict the direction of heat-flow. When you use temperature, remember that the highest possible temperature T is minus-zero-Kelvin and the lowest possible T is plus-zero-Kelvin. With coldness 1/kT, the lowest value is minus-infinity and the highest is plus-infinity so that heat energy naturally and simply flows from numerically low to numerically high 1/kT.
| unit to → ↓ from ↓ |
TF in oF |
TC in oC |
T in K |
ε ≡ kT in eV/nat |
β0 ≡ 1/kT in GiB/nJ |
β1 ≡ 1/kT in GB/nJ |
β2 ≡ 1/kT in ZB/Cal |
|---|---|---|---|---|---|---|---|
| TF | 1 | 5/9(TF-32) | 5/9(TF-32)+273.15 | ||||
| TC | 9/5TC+32 | 1 | TC+273.15 | ||||
| T | 9/5(T-273.15)+32 | T-273.15 | 1 | 8.61733×10⁻⁵T | 12165/T | 13062/T | 54650/T |
| ε | 11604.5ε | 1 | 1.0483/ε | 1.1256/ε | 4.7049/ε | ||
| β0 | 12165/β0 | 1.0483/β0 | 1 | 1.0737β0 | |||
| β1 | 13062/β1 | 1.1256/β1 | β1/1.0737 | 1 | 4.184β1 | ||
| β2 | 54650/β2 | 4.7049/β2 | β2/4.184 | 1 |
In the table of conversions above, note that the uncertainty-slope or coldness β≡1/kT in [GiB/nJ] or [GB/nJ] is nearly equal to the reciprocal of kT in [eV/nat]. Even more curiously, if we don't mind using binary-multiples i.e. gibiBytes instead of powers of ten, we can say that 1[nat/eV] = 1.04827[GiB/nJ] = 1.12557[GB/nJ]. Hence room temperature coldness is about 40[GiB/nJ] simply because kT at room temperature is about 1/40[eV].
Footnotes
- ↑ Claude Garrod (1995) Statistical Mechanics and Thermodynamics (Oxford U. Press).
- ↑ J. Meixner (1975) "Coldness and Temperature", Archive for Rational Mechanics and Analysis 57:3, 281-290 abstract.
- ↑ Ingo Mueller (1972) Entropy, Absolute Temperature and Coldness in Thermodynamics: Boundary conditions in porous materials (Springer-Verlag, Wein GMBH) preview
- ↑ Ingo Müller (1971) "The coldness, a universal function in thermoelastic bodies", Archive for Rational Mechanics and Analysis 41:5, 319-332 abstract.
- ↑ Müller, I. (1971) "Die Kältefunktion, eine universelle Funktion in der Thermodynamik wärmeleitender Flüssigkeiten.", Arch. Rational Mech. Anal. 40, 1–36.
- ↑ Day, W.A. and Gurtin, Morton E. (1969) "On the symmetry of the conductivity tensor and other restrictions in the nonlinear theory of heat conduction", Archive for Rational Mechanics and Analysis 33:1, 26-32 (Springer-Verlag) abstract.
- ↑ J. Castle, W. Emmenish, R. Henkes, R. Miller, and J. Rayne (1965) Science by Degrees: Temperature from Zero to Zero (Westinghouse Search Book Series, Walker and Company, New York).
- ↑ P. Fraundorf (2003) "Heat capacity in bits", Amer. J. Phys. 71:11, 1142-1151.
Licensing
- You are free:
- to share – to copy, distribute and transmit the work
- to remix – to adapt the work
- Under the following conditions:
- attribution – You must give appropriate credit, provide a link to the license, and indicate if changes were made. You may do so in any reasonable manner, but not in any way that suggests the licensor endorses you or your use.
- share alike – If you remix, transform, or build upon the material, you must distribute your contributions under the same or compatible license as the original.
File history
Click on a date/time to view the file as it appeared at that time.
| Date/Time | Thumbnail | Dimensions | User | Comment | |
|---|---|---|---|---|---|
| current | 11:29, 2 October 2015 | | 361 × 386 (32 KB) | Unitsphere | The Fahrenheit and Celsius lines have now been truncated to the positive-Kelvin half-plane, since those measures make little or no sense for dealing with inverted population states. |
| 15:24, 1 October 2015 |  | 361 × 384 (34 KB) | Unitsphere | added two other proton lines -- will amend caption shortly | |
| 15:20, 24 January 2013 |  | 371 × 391 (40 KB) | Unitsphere | User created page with UploadWizard |
File usage
Global file usage
The following other wikis use this file:
- Usage on ar.wikipedia.org
- Usage on fa.wikipedia.org
- Usage on zh.wikipedia.org