
Original file (SVG file, nominally 400 × 247 pixels, file size: 22 KB)
| This is a file from the Wikimedia Commons. Information from its description page there is shown below. Commons is a freely licensed media file repository. You can help. |
Summary
| Description |
English: {| cellspacing="8" cellpadding="0" style="width:100%; clear:both; margin:0.5em auto; background-color:#f7f8ff; border:2px solid #4488dd; direction:ltr;"
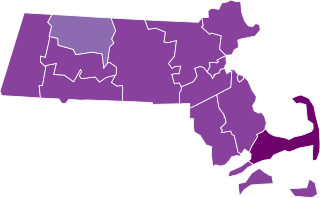
| style="width:50px" | 1000+ confirmed new cases per 100,000 population
500 - 1000 confirmed new cases per 100,000 population 200 - 500 confirmed new cases per 100,000 population
100 - 200 confirmed new cases per 100,000 population
50 - 100 confirmed new cases per 100,000 population
20 - 50 confirmed new cases per 100,000 population
10 - 20 confirmed new cases per 100,000 population
0 - 10 confirmed new cases per 100,000 population
No confirmed new cases
The design is based on blank maps available in Public Domain (created by Yiling Chen from TIGER shapefiles). The script for creating the maps was written by Sukolsak Sakshuwong and Lodewijk Gelauff. Color scheme is based on ColorBrewer 6-class BuPu.
|
||
| Date | |||
| Source | Own work | ||
| Author | Effeietsanders |

Licensing
| This file is made available under the Creative Commons CC0 1.0 Universal Public Domain Dedication. | |
| The person who associated a work with this deed has dedicated the work to the public domain by waiving all of their rights to the work worldwide under copyright law, including all related and neighboring rights, to the extent allowed by law. You can copy, modify, distribute and perform the work, even for commercial purposes, all without asking permission.
|
File history
Click on a date/time to view the file as it appeared at that time.
| Date/Time | Thumbnail | Dimensions | User | Comment | |
|---|---|---|---|---|---|
| current | 01:40, 29 March 2021 | | 400 × 247 (22 KB) | Eiabot | new data: 27 March 2021 |
| 00:11, 25 March 2021 |  | 400 × 247 (22 KB) | Eiabot | new data: 23 March 2021 | |
| 06:19, 16 March 2021 |  | 400 × 247 (22 KB) | Eiabot | new data: 15 March 2021 | |
| 06:20, 14 March 2021 |  | 400 × 247 (22 KB) | Eiabot | new data: 13 March 2021 | |
| 06:53, 12 March 2021 |  | 400 × 247 (22 KB) | Eiabot | new data: 11 March 2021 | |
| 18:14, 4 March 2021 |  | 400 × 247 (22 KB) | Eiabot | new data: 03 March 2021 | |
| 07:37, 28 February 2021 |  | 400 × 247 (22 KB) | Eiabot | new data: 27 February 2021 | |
| 20:10, 25 February 2021 |  | 400 × 247 (22 KB) | Eiabot | new data: 24 February 2021 | |
| 06:26, 21 February 2021 |  | 400 × 247 (22 KB) | Eiabot | new data: 20 February 2021 | |
| 07:02, 18 February 2021 |  | 400 × 247 (22 KB) | Eiabot | new data: 17 February 2021 |