
Size of this PNG preview of this SVG file: 799 × 600 pixels. Other resolutions: 320 × 240 pixels | 639 × 480 pixels | 1,023 × 768 pixels | 1,280 × 961 pixels | 2,560 × 1,922 pixels | 1,441 × 1,082 pixels.
Original file (SVG file, nominally 1,441 × 1,082 pixels, file size: 372 KB)
| This is a file from the Wikimedia Commons. Information from its description page there is shown below. Commons is a freely licensed media file repository. You can help. |
Summary
| Description |
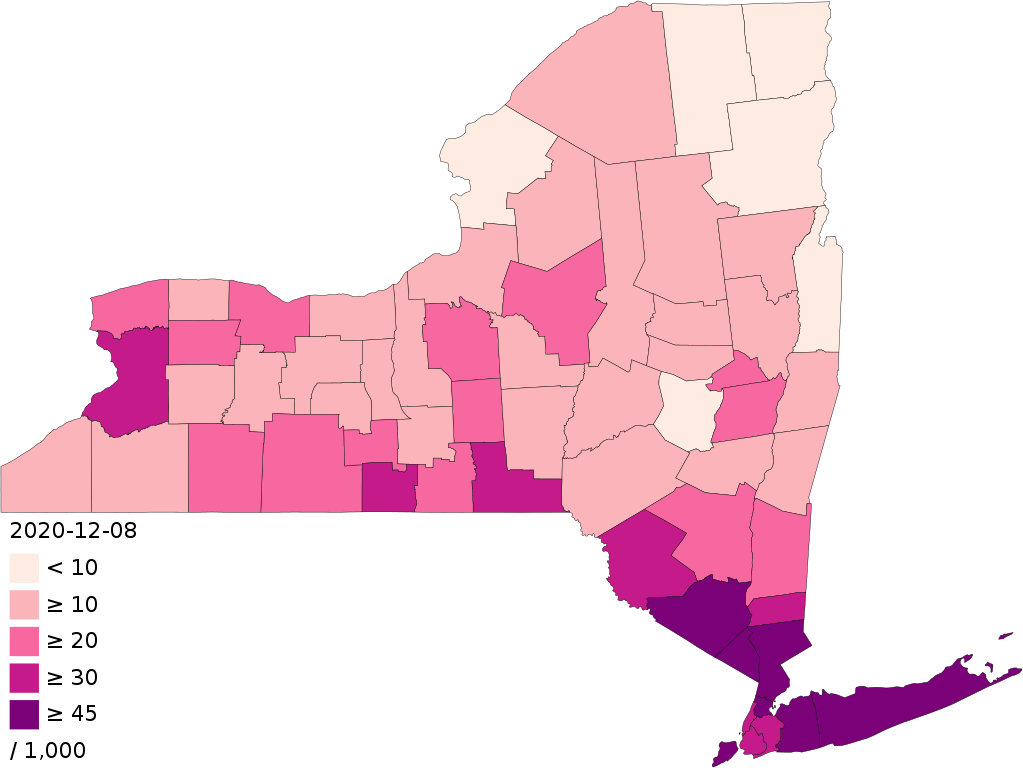
English: Confirmed cases of COVID-19 per 1,000 inhabitants in New York by county[1] |
| Date | |
| Source | Own work; created using Python script |
| Author | Ythlev |
Licensing
I, the copyright holder of this work, hereby publish it under the following license:
This file is licensed under the Creative Commons Attribution-Share Alike 4.0 International license.
- You are free:
- to share – to copy, distribute and transmit the work
- to remix – to adapt the work
- Under the following conditions:
- attribution – You must give appropriate credit, provide a link to the license, and indicate if changes were made. You may do so in any reasonable manner, but not in any way that suggests the licensor endorses you or your use.
- share alike – If you remix, transform, or build upon the material, you must distribute your contributions under the same or compatible license as the original.
File history
Click on a date/time to view the file as it appeared at that time.
| Date/Time | Thumbnail | Dimensions | User | Comment | |
|---|---|---|---|---|---|
| current | 19:18, 10 December 2020 | | 1,441 × 1,082 (372 KB) | TheNavigatrr | 12-08 |
| 05:23, 6 December 2020 |  | 1,441 × 1,082 (372 KB) | TheNavigatrr | Update | |
| 02:05, 30 November 2020 |  | 1,441 × 1,082 (372 KB) | TheNavigatrr | Updated for 11-28. | |
| 00:26, 20 November 2020 |  | 1,441 × 1,082 (372 KB) | TheNavigatrr | Updated for 11-19. | |
| 03:56, 18 November 2020 |  | 1,441 × 1,082 (372 KB) | TheNavigatrr | This revised color scale (in anticipation of larger spread in winter) shows the relative difference between Westchester/Rockland/Orange (which have >4% infection rates) and the boroughs of NYC. | |
| 03:48, 18 November 2020 |  | 1,441 × 1,082 (372 KB) | TheNavigatrr | 11-17 update | |
| 03:38, 18 November 2020 |  | 1,441 × 1,082 (372 KB) | TheNavigatrr | Uploaded a more recent version of this map. | |
| 23:09, 2 November 2020 |  | 1,441 × 1,082 (371 KB) | TheNavigatrr | 11-02 | |
| 02:21, 31 October 2020 |  | 1,441 × 1,082 (371 KB) | TheNavigatrr | 10-29 | |
| 21:13, 28 October 2020 |  | 1,441 × 1,082 (371 KB) | TheNavigatrr | 10-28 |
File usage
No pages on the English Wikipedia use this file (pages on other projects are not listed).
Global file usage
The following other wikis use this file:
- Usage on cs.wikipedia.org
- Usage on id.wikipedia.org
- Usage on ru.wikipedia.org
- Usage on zh.wikipedia.org