
Size of this preview: 666 × 599 pixels. Other resolutions: 267 × 240 pixels | 533 × 480 pixels | 853 × 768 pixels | 1,138 × 1,024 pixels | 2,276 × 2,048 pixels | 2,700 × 2,430 pixels.
Original file (2,700 × 2,430 pixels, file size: 353 KB, MIME type: image/png)
| This is a file from the Wikimedia Commons. Information from its description page there is shown below. Commons is a freely licensed media file repository. You can help. |
Summary
| Description |
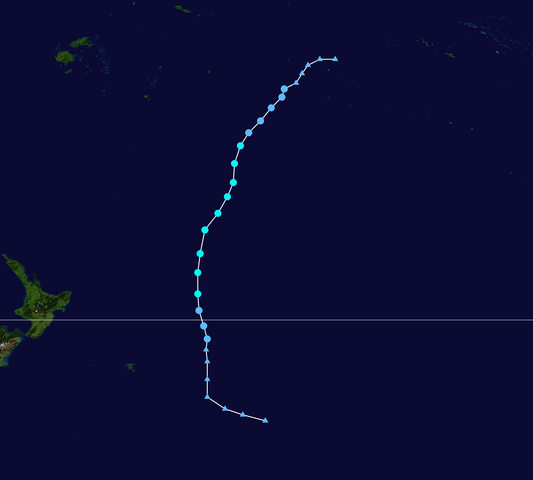
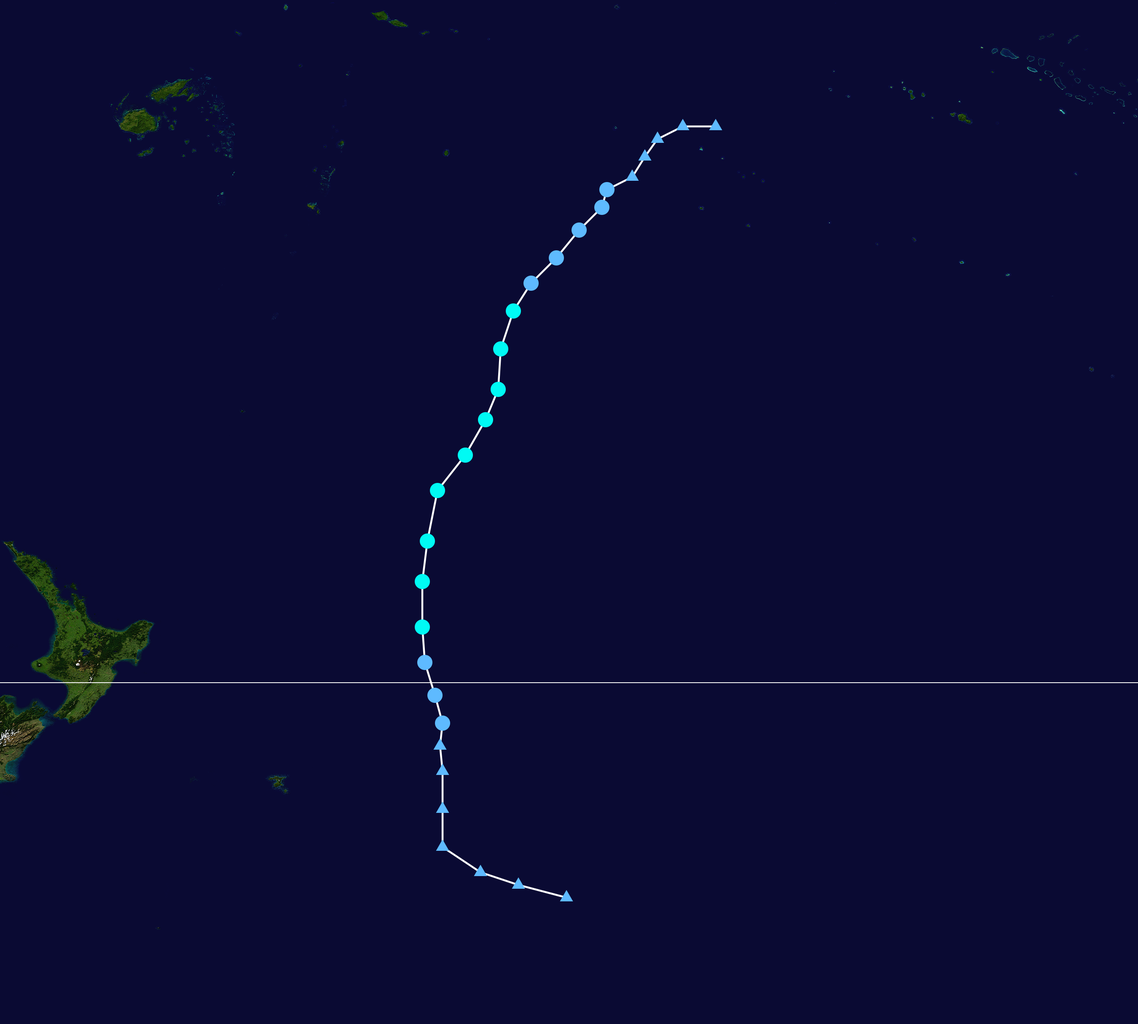
English: Track map of Tropical Storm 29P of the 1996–97 Southern Hemisphere tropical cyclone season. The points show the location of the storm at 6-hour intervals. The colour represents the storm's maximum sustained wind speeds as classified in the Saffir-Simpson Hurricane Scale (see below), and the shape of the data points represent the nature of the storm, according to the legend below.
Tropical depression (≤38 mph, ≤62 km/h)
Tropical storm (39–73 mph, 63–118 km/h)
Category 1 (74–95 mph, 119–153 km/h)
Category 2 (96–110 mph, 154–177 km/h)
Category 3 (111–129 mph, 178–208 km/h)
Category 4 (130–156 mph, 209–251 km/h)
Category 5 (≥157 mph, ≥252 km/h)
Unknown
Storm type |
| Date | |
| Source | Created by Cyclonebiskit using Wikipedia:WikiProject Tropical cyclones/Tracks. The background image is from NASA. Tracking data from the National Hurricane Center[1] or the Joint Typhoon Warning Center. [2] |
| Author | Cyclonebiskit |
Licensing
| I, the copyright holder of this work, release this work into the public domain. This applies worldwide. In some countries this may not be legally possible; if so: I grant anyone the right to use this work for any purpose, without any conditions, unless such conditions are required by law. |
File history
Click on a date/time to view the file as it appeared at that time.
| Date/Time | Thumbnail | Dimensions | User | Comment | |
|---|---|---|---|---|---|
| current | 20:45, 15 January 2020 | | 2,700 × 2,430 (353 KB) | FleurDeOdile | IBTrACS data |
| 22:51, 5 August 2009 |  | 1,024 × 633 (45 KB) | Cyclonebiskit | forgot ET points | |
| 22:46, 5 August 2009 |  | 1,024 × 1,001 (66 KB) | Cyclonebiskit | {{Information |Description={{en|Track map of Tropical Storm 29P of the 1996–97 Southern Hemisphere tropical cyclone season. The points show the location of the storm at 6-hour intervals. The co |
File usage
The following pages on the English Wikipedia use this file (pages on other projects are not listed):