Wyoming's 39th House of Representatives district
(Redirected from Wyoming House of Representatives 39th district)
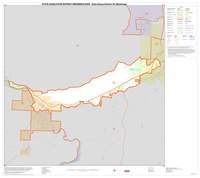
Wyoming's 39th House of Representatives district in the United States is one of 60 legislative districts included in the lower house of the Wyoming Legislature. It covers part of Sweetwater County, which compromises the Rock Springs—Green River—Wyoming Micropolitan Statistical Area.[1][2]
| Wyoming's 39th State House of Representatives district | |||
|---|---|---|---|
 Wyoming House of Representatives 39th district since January 7, 2013 | |||
| Representative |
| ||
| Demographics | 88.2% White 1.4% Black 3.6% Hispanic 1.2% Asian 1.2% Native American 0.1% Hawaiian/Pacific Islander 5.8% Other 2.6% Multiracial | ||
| Population (2011) | 10,207 | ||
Towns represented edit
- Rock Springs
- Green River (county seat)
List of members representing the district edit
| Representative | Party | Dates | Legislature | Electoral history |
|---|---|---|---|---|
| Chris Boswell[3] | Democratic | January 4, 1993 – January 6, 2003 | 52nd, 53rd, 54th, 55th, 56th |
Elected in 1992. Retired in 2002. |
John Hastert |
January 6, 2003 – January 1, 2007 | 57th, 58th |
Elected in 2002. Retired in 2006. | |
Stan Blake |
January 1, 2007 – January 12, 2021 | 59th, 60th, 61st, 62nd, 63rd, 64th, 65th |
Elected in 2006. Lost re-election in 2020. | |
_(cropped).jpg) Marshall Burt |
Libertarian | January 12, 2021 – January 10, 2023 | 66th | Elected in 2020. Lost re-election in 2022. |
Cody Wylie |
Republican | January 10, 2023 – present | 67th | Elected in 2022. |
Recent election results edit
2022 edit
| Party | Candidate | Votes | % | ||
|---|---|---|---|---|---|
| Republican | Cody Wylie | 1,763 | 75.1% | ||
| Libertarian | Marshall Burt (incumbent) | 586 | 24.9% | ||
| Total votes | 2,349 | 100.0% | |||
| Republican gain from Libertarian | |||||
2020 edit
| Party | Candidate | Votes | % | ||
|---|---|---|---|---|---|
| Libertarian | Marshall Burt | 1,696 | 53.6% | ||
| Democratic | Stan Blake (incumbent) | 1,421 | 44.9% | ||
| Write-in | 47 | 1.5% | |||
| Total votes | 3,164 | 100.0% | |||
| Libertarian gain from Democratic | |||||
| Candidate | Votes | % | |
|---|---|---|---|
| Stan Blake (incumbent) | 428 | 98.8% | |
| Write-in | 5 | 1.2% | |
| Total votes | 433 | 100% | |
2018 edit
| Party | Candidate | Votes | % | |
|---|---|---|---|---|
| Democratic | Stan Blake (incumbent) | 454 | 100.0% | |
| Total votes | 454 | 100.0% | ||
| Party | Candidate | Votes | % | |
|---|---|---|---|---|
| Democratic | Stan Blake (incumbent) | 1,823 | 95.1% | |
| Write-In | Write in | 94 | 4.9% | |
| Total votes | 1,917 | 100.0% | ||
| Democratic hold | ||||
2016 edit
| Party | Candidate | Votes | % | |
|---|---|---|---|---|
| Democratic | Stan Blake (incumbent) | 491 | 100.0% | |
| Total votes | 491 | 100.0% | ||
| Party | Candidate | Votes | % | |
|---|---|---|---|---|
| Democratic | Stan Blake (incumbent) | 2,628 | 100.0% | |
| Total votes | 2,628 | 100.0% | ||
| Democratic hold | ||||
2014 edit
| Party | Candidate | Votes | % | |
|---|---|---|---|---|
| Democratic | Stan Blake (incumbent) | 473 | 100.0% | |
| Total votes | 473 | 100.0% | ||
| Party | Candidate | Votes | % | |
|---|---|---|---|---|
| Democratic | Stan Blake (incumbent) | 1,644 | 100.0% | |
| Total votes | 1,644 | 100.0% | ||
| Democratic hold | ||||
2012 edit
| Party | Candidate | Votes | % | |
|---|---|---|---|---|
| Democratic | Stan Blake (incumbent) | 410 | 100.0% | |
| Total votes | 410 | 100.0% | ||
| Party | Candidate | Votes | % | |
|---|---|---|---|---|
| Democratic | Stan Blake (incumbent) | 2,727 | 100.0% | |
| Total votes | 2,727 | 100.0% | ||
| Democratic hold | ||||
2010 edit
| Party | Candidate | Votes | % | |
|---|---|---|---|---|
| Democratic | Stan Blake (incumbent) | 724 | 100.0% | |
| Total votes | 724 | 100.0% | ||
| Party | Candidate | Votes | % | |
|---|---|---|---|---|
| Democratic | Stan Blake (incumbent) | 1,899 | 100.0% | |
| Total votes | 1,899 | 100.0% | ||
| Democratic hold | ||||
2008 edit
| Party | Candidate | Votes | % | |
|---|---|---|---|---|
| Democratic | Stan Blake (incumbent) | 639 | 100.0% | |
| Total votes | 639 | 100.0% | ||
| Party | Candidate | Votes | % | |
|---|---|---|---|---|
| Democratic | Stan Blake (incumbent) | 2,714 | 100.0% | |
| Total votes | 2,714 | 100.0% | ||
| Democratic hold | ||||
2006 edit
| Party | Candidate | Votes | % | |
|---|---|---|---|---|
| Democratic | Stan Blake | 932 | 100.0% | |
| Total votes | 932 | 100.0% | ||
| Party | Candidate | Votes | % | |
|---|---|---|---|---|
| Democratic | Stan Blake | 2,173 | 100.0% | |
| Total votes | 2,173 | 100.0% | ||
| Democratic hold | ||||
2004 edit
| Party | Candidate | Votes | % | |
|---|---|---|---|---|
| Democratic | John Hastert (incumbent) | 982 | 100.0% | |
| Total votes | 982 | 100.0% | ||
| Party | Candidate | Votes | % | |
|---|---|---|---|---|
| Democratic | John Hastert (incumbent) | 2,800 | 100.0% | |
| Total votes | 2,800 | 100.0% | ||
| Democratic hold | ||||
2002 edit
| Party | Candidate | Votes | % | |
|---|---|---|---|---|
| Democratic | Chris Boswell (incumbent) | 1,180 | 100.0% | |
| Total votes | 1,180 | 100.0% | ||
| Party | Candidate | Votes | % | |
|---|---|---|---|---|
| Democratic | Chris Boswell (incumbent) | 2,176 | 100.0% | |
| Total votes | 2,176 | 100.0% | ||
| Democratic hold | ||||
2000 edit
| Party | Candidate | Votes | % | |
|---|---|---|---|---|
| Democratic | Chris Boswell (incumbent) | 1,014 | 100.0% | |
| Total votes | 1,014 | 100.0% | ||
| Party | Candidate | Votes | % | |
|---|---|---|---|---|
| Democratic | Chris Boswell (incumbent) | 2,321 | 100.0% | |
| Total votes | 2,321 | 100.0% | ||
| Democratic hold | ||||
1998 edit
| Party | Candidate | Votes | % | |
|---|---|---|---|---|
| Democratic | Chris Boswell (incumbent) | 1,031 | 100.0% | |
| Total votes | 1,031 | 100.0% | ||
| Party | Candidate | Votes | % | |
|---|---|---|---|---|
| Democratic | Chris Boswell (incumbent) | 1,958 | 100.0% | |
| Total votes | 1,958 | 100.0% | ||
| Democratic hold | ||||
1996 edit
| Party | Candidate | Votes | % | |
|---|---|---|---|---|
| Democratic | Chris Boswell (incumbent) | 756 | 100.0% | |
| Total votes | 756 | 100.0% | ||
| Party | Candidate | Votes | % | |
|---|---|---|---|---|
| Democratic | Chris Boswell (incumbent) | 2,149 | 100.0% | |
| Total votes | 2,149 | 100.0% | ||
| Democratic hold | ||||
See also edit
References edit
- ^ "Legislative maps 2012. District HD 39" (PDF). wyo.gov. Retrieved September 13, 2023.
- ^ "Wyoming State House - District 39 Election Results | Milwaukee Journal Sentinel". www.jsonline.com.
- ^ "Political Briefs". Casper, Wyoming: Casper Star Tribune. July 11, 2004. Retrieved February 24, 2017.
- ^ "2022 Wyoming State House - District 39 Election Results". www.jsonline.com. Gannett. Retrieved January 22, 2023.
- ^ "2020 Democratic Primary election results" (PDF). sos.wyo.gov/elections/electionresults.aspx.
- ^ "2018 Democratic Primary election results" (PDF). sos.wyo.gov/elections/electionresults.aspx.
- ^ "2018 General election results" (PDF). sos.wyo.gov/elections/electionresults.aspx.
- ^ "2016 Democratic Primary election results" (PDF). sos.wyo.gov/elections/electionresults.aspx.
- ^ "2016 General election results" (PDF). sos.wyo.gov/elections/electionresults.aspx.
- ^ "2014 Democratic Primary election results" (PDF). sos.wyo.gov/elections/electionresults.aspx.
- ^ "2014 General election results" (PDF). sos.wyo.gov/elections/electionresults.aspx.
- ^ "2012 Democratic Primary election results" (PDF). sos.wyo.gov/elections/electionresults.aspx.
- ^ "2012 General election results" (PDF). sos.wyo.gov/elections/electionresults.aspx.
- ^ "2010 Democratic Primary election results" (PDF). sos.wyo.gov/elections/electionresults.aspx.
- ^ "2010 General election results" (PDF). sos.wyo.gov/elections/electionresults.aspx.
- ^ "2008 Democratic Primary election results" (PDF). sos.wyo.gov/elections/electionresults.aspx.
- ^ "2008 General election results" (PDF). sos.wyo.gov/elections/electionresults.aspx.
- ^ "2006 Democratic Primary election results" (PDF). sos.wyo.gov/elections/electionresults.aspx.
- ^ "2006 General election results" (PDF). sos.wyo.gov/elections/electionresults.aspx.
- ^ "2004 Democratic Primary election results" (PDF). sos.wyo.gov/elections/electionresults.aspx.
- ^ "2004 General election results" (PDF). sos.wyo.gov/elections/electionresults.aspx.
- ^ "2002 Democratic Primary election results" (PDF). sos.wyo.gov/elections/electionresults.aspx.
- ^ "2002 General election results" (PDF). sos.wyo.gov/elections/electionresults.aspx.
- ^ "2000 Democratic Primary election results" (PDF). sos.wyo.gov/elections/electionresults.aspx.
- ^ "2000 General election results" (PDF). sos.wyo.gov/elections/electionresults.aspx.
- ^ "1998 Democratic Primary election results" (PDF). sos.wyo.gov/elections/electionresults.aspx.
- ^ "1998 General election results" (PDF). sos.wyo.gov/elections/electionresults.aspx.
- ^ "1996 Democratic Primary election results" (PDF). sos.wyo.gov/elections/electionresults.aspx.
- ^ "1996 General election results" (PDF). sos.wyo.gov/elections/electionresults.aspx.