Hi - nothing to see here, move along...


Graph Methodology
The graphs include all polls from the main table, excluding those which are noted as using non-standard questions.
The date associated with each poll is the mid-point of the survey period, i.e (start+end)/2.
The centered moving averages are the averages of the last 10 polls, weighted by sample size. The date of the moving average is the weighted average poll date. The value of the moving average is variously the percentage for Yes, No, Undecided and the margin ex-undecideds of those polls.
The margin ex-undecideds value for each poll is calculated as (No-Yes)/(No+Yes).
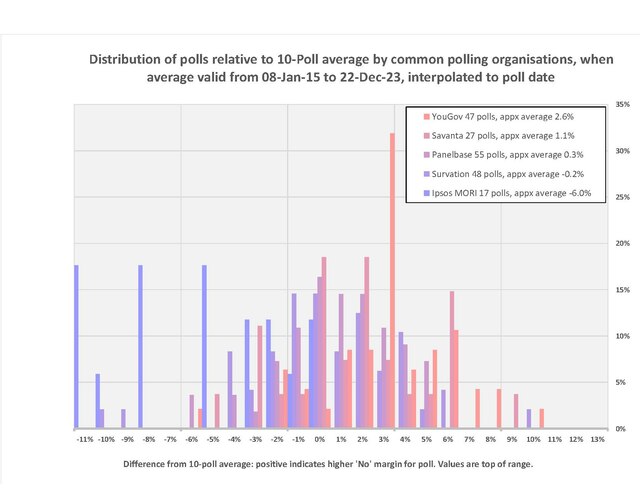
The final chart is the distribution of a given organisations polls compared to the moving average margin ex-undecideds. The value of the moving average at the poll's date is computed by linear interpolation between adjacent values of the moving average. The difference between that value and the poll's value is shown as a distribution.
Frequently time axis dates may be in the future for long-term graphs. This is done to avoid truncation of individual datapoints by the edge of the chart area.