
Size of this JPG preview of this PDF file: 440 × 600 pixels. Other resolutions: 176 × 240 pixels | 352 × 480 pixels | 747 × 1,018 pixels.
Original file (747 × 1,018 pixels, file size: 47 KB, MIME type: application/pdf)
| This is a file from the Wikimedia Commons. Information from its description page there is shown below. Commons is a freely licensed media file repository. You can help. |
Summary
| Description |
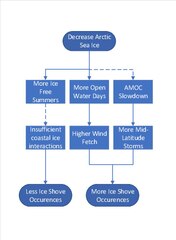
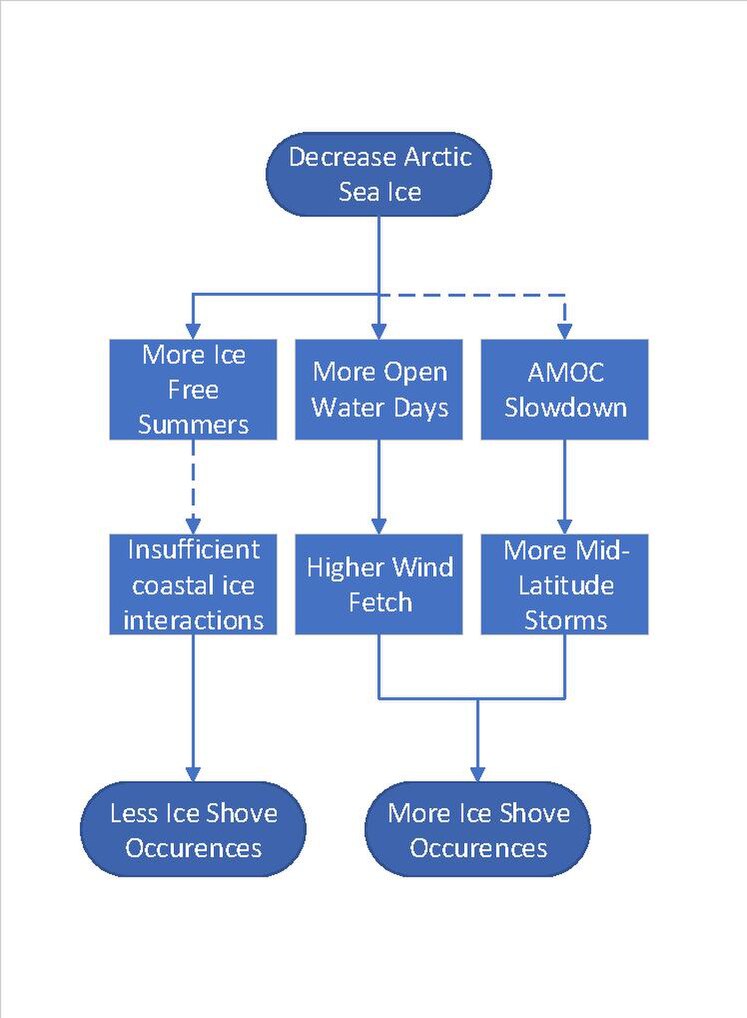
English: A decrease in Arctic Ice has physical effects on ice shove occurence. Regular lines mark solid scientific proof. Dotted lines mark reasonable conjecture/ open research. |
| Date | |
| Source | Own work |
| Author | FranseMolenaar |
Licensing
I, the copyright holder of this work, hereby publish it under the following license:
This file is licensed under the Creative Commons Attribution-Share Alike 4.0 International license.
- You are free:
- to share – to copy, distribute and transmit the work
- to remix – to adapt the work
- Under the following conditions:
- attribution – You must give appropriate credit, provide a link to the license, and indicate if changes were made. You may do so in any reasonable manner, but not in any way that suggests the licensor endorses you or your use.
- share alike – If you remix, transform, or build upon the material, you must distribute your contributions under the same or compatible license as the original.
File history
Click on a date/time to view the file as it appeared at that time.
| Date/Time | Thumbnail | Dimensions | User | Comment | |
|---|---|---|---|---|---|
| current | 10:33, 6 June 2021 |  | 747 × 1,018 (47 KB) | FranseMolenaar | Uploaded own work with UploadWizard |
File usage
The following pages on the English Wikipedia use this file (pages on other projects are not listed):