Chermignon (French pronunciation: [ʃɛʁmiɲɔ̃]) is a former municipality in the district of Sierre in the canton of Valais in Switzerland. On 1 January 2017 the former municipalities of Chermignon, Mollens, Montana and Randogne merged into the new municipality of Crans-Montana.
Chermignon | |
|---|---|
 Coat of arms | |
Location of Chermignon  | |
 Chermignon  Chermignon | |
| Coordinates: 46°19′N 7°28′E / 46.317°N 7.467°E | |
| Country | Switzerland |
| Canton | Valais |
| District | Sierre |
| Government | |
| • Mayor | Jean-Claude Savoy |
| Area | |
| • Total | 5.4 km2 (2.1 sq mi) |
| Elevation | 910 m (2,990 ft) |
| Population (December 2002) | |
| • Total | 2,772 |
| • Density | 510/km2 (1,300/sq mi) |
| Time zone | UTC+01:00 (Central European Time) |
| • Summer (DST) | UTC+02:00 (Central European Summer Time) |
| Postal code(s) | 3971 Chermignon 3963 Crans-sur-Sierre 3971 Ollon |
| SFOS number | 6234 |
| ISO 3166 code | CH-VS |
| Surrounded by | Lens, Montana, Sierre |
| Website | www SFSO statistics |
History edit
Chermignon is first mentioned in 1228 as Chermenon and Chirminon.[2] It became an independent municipality in 1905 when it separated from Lens.[3]
Geography edit
Chermignon had an area, as of 2009[update], of 5.4 square kilometers (2.1 sq mi). Of this area, 2.09 km2 (0.81 sq mi) or 38.8% is used for agricultural purposes, while 1.64 km2 (0.63 sq mi) or 30.5% is forested. Of the rest of the land, 1.54 km2 (0.59 sq mi) or 28.6% is settled (buildings or roads), 0.02 km2 (4.9 acres) or 0.4% is either rivers or lakes and 0.07 km2 (17 acres) or 1.3% is unproductive land.[4]
Of the built up area, industrial buildings made up 1.3% of the total area while housing and buildings made up 17.3% and transportation infrastructure made up 6.1%. while parks, green belts and sports fields made up 3.3%. Out of the forested land, 22.5% of the total land area is heavily forested and 8.0% is covered with orchards or small clusters of trees. Of the agricultural land, 0.2% is used for growing crops and 22.9% is pastures, while 15.8% is used for orchards or vine crops. Of the water in the municipality, 0.2% is in lakes and 0.2% is in rivers and streams.[4]
The former municipality is located in the Sierre district, on the right side of the Rhone river. It consists of the villages of Chermignon d'en Haut (1,168 m [3,832 ft]) and Chermignon d'en Bas (927 m [3,041 ft]) on a terrace, the hamlets of Champzabé (595 m [1,952 ft]) and Ollon at the bottom of the slope and a portion of the resort of Crans-sur-Sierre (1,460 m [4,790 ft]).
Coat of arms edit
The blazon of the municipal coat of arms is Azure, St George argent crined brunatre and haloed Or on a Horse of the second saddled and bridled Gules killing a wyvern Vert with a lance Gules.[5]

Demographics edit
Chermignon had a population (as of 2015[update]) of 2,272. As of 2008[update], 27.3% of the population are resident foreign nationals.[6] Over the last 10 years (2000–2010 ) the population has changed at a rate of 6.3%. It has changed at a rate of 7.1% due to migration and at a rate of 0.8% due to births and deaths.[7]
Most of the population (as of 2000[update]) speaks French (2,261 or 83.4%) as their first language, Italian is the second most common (127 or 4.7%) and Serbo-Croatian is the third (87 or 3.2%). There are 82 people who speak German and 1 person who speaks Romansh.[8]
As of 2008[update], the population was 50.3% male and 49.7% female. The population was made up of 1,054 Swiss men (35.6% of the population) and 435 (14.7%) non-Swiss men. There were 1,067 Swiss women (36.0%) and 406 (13.7%) non-Swiss women.[9] Of the population in the municipality, 1,230 or about 45.4% were born in Chermignon and lived there in 2000. There were 500 or 18.4% who were born in the same canton, while 233 or 8.6% were born elsewhere in Switzerland, and 684 or 25.2% were born outside of Switzerland.[8]
As of 2000[update], children and teenagers (0–19 years old) make up 21.2% of the population, while adults (20–64 years old) make up 61.2% and seniors (over 64 years old) make up 17.6%.[7]
As of 2000[update], there were 1,011 people who were single and never married in the municipality. There were 1,436 married individuals, 146 widows or widowers and 118 individuals who are divorced.[8]
As of 2000[update], there were 1,104 private households in the municipality, and an average of 2.3 persons per household.[7] There were 345 households that consist of only one person and 61 households with five or more people. In 2000[update], a total of 1,070 apartments (51.9% of the total) were permanently occupied, while 939 apartments (45.6%) were seasonally occupied and 52 apartments (2.5%) were empty.[10] As of 2009[update], the construction rate of new housing units was 10.1 new units per 1000 residents.[7] The vacancy rate for the municipality, in 2010[update], was 1.07%.[7]
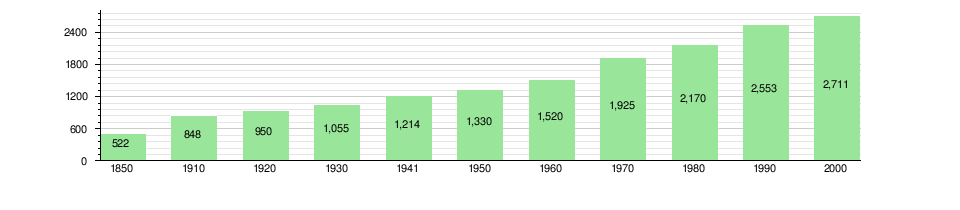
The historical population is given in the following chart:[2][11]
Politics edit
In the 2007 federal election the most popular party was the CVP which received 42.84% of the vote. The next three most popular parties were the SP (19.09%), the SVP (16.4%) and the FDP (13.23%). In the federal election, a total of 1,190 votes were cast, and the voter turnout was 68.6%.[12]
In the 2009 Conseil d'État/Staatsrat election a total of 1,078 votes were cast, of which 67 or about 6.2% were invalid. The voter participation was 63.3%, which is much more than the cantonal average of 54.67%.[13] In the 2007 Swiss Council of States election a total of 1,175 votes were cast, of which 94 or about 8.0% were invalid. The voter participation was 68.9%, which is much more than the cantonal average of 59.88%.[14]
Economy edit
As of 2010[update], Chermignon had an unemployment rate of 4%. As of 2008[update], there were 129 people employed in the primary economic sector and about 60 businesses involved in this sector. 288 people were employed in the secondary sector and there were 32 businesses in this sector. 634 people were employed in the tertiary sector, with 129 businesses in this sector.[7] There were 1,388 residents of the municipality who were employed in some capacity, of which females made up 42.1% of the workforce.
In 2008[update] the total number of full-time equivalent jobs was 890. The number of jobs in the primary sector was 57, of which 53 were in agriculture and 5 were in forestry or lumber production. The number of jobs in the secondary sector was 276 of which 78 or (28.3%) were in manufacturing and 199 (72.1%) were in construction. The number of jobs in the tertiary sector was 557. In the tertiary sector; 179 or 32.1% were in wholesale or retail sales or the repair of motor vehicles, 8 or 1.4% were in the movement and storage of goods, 143 or 25.7% were in a hotel or restaurant, 5 or 0.9% were in the information industry, 49 or 8.8% were the insurance or financial industry, 41 or 7.4% were technical professionals or scientists, 1 was in education and 7 or 1.3% were in health care.[15]
In 2000[update], there were 638 workers who commuted into the municipality and 736 workers who commuted away. The municipality is a net exporter of workers, with about 1.2 workers leaving the municipality for every one entering.[16] Of the working population, 9% used public transportation to get to work, and 61.4% used a private car.[7]
Religion edit
From the 2000 census[update], 2,155 or 79.5% were Roman Catholic, while 133 or 4.9% belonged to the Swiss Reformed Church. Of the rest of the population, there were 142 members of an Orthodox church (or about 5.24% of the population), and there were 23 individuals (or about 0.85% of the population) who belonged to another Christian church. There were 9 individuals (or about 0.33% of the population) who were Jewish, and 23 (or about 0.85% of the population) who were Islamic. There was 1 person who was Hindu and 6 individuals who belonged to another church. 125 (or about 4.61% of the population) belonged to no church, are agnostic or atheist, and 104 individuals (or about 3.84% of the population) did not answer the question.[8]
Education edit
In Chermignon about 897 or (33.1%) of the population have completed non-mandatory upper secondary education, and 381 or (14.1%) have completed additional higher education (either university or a Fachhochschule). Of the 381 who completed tertiary schooling, 49.1% were Swiss men, 24.7% were Swiss women, 16.0% were non-Swiss men and 10.2% were non-Swiss women.[8]
As of 2000[update], there were 47 students in Chermignon who came from another municipality, while 313 residents attended schools outside the municipality.[16]
References edit
- ^ a b "Arealstatistik Standard - Gemeinden nach 4 Hauptbereichen". Federal Statistical Office. Retrieved 13 January 2019.
- ^ a b Chermignon in German, French and Italian in the online Historical Dictionary of Switzerland.
- ^ Amtliches Gemeindeverzeichnis der Schweiz published by the Swiss Federal Statistical Office (in German) accessed 19 July 2011
- ^ a b Swiss Federal Statistical Office-Land Use Statistics 2009 data (in German) accessed 25 March 2010
- ^ Flags of the World.com accessed 23-September-2011
- ^ Swiss Federal Statistical Office - Superweb database - Gemeinde Statistics 1981-2008 Archived June 28, 2010, at the Wayback Machine (in German) accessed 19 June 2010
- ^ a b c d e f g Swiss Federal Statistical Office Archived January 5, 2016, at the Wayback Machine accessed 23-September-2011
- ^ a b c d e STAT-TAB Datenwürfel für Thema 40.3 - 2000 Archived April 9, 2014, at the Wayback Machine (in German) accessed 2 February 2011
- ^ Ständige Wohnbevolkerung nach Geschlecht und Heimat am 31.12.2009.xls (in German and French) accessed 24 August 2011
- ^ Swiss Federal Statistical Office STAT-TAB - Datenwürfel für Thema 09.2 - Gebäude und Wohnungen Archived September 7, 2014, at the Wayback Machine (in German) accessed 28 January 2011
- ^ Swiss Federal Statistical Office STAT-TAB Bevölkerungsentwicklung nach Region, 1850-2000 Archived September 30, 2014, at the Wayback Machine (in German) accessed 29 January 2011
- ^ Swiss Federal Statistical Office, Nationalratswahlen 2007: Stärke der Parteien und Wahlbeteiligung, nach Gemeinden/Bezirk/Canton Archived May 14, 2015, at the Wayback Machine (in German) accessed 28 May 2010
- ^ Staatsratswahlen vom 1. März 2009 (in German) accessed 24 August 2011
- ^ Ständeratswahl 2007 (in German) accessed 24 August 2011
- ^ Swiss Federal Statistical Office STAT-TAB Betriebszählung: Arbeitsstätten nach Gemeinde und NOGA 2008 (Abschnitte), Sektoren 1-3 Archived December 25, 2014, at the Wayback Machine (in German) accessed 28 January 2011
- ^ a b Swiss Federal Statistical Office - Statweb (in German) accessed 24 June 2010
External links edit
- Official website (in French)
- Chermignon in German, French and Italian in the online Historical Dictionary of Switzerland.
- Crans-sur-Sierre in German, French and Italian in the online Historical Dictionary of Switzerland.